
|
|||||
|
 | |
| |
| |
| |
| |
| |
|
Gene: CCND2 |
Gene summary for CCND2 |
| Gene information | Species | Human | Gene symbol | CCND2 | Gene ID | 894 |
| Gene name | cyclin D2 | |
| Gene Alias | KIAK0002 | |
| Cytomap | 12p13.32 | |
| Gene Type | protein-coding | GO ID | GO:0000079 | UniProtAcc | P30279 |
Top |
Malignant transformation analysis |
| Identification of the aberrant gene expression in precancerous and cancerous lesions by comparing the gene expression of stem-like cells in diseased tissues with normal stem cells |
| Entrez ID | Symbol | Replicates | Species | Organ | Tissue | Adj P-value | Log2FC | Malignancy |
| 894 | CCND2 | HTA11_1938_2000001011 | Human | Colorectum | AD | 1.20e-07 | 7.38e-01 | -0.0811 |
| 894 | CCND2 | HTA11_1391_2000001011 | Human | Colorectum | AD | 3.46e-07 | 9.15e-01 | -0.059 |
| 894 | CCND2 | HTA11_10623_2000001011 | Human | Colorectum | AD | 1.89e-02 | 5.39e-01 | -0.0177 |
| 894 | CCND2 | HTA11_6801_2000001011 | Human | Colorectum | SER | 4.53e-15 | 1.33e+00 | 0.0171 |
| 894 | CCND2 | HTA11_7469_2000001011 | Human | Colorectum | AD | 3.57e-05 | 1.01e+00 | -0.0124 |
| 894 | CCND2 | HTA11_99999965062_69753 | Human | Colorectum | MSI-H | 1.60e-02 | 9.32e-01 | 0.3487 |
| 894 | CCND2 | HTA11_99999965104_69814 | Human | Colorectum | MSS | 3.49e-06 | 6.60e-01 | 0.281 |
| 894 | CCND2 | HTA11_99999971662_82457 | Human | Colorectum | MSS | 1.30e-03 | -1.28e-01 | 0.3859 |
| 894 | CCND2 | A002-C-010 | Human | Colorectum | FAP | 1.17e-02 | 9.03e-02 | 0.242 |
| 894 | CCND2 | A015-C-203 | Human | Colorectum | FAP | 2.17e-22 | -1.58e-01 | -0.1294 |
| 894 | CCND2 | A014-C-040 | Human | Colorectum | FAP | 4.11e-03 | 1.47e-01 | -0.1184 |
| 894 | CCND2 | A002-C-201 | Human | Colorectum | FAP | 4.11e-06 | 8.01e-02 | 0.0324 |
| 894 | CCND2 | A001-C-119 | Human | Colorectum | FAP | 2.08e-07 | -5.55e-01 | -0.1557 |
| 894 | CCND2 | A001-C-108 | Human | Colorectum | FAP | 1.70e-11 | -2.31e-01 | -0.0272 |
| 894 | CCND2 | A002-C-205 | Human | Colorectum | FAP | 8.45e-14 | -1.07e-01 | -0.1236 |
| 894 | CCND2 | A015-C-006 | Human | Colorectum | FAP | 3.80e-08 | -4.19e-01 | -0.0994 |
| 894 | CCND2 | A015-C-106 | Human | Colorectum | FAP | 1.73e-08 | -1.79e-01 | -0.0511 |
| 894 | CCND2 | A002-C-114 | Human | Colorectum | FAP | 2.05e-10 | -2.67e-01 | -0.1561 |
| 894 | CCND2 | A015-C-104 | Human | Colorectum | FAP | 8.83e-25 | -2.66e-01 | -0.1899 |
| 894 | CCND2 | A001-C-014 | Human | Colorectum | FAP | 1.31e-12 | -1.93e-01 | 0.0135 |
| Page: 1 2 3 4 5 |
| Tissue | Expression Dynamics | Abbreviation |
| Colorectum (GSE201348) |  | FAP: Familial adenomatous polyposis |
| CRC: Colorectal cancer | ||
| Colorectum (HTA11) |  | AD: Adenomas |
| SER: Sessile serrated lesions | ||
| MSI-H: Microsatellite-high colorectal cancer | ||
| MSS: Microsatellite stable colorectal cancer | ||
| Esophagus |  | ESCC: Esophageal squamous cell carcinoma |
| HGIN: High-grade intraepithelial neoplasias | ||
| LGIN: Low-grade intraepithelial neoplasias | ||
| Oral Cavity |  | EOLP: Erosive Oral lichen planus |
| LP: leukoplakia | ||
| NEOLP: Non-erosive oral lichen planus | ||
| OSCC: Oral squamous cell carcinoma | ||
| Prostate | 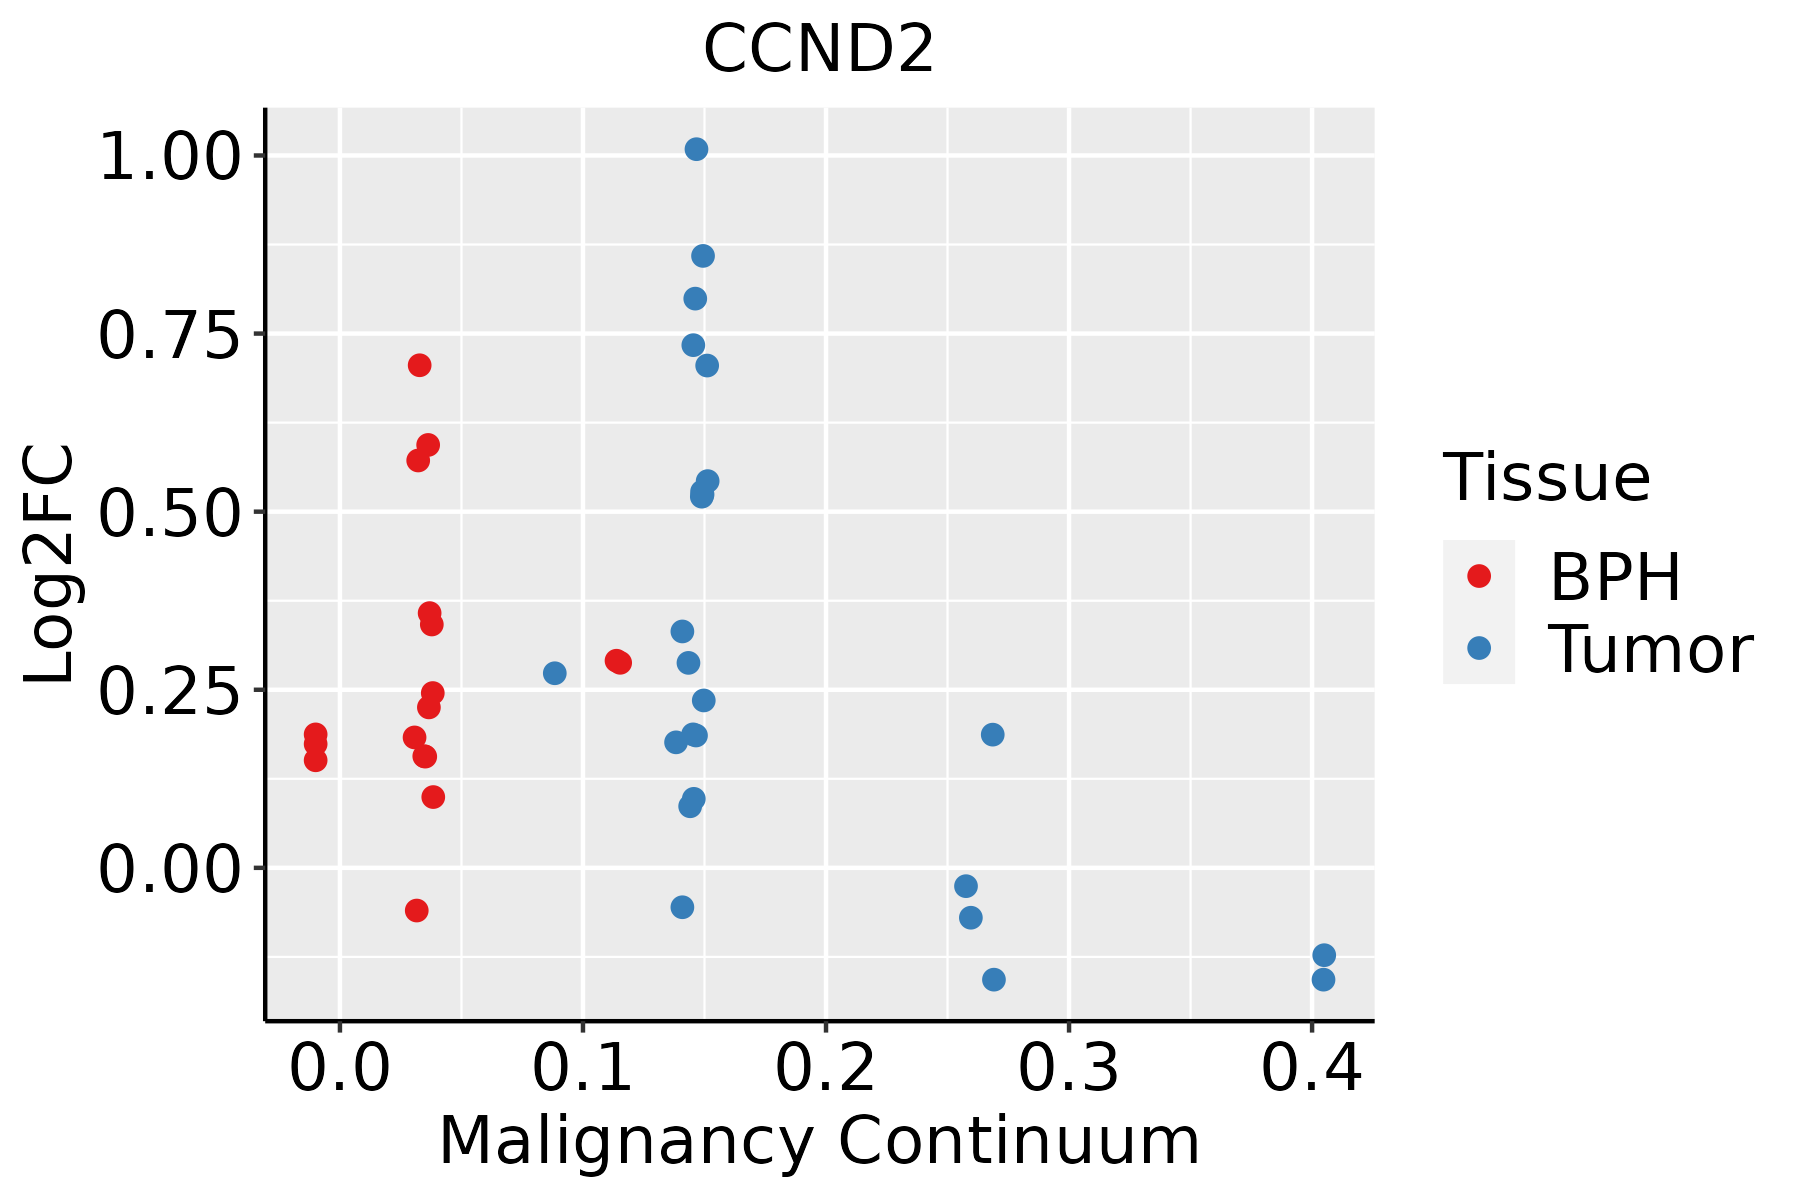 | BPH: Benign Prostatic Hyperplasia |
| Skin | 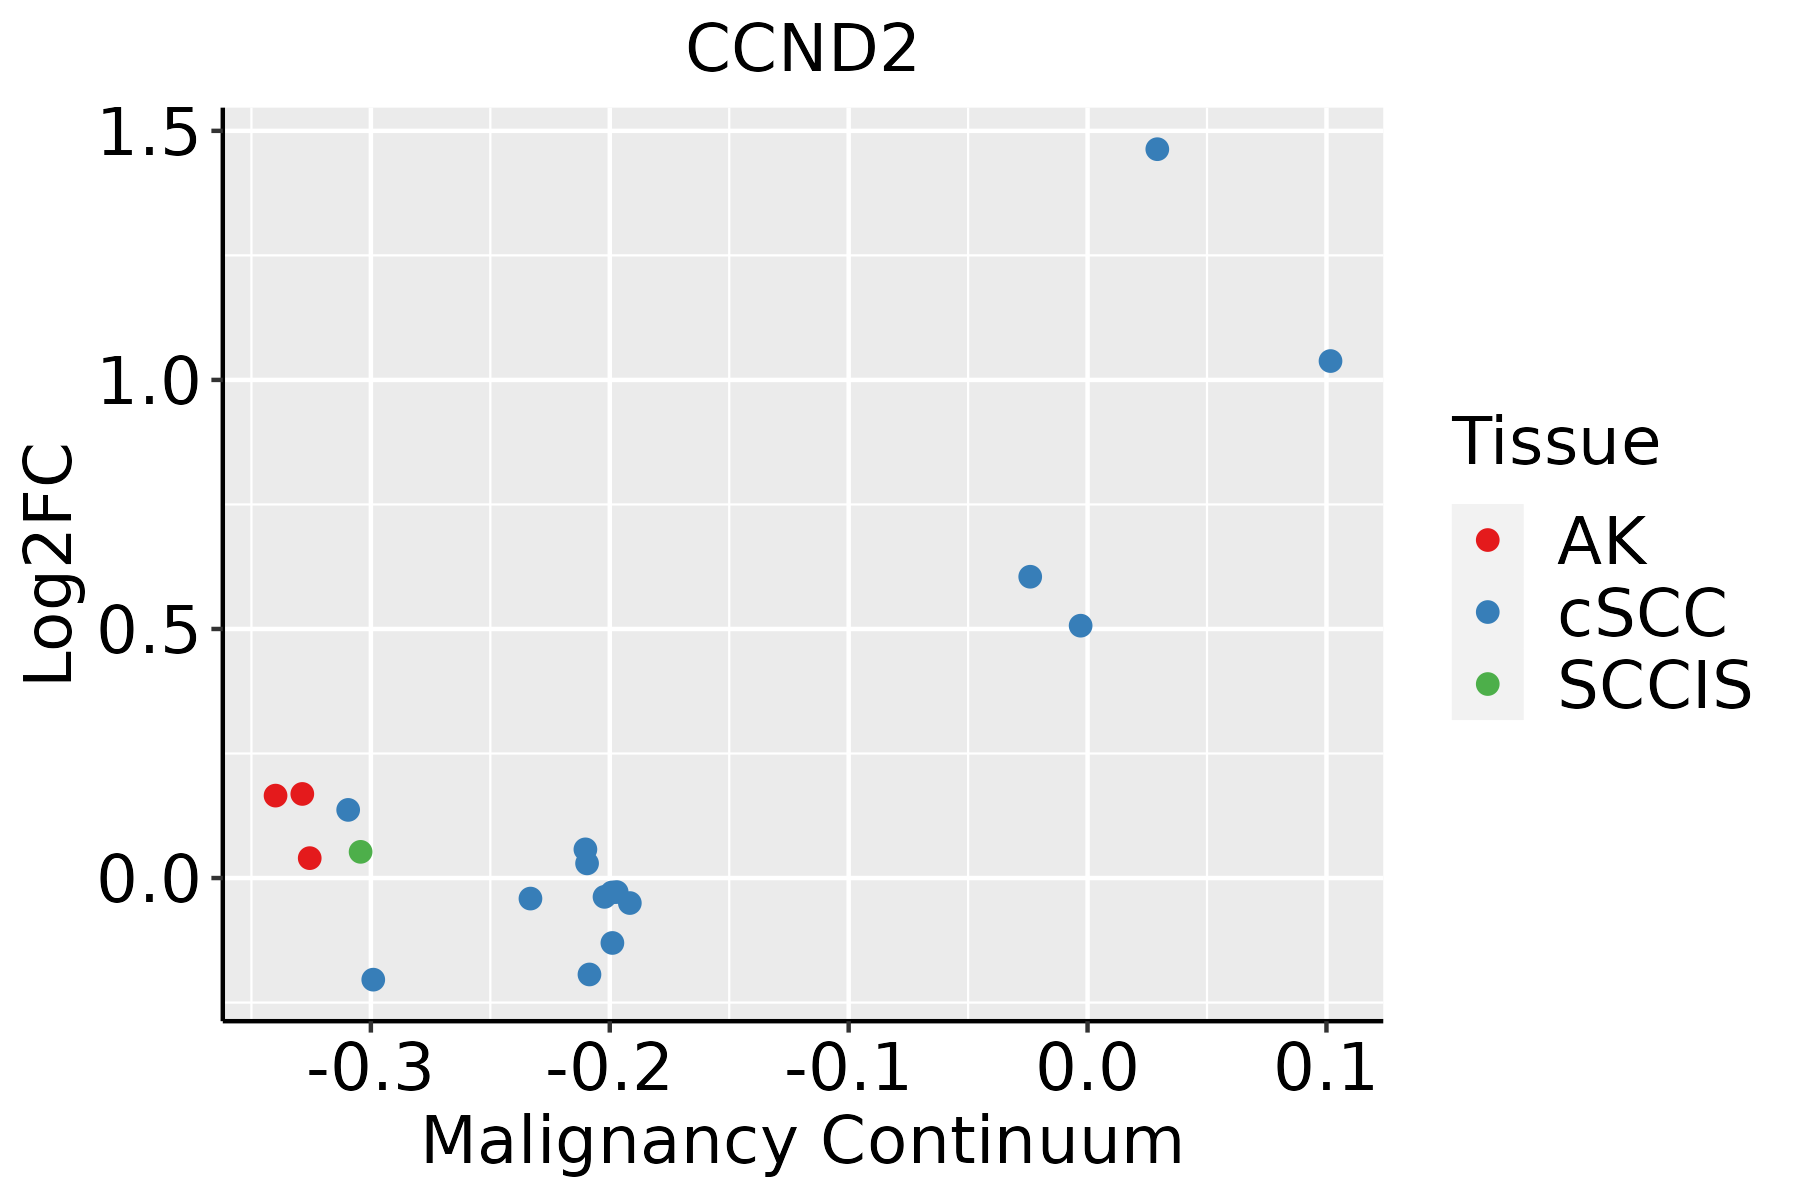 | AK: Actinic keratosis |
| cSCC: Cutaneous squamous cell carcinoma | ||
| SCCIS:squamous cell carcinoma in situ | ||
| Thyroid | 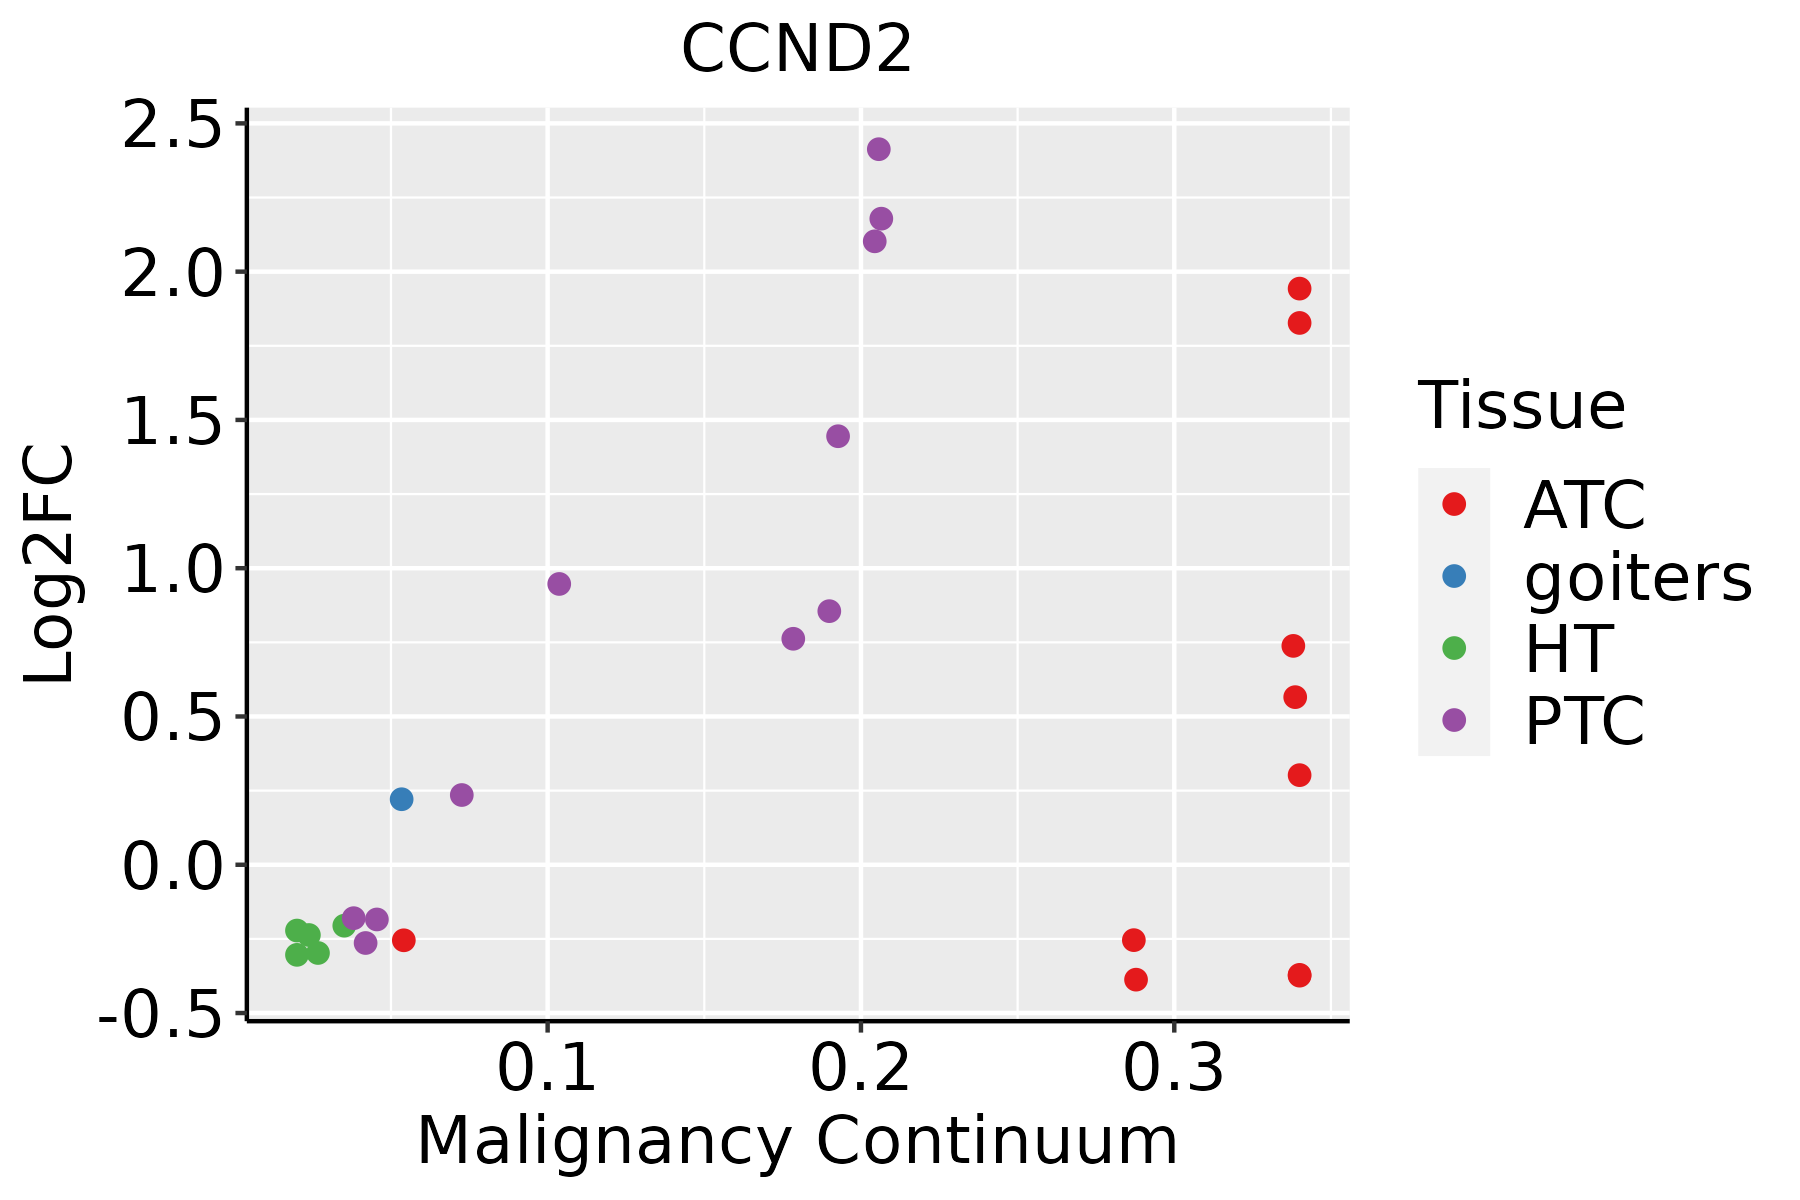 | ATC: Anaplastic thyroid cancer |
| HT: Hashimoto's thyroiditis | ||
| PTC: Papillary thyroid cancer |
| ∗log2FC in expression of this searched gene in stem-like cells from each diseased tissue sample relative to stem-like cells in normal samples in each tissue plotted against the malignancy continuum. Samples are colored based on if they are from different disease stage. |
Top |
Malignant transformation related pathway analysis |
| Find out the enriched GO biological processes and KEGG pathways involved in transition from healthy to precancer to cancer |
| Tissue | Disease Stage | Enriched GO biological Processes |
| Colorectum | AD |  |
| Colorectum | SER |  |
| Colorectum | MSS |  |
| Colorectum | MSI-H |  |
| Colorectum | FAP |  |
| ∗Top 15 enriched GO BP terms are showed in the bar plot of each disease state in each tissue. Each row represents a significant GO biological process which is colored according to the -log10(p.adjust). |
| Page: 1 2 3 4 5 6 7 8 9 |
| GO ID | Tissue | Disease Stage | Description | Gene Ratio | Bg Ratio | pvalue | p.adjust | Count |
| GO:0033674 | Colorectum | AD | positive regulation of kinase activity | 131/3918 | 467/18723 | 1.28e-04 | 1.85e-03 | 131 |
| GO:0045860 | Colorectum | AD | positive regulation of protein kinase activity | 107/3918 | 386/18723 | 8.01e-04 | 7.92e-03 | 107 |
| GO:0071900 | Colorectum | AD | regulation of protein serine/threonine kinase activity | 98/3918 | 359/18723 | 2.18e-03 | 1.73e-02 | 98 |
| GO:0071481 | Colorectum | AD | cellular response to X-ray | 8/3918 | 14/18723 | 3.23e-03 | 2.38e-02 | 8 |
| GO:0071902 | Colorectum | AD | positive regulation of protein serine/threonine kinase activity | 58/3918 | 200/18723 | 4.09e-03 | 2.84e-02 | 58 |
| GO:0007346 | Colorectum | AD | regulation of mitotic cell cycle | 119/3918 | 457/18723 | 4.60e-03 | 3.14e-02 | 119 |
| GO:0045787 | Colorectum | AD | positive regulation of cell cycle | 85/3918 | 313/18723 | 4.76e-03 | 3.22e-02 | 85 |
| GO:0045931 | Colorectum | AD | positive regulation of mitotic cell cycle | 37/3918 | 121/18723 | 7.88e-03 | 4.73e-02 | 37 |
| GO:00336741 | Colorectum | SER | positive regulation of kinase activity | 95/2897 | 467/18723 | 2.62e-03 | 2.41e-02 | 95 |
| GO:00714811 | Colorectum | SER | cellular response to X-ray | 7/2897 | 14/18723 | 2.64e-03 | 2.41e-02 | 7 |
| GO:00458601 | Colorectum | SER | positive regulation of protein kinase activity | 79/2897 | 386/18723 | 4.85e-03 | 3.79e-02 | 79 |
| GO:00719001 | Colorectum | SER | regulation of protein serine/threonine kinase activity | 74/2897 | 359/18723 | 5.22e-03 | 3.96e-02 | 74 |
| GO:00336742 | Colorectum | MSS | positive regulation of kinase activity | 122/3467 | 467/18723 | 2.50e-05 | 5.21e-04 | 122 |
| GO:00458602 | Colorectum | MSS | positive regulation of protein kinase activity | 102/3467 | 386/18723 | 6.93e-05 | 1.20e-03 | 102 |
| GO:00719002 | Colorectum | MSS | regulation of protein serine/threonine kinase activity | 93/3467 | 359/18723 | 2.98e-04 | 3.91e-03 | 93 |
| GO:00719021 | Colorectum | MSS | positive regulation of protein serine/threonine kinase activity | 55/3467 | 200/18723 | 1.12e-03 | 1.11e-02 | 55 |
| GO:00457871 | Colorectum | MSS | positive regulation of cell cycle | 80/3467 | 313/18723 | 1.15e-03 | 1.12e-02 | 80 |
| GO:00714812 | Colorectum | MSS | cellular response to X-ray | 8/3467 | 14/18723 | 1.42e-03 | 1.32e-02 | 8 |
| GO:00073461 | Colorectum | MSS | regulation of mitotic cell cycle | 108/3467 | 457/18723 | 3.30e-03 | 2.50e-02 | 108 |
| GO:0090068 | Colorectum | MSS | positive regulation of cell cycle process | 60/3467 | 236/18723 | 5.01e-03 | 3.46e-02 | 60 |
| Page: 1 2 3 4 5 6 7 8 9 10 11 12 13 14 15 |
| Pathway ID | Tissue | Disease Stage | Description | Gene Ratio | Bg Ratio | pvalue | p.adjust | qvalue | Count |
| hsa04510 | Colorectum | AD | Focal adhesion | 67/2092 | 203/8465 | 4.40e-03 | 2.17e-02 | 1.38e-02 | 67 |
| hsa05166 | Colorectum | AD | Human T-cell leukemia virus 1 infection | 72/2092 | 222/8465 | 5.24e-03 | 2.44e-02 | 1.55e-02 | 72 |
| hsa04218 | Colorectum | AD | Cellular senescence | 53/2092 | 156/8465 | 5.55e-03 | 2.48e-02 | 1.58e-02 | 53 |
| hsa04310 | Colorectum | AD | Wnt signaling pathway | 56/2092 | 171/8465 | 1.03e-02 | 3.93e-02 | 2.51e-02 | 56 |
| hsa045101 | Colorectum | AD | Focal adhesion | 67/2092 | 203/8465 | 4.40e-03 | 2.17e-02 | 1.38e-02 | 67 |
| hsa051661 | Colorectum | AD | Human T-cell leukemia virus 1 infection | 72/2092 | 222/8465 | 5.24e-03 | 2.44e-02 | 1.55e-02 | 72 |
| hsa042181 | Colorectum | AD | Cellular senescence | 53/2092 | 156/8465 | 5.55e-03 | 2.48e-02 | 1.58e-02 | 53 |
| hsa043101 | Colorectum | AD | Wnt signaling pathway | 56/2092 | 171/8465 | 1.03e-02 | 3.93e-02 | 2.51e-02 | 56 |
| hsa042182 | Colorectum | MSS | Cellular senescence | 52/1875 | 156/8465 | 7.87e-04 | 5.07e-03 | 3.11e-03 | 52 |
| hsa05169 | Colorectum | MSS | Epstein-Barr virus infection | 63/1875 | 202/8465 | 1.63e-03 | 8.98e-03 | 5.50e-03 | 63 |
| hsa051662 | Colorectum | MSS | Human T-cell leukemia virus 1 infection | 68/1875 | 222/8465 | 1.84e-03 | 9.61e-03 | 5.89e-03 | 68 |
| hsa043102 | Colorectum | MSS | Wnt signaling pathway | 53/1875 | 171/8465 | 4.24e-03 | 1.86e-02 | 1.14e-02 | 53 |
| hsa04390 | Colorectum | MSS | Hippo signaling pathway | 48/1875 | 157/8465 | 8.32e-03 | 3.10e-02 | 1.90e-02 | 48 |
| hsa042183 | Colorectum | MSS | Cellular senescence | 52/1875 | 156/8465 | 7.87e-04 | 5.07e-03 | 3.11e-03 | 52 |
| hsa051691 | Colorectum | MSS | Epstein-Barr virus infection | 63/1875 | 202/8465 | 1.63e-03 | 8.98e-03 | 5.50e-03 | 63 |
| hsa051663 | Colorectum | MSS | Human T-cell leukemia virus 1 infection | 68/1875 | 222/8465 | 1.84e-03 | 9.61e-03 | 5.89e-03 | 68 |
| hsa043103 | Colorectum | MSS | Wnt signaling pathway | 53/1875 | 171/8465 | 4.24e-03 | 1.86e-02 | 1.14e-02 | 53 |
| hsa043901 | Colorectum | MSS | Hippo signaling pathway | 48/1875 | 157/8465 | 8.32e-03 | 3.10e-02 | 1.90e-02 | 48 |
| hsa045102 | Colorectum | FAP | Focal adhesion | 61/1404 | 203/8465 | 1.03e-06 | 2.15e-05 | 1.31e-05 | 61 |
| hsa043104 | Colorectum | FAP | Wnt signaling pathway | 46/1404 | 171/8465 | 3.94e-04 | 3.06e-03 | 1.86e-03 | 46 |
| Page: 1 2 3 4 5 6 7 8 9 10 |
Top |
Cell-cell communication analysis |
| Identification of potential cell-cell interactions between two cell types and their ligand-receptor pairs for different disease states |
| Ligand | Receptor | LRpair | Pathway | Tissue | Disease Stage |
| Page: 1 |
Top |
Single-cell gene regulatory network inference analysis |
| Find out the significant the regulons (TFs) and the target genes of each regulon across cell types for different disease states |
| TF | Cell Type | Tissue | Disease Stage | Target Gene | RSS | Regulon Activity |
| ∗The dot plots of a searched regulon are shown for all cell subpopulations in each disease state of each tissue based on the regulon specific score inferred using pySCENIC and by calculating the average expression. |
| Page: 1 |
Top |
Somatic mutation of malignant transformation related genes |
| Annotation of somatic variants for genes involved in malignant transformation |
| Hugo Symbol | Variant Class | Variant Classification | dbSNP RS | HGVSc | HGVSp | HGVSp Short | SWISSPROT | BIOTYPE | SIFT | PolyPhen | Tumor Sample Barcode | Tissue | Histology | Sex | Age | Stage | Therapy Types | Drugs | Outcome |
| CCND2 | SNV | Missense_Mutation | c.556G>A | p.Ala186Thr | p.A186T | P30279 | protein_coding | tolerated(0.06) | possibly_damaging(0.762) | TCGA-AN-A0AK-01 | Breast | breast invasive carcinoma | Female | >=65 | I/II | Unknown | Unknown | SD | |
| CCND2 | SNV | Missense_Mutation | rs775067994 | c.493N>T | p.Arg165Cys | p.R165C | P30279 | protein_coding | tolerated(0.05) | benign(0.06) | TCGA-E9-A5FL-01 | Breast | breast invasive carcinoma | Female | >=65 | I/II | Unknown | Unknown | SD |
| CCND2 | SNV | Missense_Mutation | c.318G>C | p.Met106Ile | p.M106I | P30279 | protein_coding | deleterious(0.05) | benign(0.028) | TCGA-A6-3809-01 | Colorectum | colon adenocarcinoma | Female | >=65 | I/II | Unknown | Unknown | SD | |
| CCND2 | SNV | Missense_Mutation | novel | c.59T>G | p.Leu20Arg | p.L20R | P30279 | protein_coding | deleterious(0) | probably_damaging(0.962) | TCGA-A5-A0G2-01 | Endometrium | uterine corpus endometrioid carcinoma | Female | <65 | III/IV | Unknown | Unknown | SD |
| CCND2 | SNV | Missense_Mutation | c.593C>T | p.Pro198Leu | p.P198L | P30279 | protein_coding | deleterious(0.03) | possibly_damaging(0.778) | TCGA-A5-A0G2-01 | Endometrium | uterine corpus endometrioid carcinoma | Female | <65 | III/IV | Unknown | Unknown | SD | |
| CCND2 | SNV | Missense_Mutation | novel | c.421C>A | p.Leu141Met | p.L141M | P30279 | protein_coding | deleterious(0) | probably_damaging(0.912) | TCGA-A5-A0GG-01 | Endometrium | uterine corpus endometrioid carcinoma | Female | >=65 | I/II | Unknown | Unknown | SD |
| CCND2 | SNV | Missense_Mutation | novel | c.26N>G | p.Asp9Gly | p.D9G | P30279 | protein_coding | tolerated(0.11) | probably_damaging(0.984) | TCGA-AJ-A23O-01 | Endometrium | uterine corpus endometrioid carcinoma | Female | >=65 | I/II | Unknown | Unknown | SD |
| CCND2 | SNV | Missense_Mutation | c.244N>C | p.Asn82His | p.N82H | P30279 | protein_coding | deleterious(0.04) | possibly_damaging(0.858) | TCGA-AP-A051-01 | Endometrium | uterine corpus endometrioid carcinoma | Female | >=65 | I/II | Unknown | Unknown | SD | |
| CCND2 | SNV | Missense_Mutation | c.607N>A | p.Ala203Thr | p.A203T | P30279 | protein_coding | deleterious(0) | probably_damaging(0.95) | TCGA-AP-A0LM-01 | Endometrium | uterine corpus endometrioid carcinoma | Female | <65 | III/IV | Chemotherapy | cisplatin | SD | |
| CCND2 | SNV | Missense_Mutation | c.853N>T | p.Arg285Trp | p.R285W | P30279 | protein_coding | deleterious(0) | probably_damaging(0.949) | TCGA-AP-A0LM-01 | Endometrium | uterine corpus endometrioid carcinoma | Female | <65 | III/IV | Chemotherapy | cisplatin | SD |
| Page: 1 2 3 4 |
Top |
Related drugs of malignant transformation related genes |
| Identification of chemicals and drugs interact with genes involved in malignant transfromation |
| (DGIdb 4.0) |
| Entrez ID | Symbol | Category | Interaction Types | Drug Claim Name | Drug Name | PMIDs |
| 894 | CCND2 | DRUGGABLE GENOME, CLINICALLY ACTIONABLE, TRANSCRIPTION FACTOR, KINASE | BAY1000394 | |||
| 894 | CCND2 | DRUGGABLE GENOME, CLINICALLY ACTIONABLE, TRANSCRIPTION FACTOR, KINASE | LEE011 | RIBOCICLIB | ||
| 894 | CCND2 | DRUGGABLE GENOME, CLINICALLY ACTIONABLE, TRANSCRIPTION FACTOR, KINASE | PD 0332991 | |||
| 894 | CCND2 | DRUGGABLE GENOME, CLINICALLY ACTIONABLE, TRANSCRIPTION FACTOR, KINASE | LY2835219 | ABEMACICLIB | ||
| 894 | CCND2 | DRUGGABLE GENOME, CLINICALLY ACTIONABLE, TRANSCRIPTION FACTOR, KINASE | 5-AZA-2-DEOXYCYTIDINE | 12771922 |
| Page: 1 |

Copyright 2023-Present -The University of Texas Health Science Center at Houston |