
|
|||||
|
 | |
| |
| |
| |
| |
| |
|
Gene: CCNB1IP1 |
Gene summary for CCNB1IP1 |
| Gene information | Species | Human | Gene symbol | CCNB1IP1 | Gene ID | 57820 |
| Gene name | cyclin B1 interacting protein 1 | |
| Gene Alias | C14orf18 | |
| Cytomap | 14q11.2 | |
| Gene Type | protein-coding | GO ID | GO:0000003 | UniProtAcc | Q9NPC3 |
Top |
Malignant transformation analysis |
| Identification of the aberrant gene expression in precancerous and cancerous lesions by comparing the gene expression of stem-like cells in diseased tissues with normal stem cells |
| Entrez ID | Symbol | Replicates | Species | Organ | Tissue | Adj P-value | Log2FC | Malignancy |
| 57820 | CCNB1IP1 | LZE4T | Human | Esophagus | ESCC | 6.82e-15 | 5.47e-01 | 0.0811 |
| 57820 | CCNB1IP1 | LZE8T | Human | Esophagus | ESCC | 2.82e-07 | 3.47e-01 | 0.067 |
| 57820 | CCNB1IP1 | LZE20T | Human | Esophagus | ESCC | 2.11e-03 | 1.81e-01 | 0.0662 |
| 57820 | CCNB1IP1 | LZE22D1 | Human | Esophagus | HGIN | 4.33e-02 | -5.57e-02 | 0.0595 |
| 57820 | CCNB1IP1 | LZE24T | Human | Esophagus | ESCC | 5.51e-14 | 5.64e-01 | 0.0596 |
| 57820 | CCNB1IP1 | LZE21T | Human | Esophagus | ESCC | 1.04e-04 | 3.84e-01 | 0.0655 |
| 57820 | CCNB1IP1 | LZE6T | Human | Esophagus | ESCC | 9.92e-03 | 1.59e-01 | 0.0845 |
| 57820 | CCNB1IP1 | P2T-E | Human | Esophagus | ESCC | 2.40e-45 | 9.55e-01 | 0.1177 |
| 57820 | CCNB1IP1 | P4T-E | Human | Esophagus | ESCC | 1.43e-33 | 1.02e+00 | 0.1323 |
| 57820 | CCNB1IP1 | P5T-E | Human | Esophagus | ESCC | 7.32e-19 | 2.40e-01 | 0.1327 |
| 57820 | CCNB1IP1 | P8T-E | Human | Esophagus | ESCC | 1.98e-23 | 4.10e-01 | 0.0889 |
| 57820 | CCNB1IP1 | P9T-E | Human | Esophagus | ESCC | 1.64e-20 | 5.79e-01 | 0.1131 |
| 57820 | CCNB1IP1 | P10T-E | Human | Esophagus | ESCC | 1.09e-69 | 1.54e+00 | 0.116 |
| 57820 | CCNB1IP1 | P11T-E | Human | Esophagus | ESCC | 3.69e-06 | 4.89e-01 | 0.1426 |
| 57820 | CCNB1IP1 | P12T-E | Human | Esophagus | ESCC | 1.31e-44 | 1.00e+00 | 0.1122 |
| 57820 | CCNB1IP1 | P15T-E | Human | Esophagus | ESCC | 9.03e-63 | 1.66e+00 | 0.1149 |
| 57820 | CCNB1IP1 | P16T-E | Human | Esophagus | ESCC | 1.46e-48 | 1.04e+00 | 0.1153 |
| 57820 | CCNB1IP1 | P17T-E | Human | Esophagus | ESCC | 4.16e-09 | 4.54e-01 | 0.1278 |
| 57820 | CCNB1IP1 | P19T-E | Human | Esophagus | ESCC | 1.59e-02 | 4.60e-01 | 0.1662 |
| 57820 | CCNB1IP1 | P20T-E | Human | Esophagus | ESCC | 9.26e-24 | 5.80e-01 | 0.1124 |
| Page: 1 2 3 4 5 6 |
| Tissue | Expression Dynamics | Abbreviation |
| Esophagus | 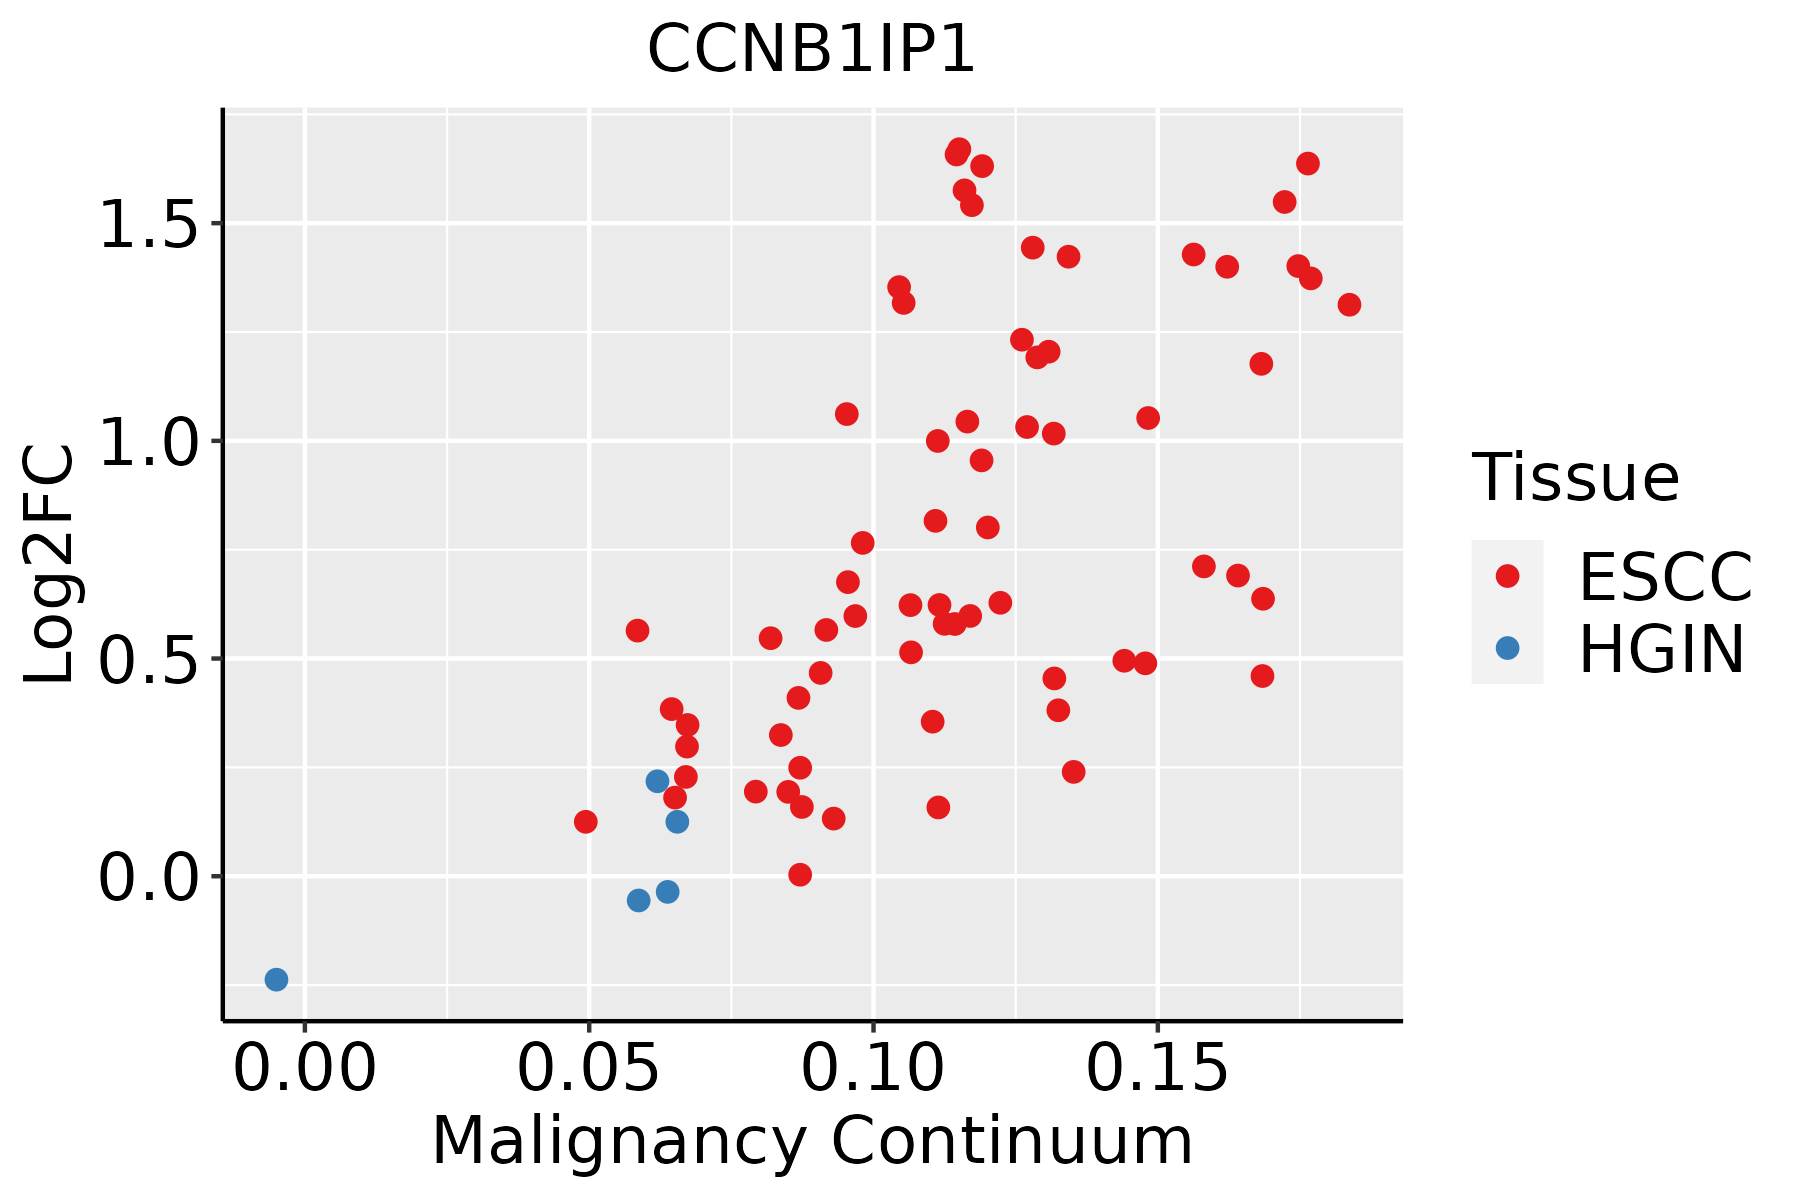 | ESCC: Esophageal squamous cell carcinoma |
| HGIN: High-grade intraepithelial neoplasias | ||
| LGIN: Low-grade intraepithelial neoplasias | ||
| Liver | 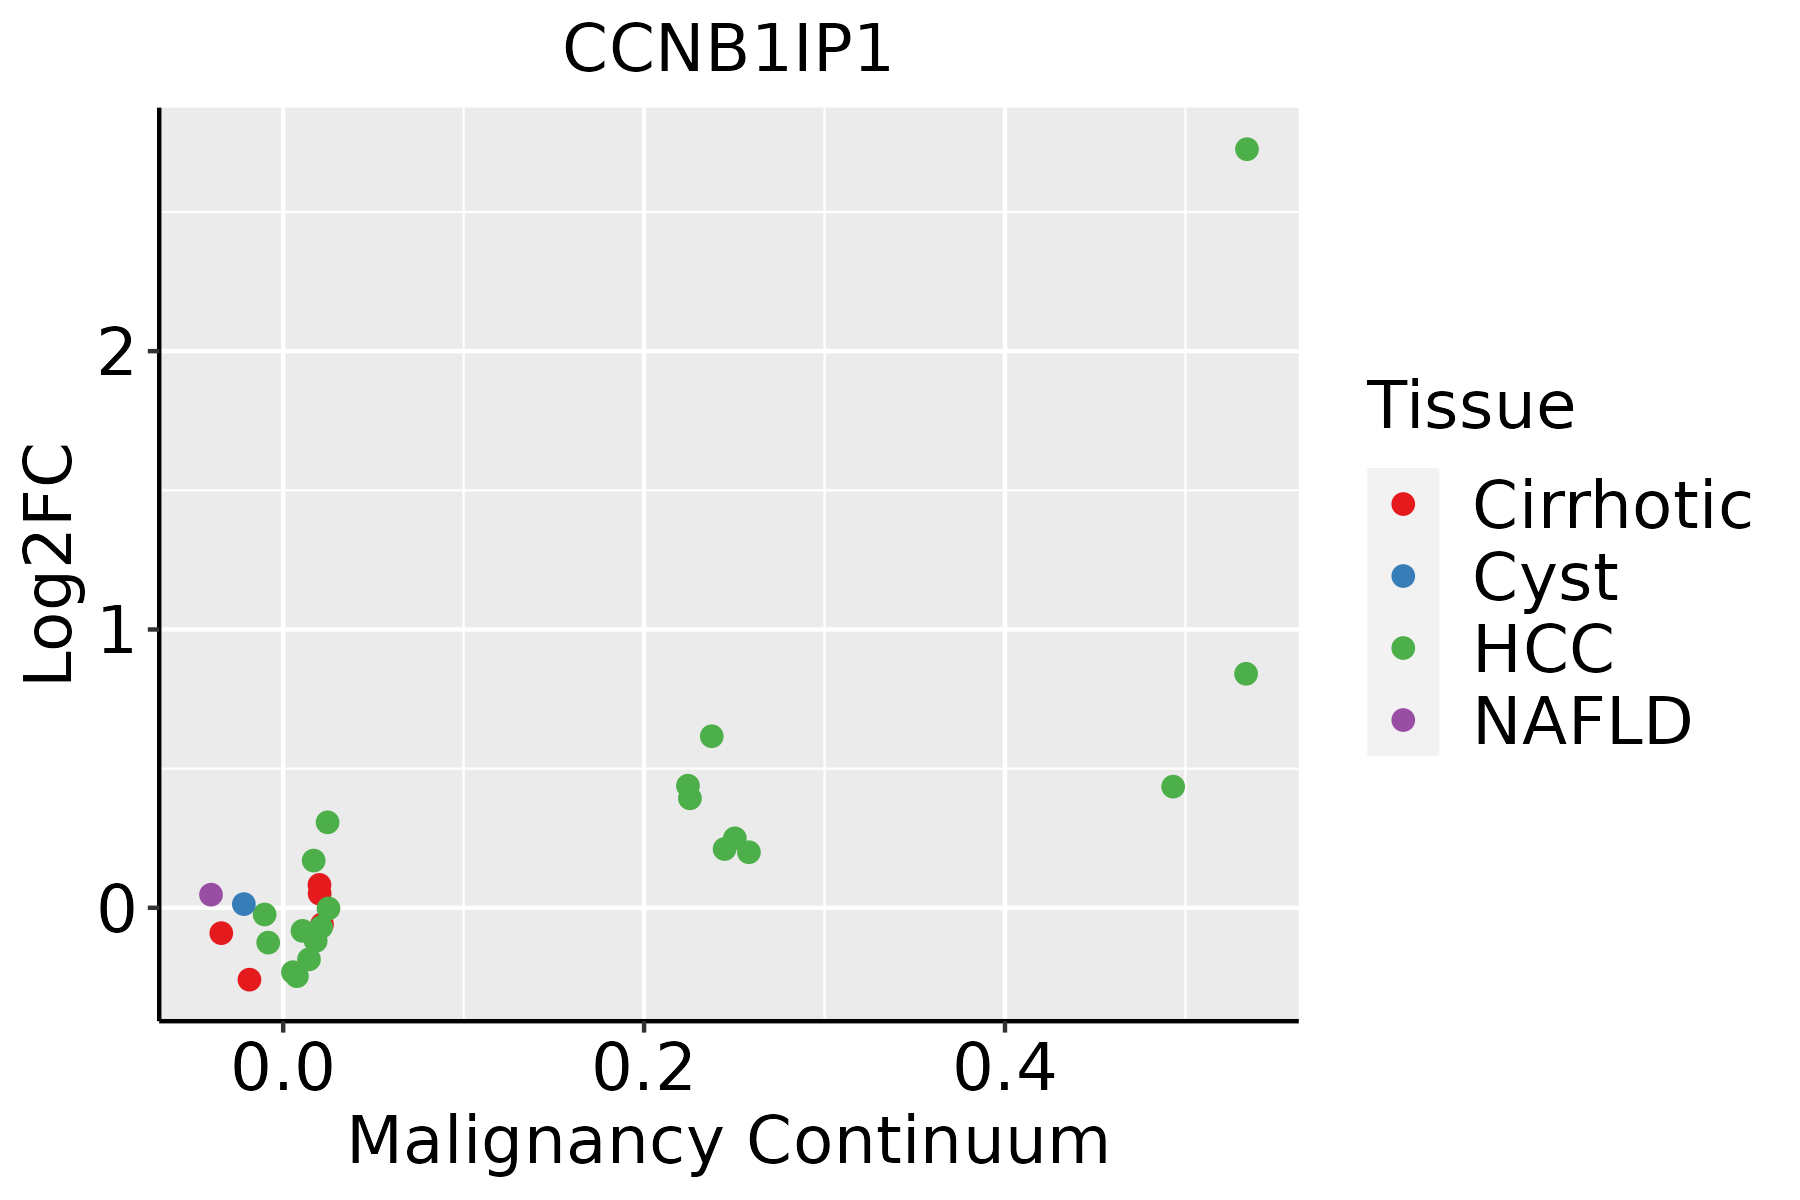 | HCC: Hepatocellular carcinoma |
| NAFLD: Non-alcoholic fatty liver disease | ||
| Oral Cavity | 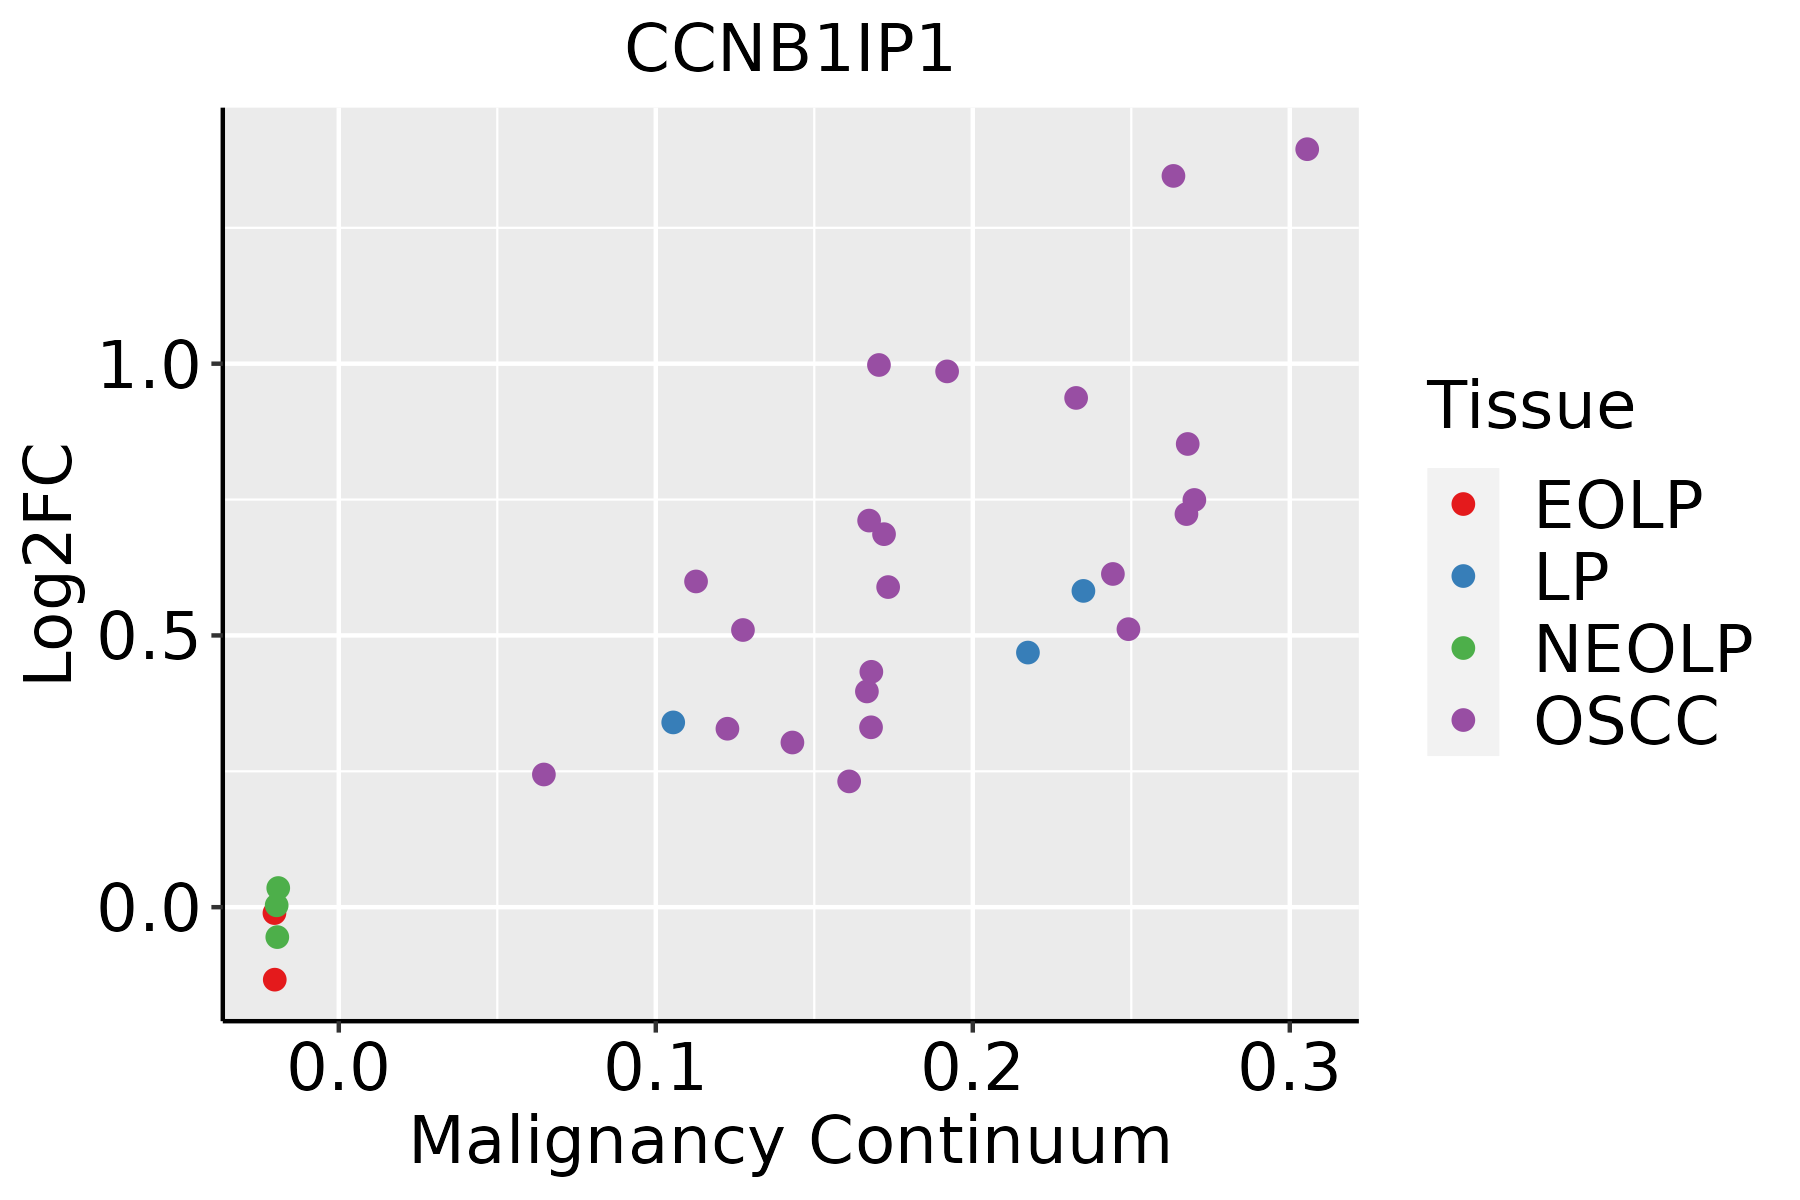 | EOLP: Erosive Oral lichen planus |
| LP: leukoplakia | ||
| NEOLP: Non-erosive oral lichen planus | ||
| OSCC: Oral squamous cell carcinoma | ||
| Skin | 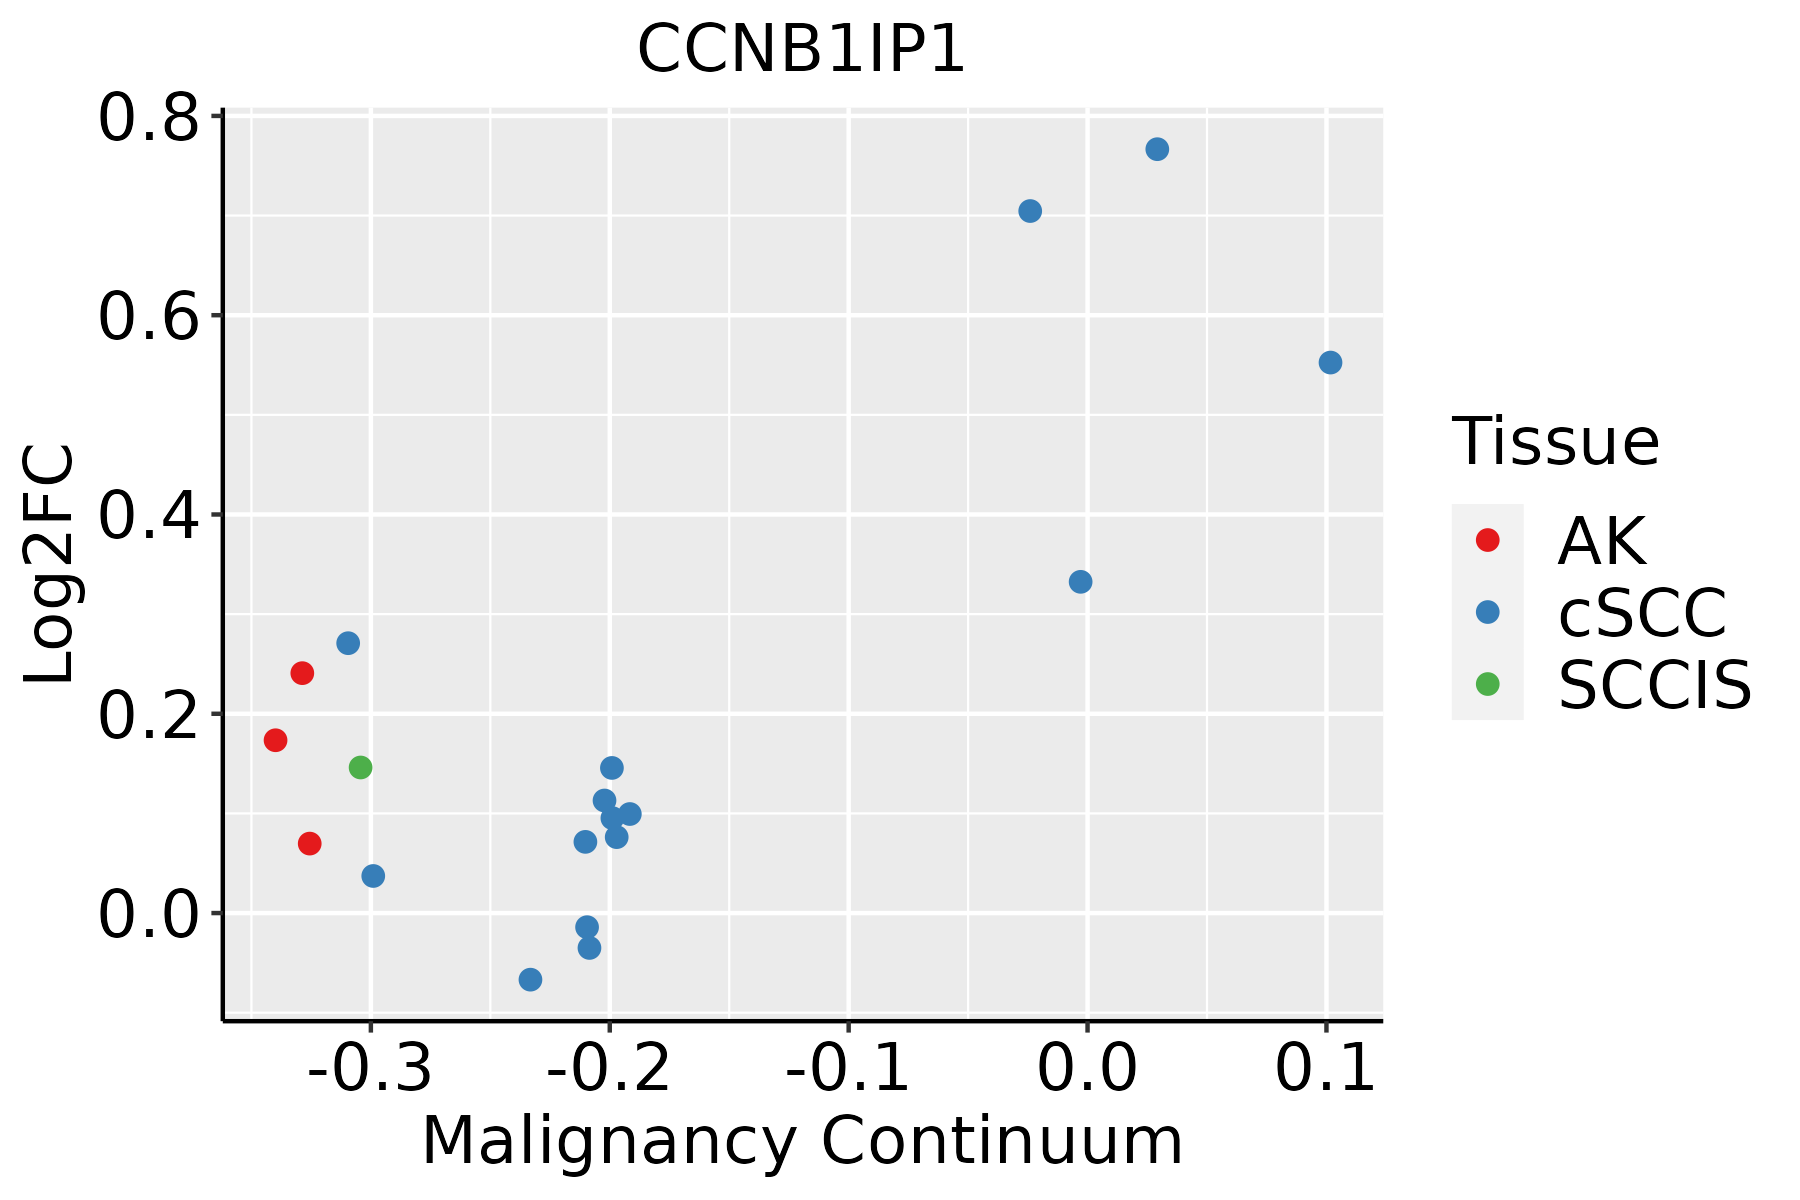 | AK: Actinic keratosis |
| cSCC: Cutaneous squamous cell carcinoma | ||
| SCCIS:squamous cell carcinoma in situ | ||
| Thyroid | 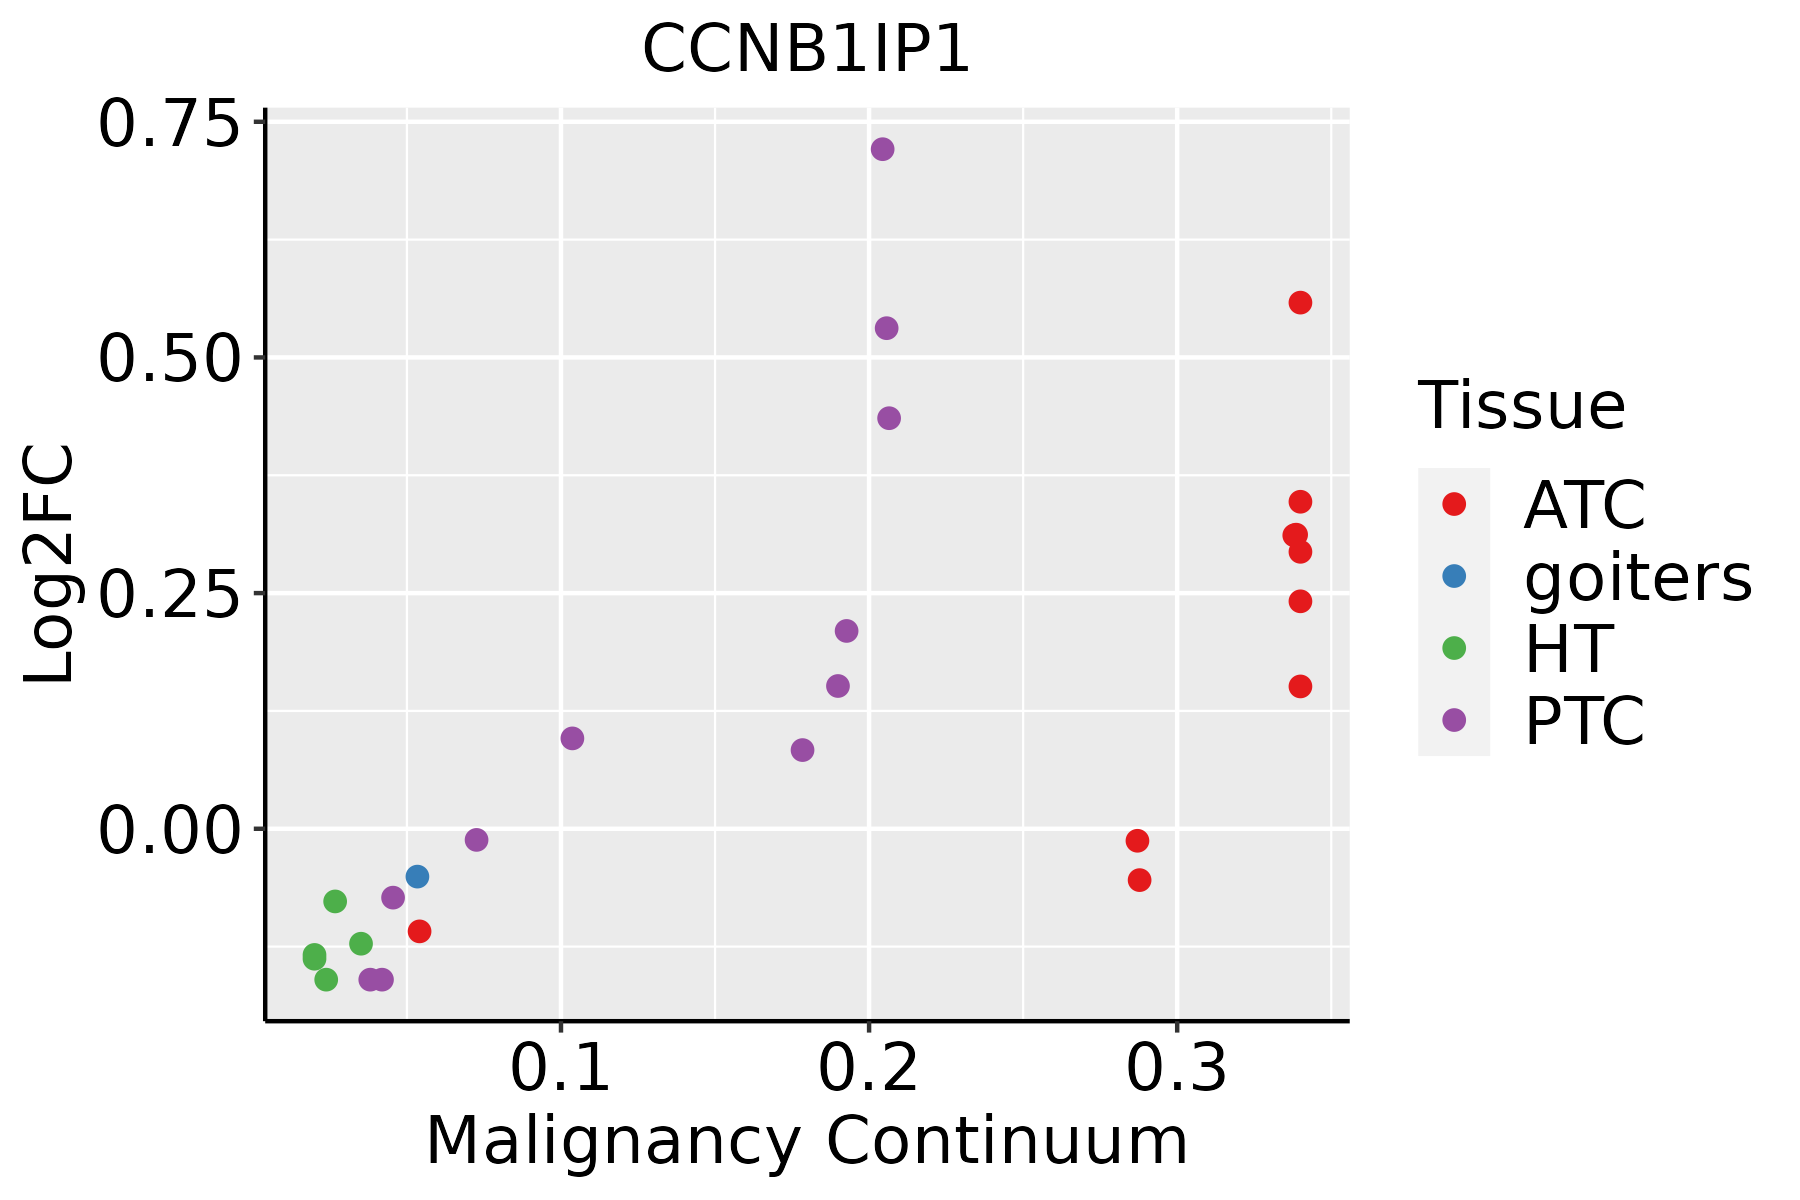 | ATC: Anaplastic thyroid cancer |
| HT: Hashimoto's thyroiditis | ||
| PTC: Papillary thyroid cancer |
| ∗log2FC in expression of this searched gene in stem-like cells from each diseased tissue sample relative to stem-like cells in normal samples in each tissue plotted against the malignancy continuum. Samples are colored based on if they are from different disease stage. |
Top |
Malignant transformation related pathway analysis |
| Find out the enriched GO biological processes and KEGG pathways involved in transition from healthy to precancer to cancer |
| Tissue | Disease Stage | Enriched GO biological Processes |
| Colorectum | AD |  |
| Colorectum | SER |  |
| Colorectum | MSS |  |
| Colorectum | MSI-H |  |
| Colorectum | FAP |  |
| ∗Top 15 enriched GO BP terms are showed in the bar plot of each disease state in each tissue. Each row represents a significant GO biological process which is colored according to the -log10(p.adjust). |
| Page: 1 2 3 4 5 6 7 8 9 |
| GO ID | Tissue | Disease Stage | Description | Gene Ratio | Bg Ratio | pvalue | p.adjust | Count |
| GO:000170118 | Esophagus | HGIN | in utero embryonic development | 77/2587 | 367/18723 | 9.56e-05 | 2.05e-03 | 77 |
| GO:00070593 | Esophagus | HGIN | chromosome segregation | 71/2587 | 346/18723 | 3.47e-04 | 5.62e-03 | 71 |
| GO:00018244 | Esophagus | HGIN | blastocyst development | 28/2587 | 106/18723 | 4.30e-04 | 6.47e-03 | 28 |
| GO:000705911 | Esophagus | ESCC | chromosome segregation | 238/8552 | 346/18723 | 1.72e-18 | 1.82e-16 | 238 |
| GO:000170119 | Esophagus | ESCC | in utero embryonic development | 243/8552 | 367/18723 | 1.00e-15 | 6.86e-14 | 243 |
| GO:00482853 | Esophagus | ESCC | organelle fission | 301/8552 | 488/18723 | 4.64e-13 | 2.12e-11 | 301 |
| GO:00988133 | Esophagus | ESCC | nuclear chromosome segregation | 187/8552 | 281/18723 | 1.00e-12 | 4.36e-11 | 187 |
| GO:00002802 | Esophagus | ESCC | nuclear division | 270/8552 | 439/18723 | 1.17e-11 | 4.24e-10 | 270 |
| GO:000182412 | Esophagus | ESCC | blastocyst development | 73/8552 | 106/18723 | 1.13e-06 | 1.40e-05 | 73 |
| GO:00018253 | Esophagus | ESCC | blastocyst formation | 29/8552 | 38/18723 | 1.18e-04 | 8.13e-04 | 29 |
| GO:00063101 | Esophagus | ESCC | DNA recombination | 168/8552 | 305/18723 | 5.58e-04 | 3.05e-03 | 168 |
| GO:00017015 | Liver | Cirrhotic | in utero embryonic development | 134/4634 | 367/18723 | 2.78e-07 | 6.86e-06 | 134 |
| GO:0001825 | Liver | Cirrhotic | blastocyst formation | 17/4634 | 38/18723 | 5.62e-03 | 2.84e-02 | 17 |
| GO:0007059 | Liver | HCC | chromosome segregation | 197/7958 | 346/18723 | 3.57e-08 | 7.87e-07 | 197 |
| GO:000170111 | Liver | HCC | in utero embryonic development | 204/7958 | 367/18723 | 2.44e-07 | 4.30e-06 | 204 |
| GO:0098813 | Liver | HCC | nuclear chromosome segregation | 157/7958 | 281/18723 | 3.82e-06 | 4.95e-05 | 157 |
| GO:0048285 | Liver | HCC | organelle fission | 254/7958 | 488/18723 | 1.07e-05 | 1.23e-04 | 254 |
| GO:00018251 | Liver | HCC | blastocyst formation | 27/7958 | 38/18723 | 3.47e-04 | 2.42e-03 | 27 |
| GO:0000280 | Liver | HCC | nuclear division | 220/7958 | 439/18723 | 6.90e-04 | 4.25e-03 | 220 |
| GO:00070592 | Oral cavity | OSCC | chromosome segregation | 206/7305 | 346/18723 | 5.82e-15 | 3.76e-13 | 206 |
| Page: 1 2 3 |
| Pathway ID | Tissue | Disease Stage | Description | Gene Ratio | Bg Ratio | pvalue | p.adjust | qvalue | Count |
| Page: 1 |
Top |
Cell-cell communication analysis |
| Identification of potential cell-cell interactions between two cell types and their ligand-receptor pairs for different disease states |
| Ligand | Receptor | LRpair | Pathway | Tissue | Disease Stage |
| Page: 1 |
Top |
Single-cell gene regulatory network inference analysis |
| Find out the significant the regulons (TFs) and the target genes of each regulon across cell types for different disease states |
| TF | Cell Type | Tissue | Disease Stage | Target Gene | RSS | Regulon Activity |
| ∗The dot plots of a searched regulon are shown for all cell subpopulations in each disease state of each tissue based on the regulon specific score inferred using pySCENIC and by calculating the average expression. |
| Page: 1 |
Top |
Somatic mutation of malignant transformation related genes |
| Annotation of somatic variants for genes involved in malignant transformation |
| Hugo Symbol | Variant Class | Variant Classification | dbSNP RS | HGVSc | HGVSp | HGVSp Short | SWISSPROT | BIOTYPE | SIFT | PolyPhen | Tumor Sample Barcode | Tissue | Histology | Sex | Age | Stage | Therapy Types | Drugs | Outcome |
| CCNB1IP1 | SNV | Missense_Mutation | novel | c.38N>A | p.Arg13Gln | p.R13Q | Q9NPC3 | protein_coding | tolerated(0.25) | possibly_damaging(0.569) | TCGA-AN-A046-01 | Breast | breast invasive carcinoma | Female | >=65 | I/II | Unknown | Unknown | SD |
| CCNB1IP1 | SNV | Missense_Mutation | c.393C>G | p.Ser131Arg | p.S131R | Q9NPC3 | protein_coding | tolerated(0.44) | benign(0.015) | TCGA-AR-A0TP-01 | Breast | breast invasive carcinoma | Female | <65 | I/II | Chemotherapy | doxorubicin | SD | |
| CCNB1IP1 | SNV | Missense_Mutation | c.416T>C | p.Met139Thr | p.M139T | Q9NPC3 | protein_coding | tolerated(0.13) | benign(0.35) | TCGA-BH-A18G-01 | Breast | breast invasive carcinoma | Female | >=65 | I/II | Unknown | Unknown | SD | |
| CCNB1IP1 | SNV | Missense_Mutation | novel | c.596N>C | p.Met199Thr | p.M199T | Q9NPC3 | protein_coding | tolerated_low_confidence(0.43) | benign(0.02) | TCGA-2W-A8YY-01 | Cervix | cervical & endocervical cancer | Female | <65 | I/II | Chemotherapy | cisplatin | CR |
| CCNB1IP1 | SNV | Missense_Mutation | novel | c.500G>A | p.Arg167His | p.R167H | Q9NPC3 | protein_coding | deleterious(0.01) | possibly_damaging(0.83) | TCGA-FU-A3HZ-01 | Cervix | cervical & endocervical cancer | Female | <65 | I/II | Chemotherapy | cisplatin | CR |
| CCNB1IP1 | SNV | Missense_Mutation | novel | c.430N>G | p.Thr144Ala | p.T144A | Q9NPC3 | protein_coding | tolerated(0.83) | benign(0) | TCGA-AA-3984-01 | Colorectum | colon adenocarcinoma | Female | <65 | I/II | Unknown | Unknown | SD |
| CCNB1IP1 | SNV | Missense_Mutation | novel | c.242N>A | p.Arg81Gln | p.R81Q | Q9NPC3 | protein_coding | tolerated(0.06) | benign(0.059) | TCGA-AA-3984-01 | Colorectum | colon adenocarcinoma | Female | <65 | I/II | Unknown | Unknown | SD |
| CCNB1IP1 | SNV | Missense_Mutation | novel | c.148N>A | p.Ala50Thr | p.A50T | Q9NPC3 | protein_coding | deleterious(0.01) | probably_damaging(0.989) | TCGA-AA-A01K-01 | Colorectum | colon adenocarcinoma | Female | >=65 | III/IV | Chemotherapy | folinic | CR |
| CCNB1IP1 | SNV | Missense_Mutation | c.47G>A | p.Arg16His | p.R16H | Q9NPC3 | protein_coding | deleterious(0) | probably_damaging(0.992) | TCGA-AZ-4313-01 | Colorectum | colon adenocarcinoma | Female | <65 | I/II | Unknown | Unknown | SD | |
| CCNB1IP1 | SNV | Missense_Mutation | c.827N>T | p.Arg276Ile | p.R276I | Q9NPC3 | protein_coding | deleterious_low_confidence(0) | benign(0.135) | TCGA-CA-6718-01 | Colorectum | colon adenocarcinoma | Male | <65 | I/II | Unknown | Unknown | PD |
| Page: 1 2 3 4 5 |
Top |
Related drugs of malignant transformation related genes |
| Identification of chemicals and drugs interact with genes involved in malignant transfromation |
| (DGIdb 4.0) |
| Entrez ID | Symbol | Category | Interaction Types | Drug Claim Name | Drug Name | PMIDs |
| Page: 1 |

Copyright 2023-Present -The University of Texas Health Science Center at Houston |