
|
|||||
|
 | |
| |
| |
| |
| |
| |
|
Gene: CCNA2 |
Gene summary for CCNA2 |
| Gene information | Species | Human | Gene symbol | CCNA2 | Gene ID | 890 |
| Gene name | cyclin A2 | |
| Gene Alias | CCN1 | |
| Cytomap | 4q27 | |
| Gene Type | protein-coding | GO ID | GO:0000079 | UniProtAcc | P20248 |
Top |
Malignant transformation analysis |
| Identification of the aberrant gene expression in precancerous and cancerous lesions by comparing the gene expression of stem-like cells in diseased tissues with normal stem cells |
| Entrez ID | Symbol | Replicates | Species | Organ | Tissue | Adj P-value | Log2FC | Malignancy |
| 890 | CCNA2 | LZE2T | Human | Esophagus | ESCC | 9.54e-06 | 6.08e-01 | 0.082 |
| 890 | CCNA2 | P2T-E | Human | Esophagus | ESCC | 2.06e-08 | 6.26e-01 | 0.1177 |
| 890 | CCNA2 | P4T-E | Human | Esophagus | ESCC | 4.27e-09 | 5.18e-01 | 0.1323 |
| 890 | CCNA2 | P5T-E | Human | Esophagus | ESCC | 4.30e-10 | 3.11e-01 | 0.1327 |
| 890 | CCNA2 | P9T-E | Human | Esophagus | ESCC | 8.38e-03 | 1.56e-01 | 0.1131 |
| 890 | CCNA2 | P10T-E | Human | Esophagus | ESCC | 1.78e-03 | 1.78e-01 | 0.116 |
| 890 | CCNA2 | P15T-E | Human | Esophagus | ESCC | 1.31e-02 | 1.92e-01 | 0.1149 |
| 890 | CCNA2 | P16T-E | Human | Esophagus | ESCC | 8.40e-04 | 1.52e-01 | 0.1153 |
| 890 | CCNA2 | P17T-E | Human | Esophagus | ESCC | 1.29e-08 | 5.60e-01 | 0.1278 |
| 890 | CCNA2 | P19T-E | Human | Esophagus | ESCC | 5.57e-05 | 5.72e-01 | 0.1662 |
| 890 | CCNA2 | P21T-E | Human | Esophagus | ESCC | 2.06e-08 | 4.05e-01 | 0.1617 |
| 890 | CCNA2 | P22T-E | Human | Esophagus | ESCC | 3.97e-04 | 3.75e-01 | 0.1236 |
| 890 | CCNA2 | P24T-E | Human | Esophagus | ESCC | 6.56e-15 | 6.21e-01 | 0.1287 |
| 890 | CCNA2 | P26T-E | Human | Esophagus | ESCC | 1.88e-04 | 2.56e-01 | 0.1276 |
| 890 | CCNA2 | P28T-E | Human | Esophagus | ESCC | 9.44e-07 | 2.53e-01 | 0.1149 |
| 890 | CCNA2 | P31T-E | Human | Esophagus | ESCC | 2.03e-09 | 4.15e-01 | 0.1251 |
| 890 | CCNA2 | P32T-E | Human | Esophagus | ESCC | 2.93e-15 | 7.46e-01 | 0.1666 |
| 890 | CCNA2 | P36T-E | Human | Esophagus | ESCC | 1.12e-05 | 5.51e-01 | 0.1187 |
| 890 | CCNA2 | P37T-E | Human | Esophagus | ESCC | 7.83e-07 | 2.70e-01 | 0.1371 |
| 890 | CCNA2 | P38T-E | Human | Esophagus | ESCC | 2.41e-07 | 6.46e-01 | 0.127 |
| Page: 1 2 3 |
| Tissue | Expression Dynamics | Abbreviation |
| Esophagus | 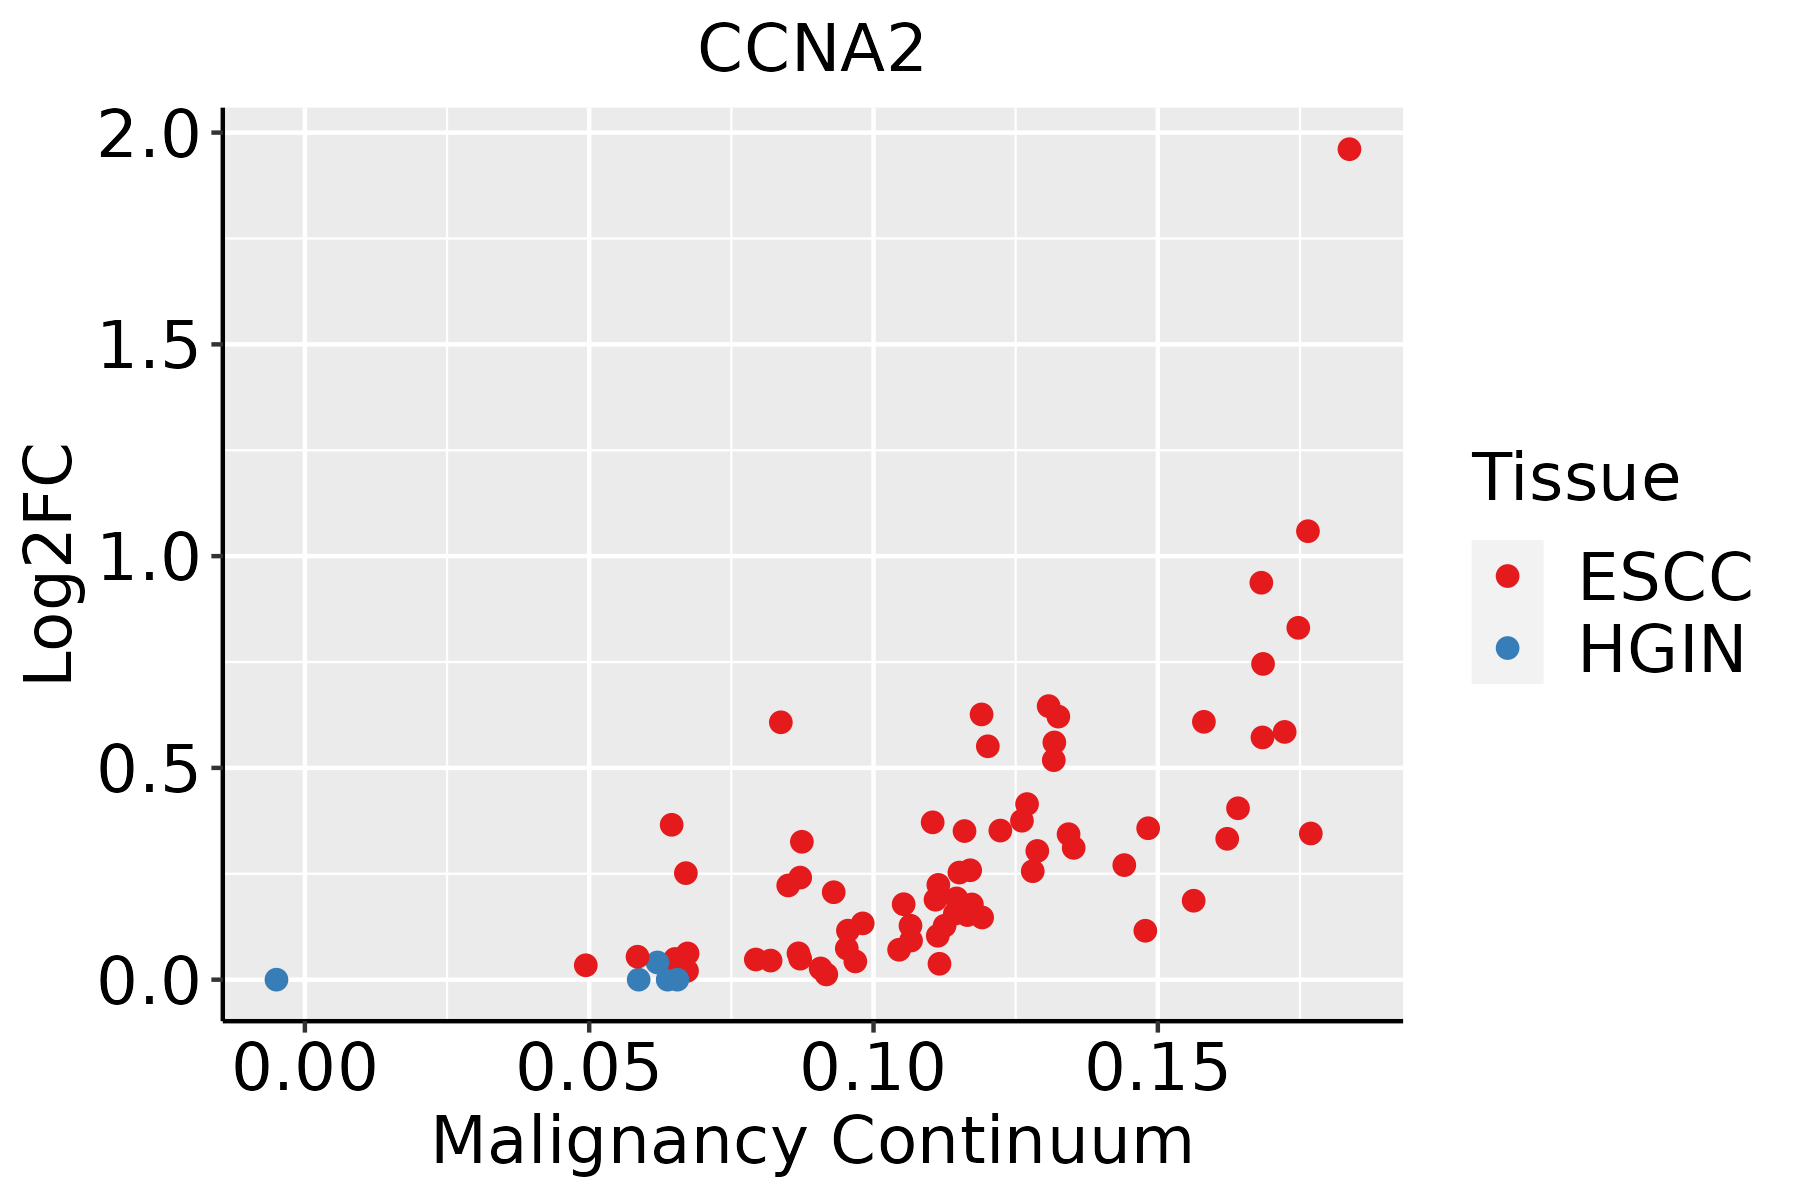 | ESCC: Esophageal squamous cell carcinoma |
| HGIN: High-grade intraepithelial neoplasias | ||
| LGIN: Low-grade intraepithelial neoplasias | ||
| Oral Cavity |  | EOLP: Erosive Oral lichen planus |
| LP: leukoplakia | ||
| NEOLP: Non-erosive oral lichen planus | ||
| OSCC: Oral squamous cell carcinoma | ||
| Skin | 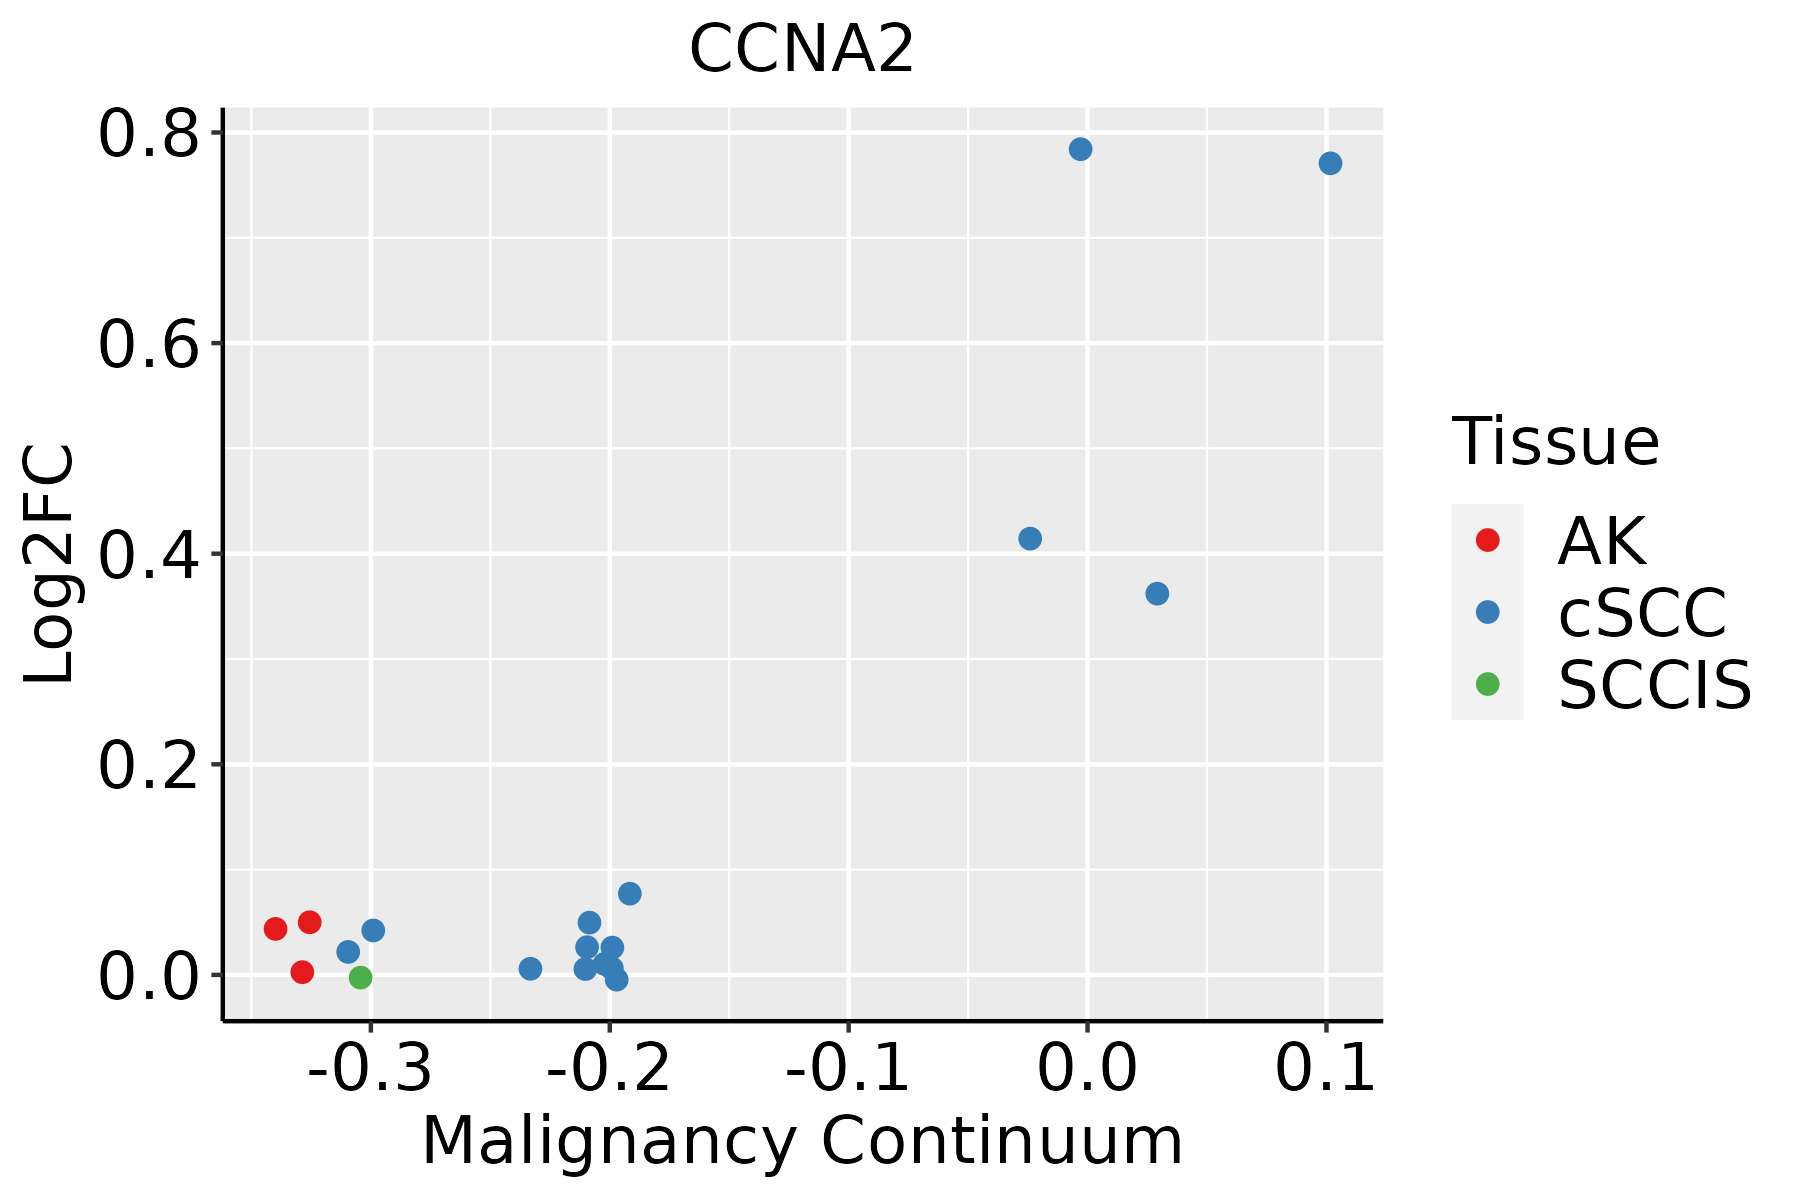 | AK: Actinic keratosis |
| cSCC: Cutaneous squamous cell carcinoma | ||
| SCCIS:squamous cell carcinoma in situ | ||
| Thyroid | 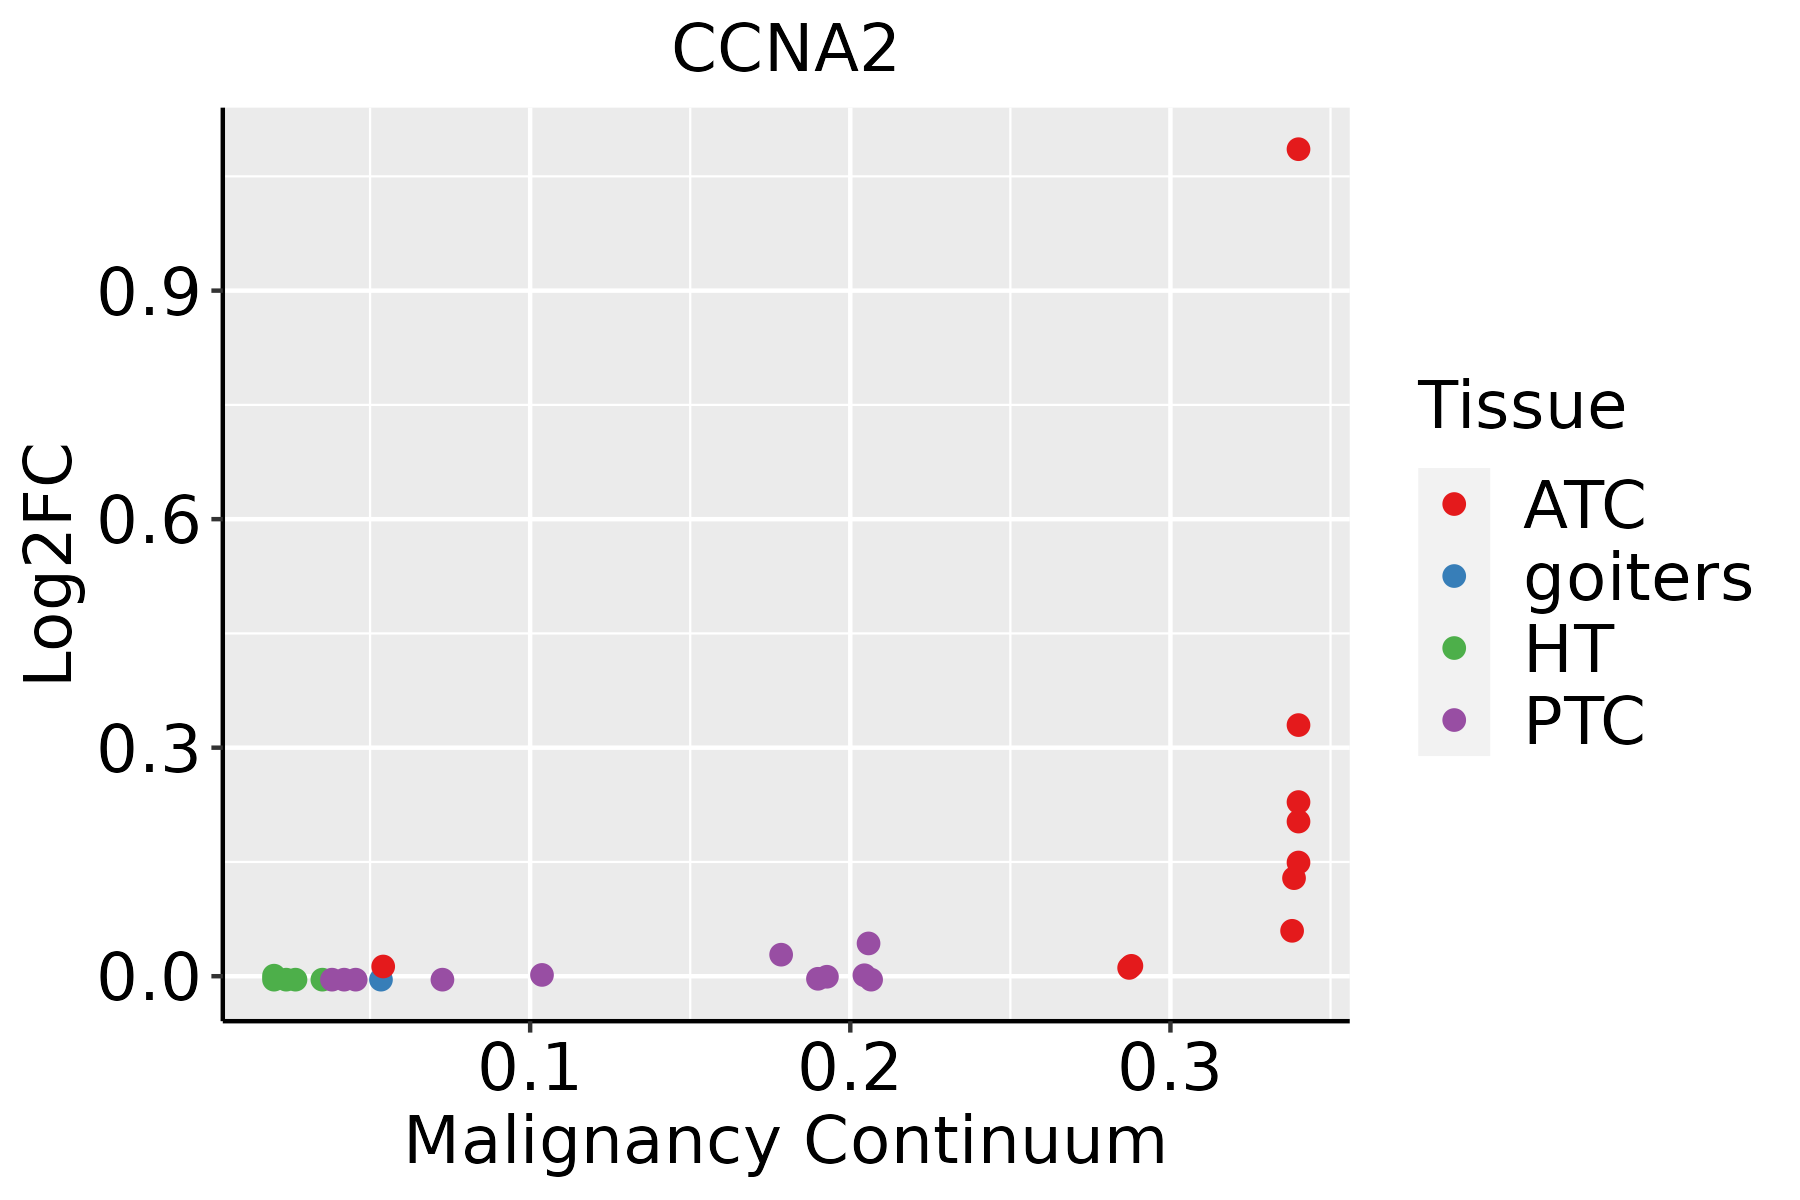 | ATC: Anaplastic thyroid cancer |
| HT: Hashimoto's thyroiditis | ||
| PTC: Papillary thyroid cancer |
| ∗log2FC in expression of this searched gene in stem-like cells from each diseased tissue sample relative to stem-like cells in normal samples in each tissue plotted against the malignancy continuum. Samples are colored based on if they are from different disease stage. |
Top |
Malignant transformation related pathway analysis |
| Find out the enriched GO biological processes and KEGG pathways involved in transition from healthy to precancer to cancer |
| Tissue | Disease Stage | Enriched GO biological Processes |
| Colorectum | AD |  |
| Colorectum | SER |  |
| Colorectum | MSS |  |
| Colorectum | MSI-H |  |
| Colorectum | FAP |  |
| ∗Top 15 enriched GO BP terms are showed in the bar plot of each disease state in each tissue. Each row represents a significant GO biological process which is colored according to the -log10(p.adjust). |
| Page: 1 2 3 4 5 6 7 8 9 |
| GO ID | Tissue | Disease Stage | Description | Gene Ratio | Bg Ratio | pvalue | p.adjust | Count |
| GO:001657015 | Esophagus | ESCC | histone modification | 323/8552 | 463/18723 | 2.61e-26 | 7.88e-24 | 323 |
| GO:004477216 | Esophagus | ESCC | mitotic cell cycle phase transition | 281/8552 | 424/18723 | 4.63e-18 | 4.45e-16 | 281 |
| GO:00062604 | Esophagus | ESCC | DNA replication | 181/8552 | 260/18723 | 3.55e-15 | 2.05e-13 | 181 |
| GO:007190016 | Esophagus | ESCC | regulation of protein serine/threonine kinase activity | 227/8552 | 359/18723 | 1.12e-11 | 4.10e-10 | 227 |
| GO:0070482111 | Esophagus | ESCC | response to oxygen levels | 218/8552 | 347/18723 | 6.91e-11 | 2.17e-09 | 218 |
| GO:0036293111 | Esophagus | ESCC | response to decreased oxygen levels | 201/8552 | 322/18723 | 8.37e-10 | 2.04e-08 | 201 |
| GO:0001666111 | Esophagus | ESCC | response to hypoxia | 192/8552 | 307/18723 | 1.59e-09 | 3.69e-08 | 192 |
| GO:00448394 | Esophagus | ESCC | cell cycle G2/M phase transition | 103/8552 | 148/18723 | 3.09e-09 | 6.67e-08 | 103 |
| GO:00000864 | Esophagus | ESCC | G2/M transition of mitotic cell cycle | 96/8552 | 137/18723 | 6.00e-09 | 1.23e-07 | 96 |
| GO:000726510 | Esophagus | ESCC | Ras protein signal transduction | 201/8552 | 337/18723 | 1.44e-07 | 2.30e-06 | 201 |
| GO:0071453110 | Esophagus | ESCC | cellular response to oxygen levels | 114/8552 | 177/18723 | 3.63e-07 | 5.06e-06 | 114 |
| GO:0036294110 | Esophagus | ESCC | cellular response to decreased oxygen levels | 105/8552 | 161/18723 | 4.20e-07 | 5.73e-06 | 105 |
| GO:004484314 | Esophagus | ESCC | cell cycle G1/S phase transition | 148/8552 | 241/18723 | 5.68e-07 | 7.48e-06 | 148 |
| GO:19040294 | Esophagus | ESCC | regulation of cyclin-dependent protein kinase activity | 69/8552 | 98/18723 | 6.04e-07 | 7.91e-06 | 69 |
| GO:00000794 | Esophagus | ESCC | regulation of cyclin-dependent protein serine/threonine kinase activity | 66/8552 | 94/18723 | 1.24e-06 | 1.53e-05 | 66 |
| GO:190165319 | Esophagus | ESCC | cellular response to peptide | 208/8552 | 359/18723 | 1.68e-06 | 2.01e-05 | 208 |
| GO:00062754 | Esophagus | ESCC | regulation of DNA replication | 73/8552 | 107/18723 | 1.97e-06 | 2.28e-05 | 73 |
| GO:007145616 | Esophagus | ESCC | cellular response to hypoxia | 97/8552 | 151/18723 | 3.12e-06 | 3.51e-05 | 97 |
| GO:003109910 | Esophagus | ESCC | regeneration | 122/8552 | 198/18723 | 4.26e-06 | 4.57e-05 | 122 |
| GO:0043434111 | Esophagus | ESCC | response to peptide hormone | 234/8552 | 414/18723 | 4.93e-06 | 5.21e-05 | 234 |
| Page: 1 2 3 4 5 6 |
| Pathway ID | Tissue | Disease Stage | Description | Gene Ratio | Bg Ratio | pvalue | p.adjust | qvalue | Count |
| hsa0411023 | Esophagus | ESCC | Cell cycle | 126/4205 | 157/8465 | 1.34e-15 | 5.60e-14 | 2.87e-14 | 126 |
| hsa05166211 | Esophagus | ESCC | Human T-cell leukemia virus 1 infection | 164/4205 | 222/8465 | 8.13e-14 | 2.09e-12 | 1.07e-12 | 164 |
| hsa05169210 | Esophagus | ESCC | Epstein-Barr virus infection | 151/4205 | 202/8465 | 1.55e-13 | 3.45e-12 | 1.77e-12 | 151 |
| hsa0421829 | Esophagus | ESCC | Cellular senescence | 119/4205 | 156/8465 | 5.89e-12 | 9.40e-11 | 4.81e-11 | 119 |
| hsa0516510 | Esophagus | ESCC | Human papillomavirus infection | 215/4205 | 331/8465 | 7.86e-09 | 7.12e-08 | 3.65e-08 | 215 |
| hsa0520325 | Esophagus | ESCC | Viral carcinogenesis | 137/4205 | 204/8465 | 2.47e-07 | 1.88e-06 | 9.62e-07 | 137 |
| hsa051619 | Esophagus | ESCC | Hepatitis B | 108/4205 | 162/8465 | 7.68e-06 | 4.15e-05 | 2.12e-05 | 108 |
| hsa052215 | Esophagus | ESCC | Acute myeloid leukemia | 49/4205 | 67/8465 | 7.43e-05 | 3.07e-04 | 1.57e-04 | 49 |
| hsa0415210 | Esophagus | ESCC | AMPK signaling pathway | 80/4205 | 121/8465 | 1.73e-04 | 6.67e-04 | 3.42e-04 | 80 |
| hsa052028 | Esophagus | ESCC | Transcriptional misregulation in cancer | 116/4205 | 193/8465 | 2.08e-03 | 5.95e-03 | 3.05e-03 | 116 |
| hsa0411033 | Esophagus | ESCC | Cell cycle | 126/4205 | 157/8465 | 1.34e-15 | 5.60e-14 | 2.87e-14 | 126 |
| hsa05166310 | Esophagus | ESCC | Human T-cell leukemia virus 1 infection | 164/4205 | 222/8465 | 8.13e-14 | 2.09e-12 | 1.07e-12 | 164 |
| hsa0516937 | Esophagus | ESCC | Epstein-Barr virus infection | 151/4205 | 202/8465 | 1.55e-13 | 3.45e-12 | 1.77e-12 | 151 |
| hsa0421838 | Esophagus | ESCC | Cellular senescence | 119/4205 | 156/8465 | 5.89e-12 | 9.40e-11 | 4.81e-11 | 119 |
| hsa0516515 | Esophagus | ESCC | Human papillomavirus infection | 215/4205 | 331/8465 | 7.86e-09 | 7.12e-08 | 3.65e-08 | 215 |
| hsa0520335 | Esophagus | ESCC | Viral carcinogenesis | 137/4205 | 204/8465 | 2.47e-07 | 1.88e-06 | 9.62e-07 | 137 |
| hsa0516114 | Esophagus | ESCC | Hepatitis B | 108/4205 | 162/8465 | 7.68e-06 | 4.15e-05 | 2.12e-05 | 108 |
| hsa0522113 | Esophagus | ESCC | Acute myeloid leukemia | 49/4205 | 67/8465 | 7.43e-05 | 3.07e-04 | 1.57e-04 | 49 |
| hsa0415213 | Esophagus | ESCC | AMPK signaling pathway | 80/4205 | 121/8465 | 1.73e-04 | 6.67e-04 | 3.42e-04 | 80 |
| hsa0520213 | Esophagus | ESCC | Transcriptional misregulation in cancer | 116/4205 | 193/8465 | 2.08e-03 | 5.95e-03 | 3.05e-03 | 116 |
| Page: 1 2 |
Top |
Cell-cell communication analysis |
| Identification of potential cell-cell interactions between two cell types and their ligand-receptor pairs for different disease states |
| Ligand | Receptor | LRpair | Pathway | Tissue | Disease Stage |
| Page: 1 |
Top |
Single-cell gene regulatory network inference analysis |
| Find out the significant the regulons (TFs) and the target genes of each regulon across cell types for different disease states |
| TF | Cell Type | Tissue | Disease Stage | Target Gene | RSS | Regulon Activity |
| ∗The dot plots of a searched regulon are shown for all cell subpopulations in each disease state of each tissue based on the regulon specific score inferred using pySCENIC and by calculating the average expression. |
| Page: 1 |
Top |
Somatic mutation of malignant transformation related genes |
| Annotation of somatic variants for genes involved in malignant transformation |
| Hugo Symbol | Variant Class | Variant Classification | dbSNP RS | HGVSc | HGVSp | HGVSp Short | SWISSPROT | BIOTYPE | SIFT | PolyPhen | Tumor Sample Barcode | Tissue | Histology | Sex | Age | Stage | Therapy Types | Drugs | Outcome |
| CCNA2 | SNV | Missense_Mutation | rs750866939 | c.364C>T | p.Arg122Cys | p.R122C | P20248 | protein_coding | tolerated(0.18) | benign(0) | TCGA-A2-A0YH-01 | Breast | breast invasive carcinoma | Female | <65 | III/IV | Chemotherapy | adriamycin | SD |
| CCNA2 | SNV | Missense_Mutation | c.944N>C | p.Leu315Pro | p.L315P | P20248 | protein_coding | deleterious(0) | probably_damaging(0.992) | TCGA-A8-A07B-01 | Breast | breast invasive carcinoma | Female | >=65 | I/II | Unknown | Unknown | SD | |
| CCNA2 | SNV | Missense_Mutation | novel | c.567G>T | p.Met189Ile | p.M189I | P20248 | protein_coding | tolerated(0.34) | benign(0.18) | TCGA-AN-A046-01 | Breast | breast invasive carcinoma | Female | >=65 | I/II | Unknown | Unknown | SD |
| CCNA2 | SNV | Missense_Mutation | c.37N>A | p.Glu13Lys | p.E13K | P20248 | protein_coding | tolerated_low_confidence(0.05) | benign(0.043) | TCGA-BH-A0B6-01 | Breast | breast invasive carcinoma | Female | <65 | I/II | Unknown | Unknown | SD | |
| CCNA2 | SNV | Missense_Mutation | c.253N>T | p.Val85Phe | p.V85F | P20248 | protein_coding | tolerated(0.75) | benign(0.031) | TCGA-BH-A204-01 | Breast | breast invasive carcinoma | Female | >=65 | I/II | Unknown | Unknown | SD | |
| CCNA2 | SNV | Missense_Mutation | novel | c.850G>T | p.Asp284Tyr | p.D284Y | P20248 | protein_coding | deleterious(0.01) | possibly_damaging(0.681) | TCGA-2W-A8YY-01 | Cervix | cervical & endocervical cancer | Female | <65 | I/II | Chemotherapy | cisplatin | CR |
| CCNA2 | SNV | Missense_Mutation | c.1242N>C | p.Lys414Asn | p.K414N | P20248 | protein_coding | deleterious(0) | possibly_damaging(0.566) | TCGA-FU-A3HZ-01 | Cervix | cervical & endocervical cancer | Female | <65 | I/II | Chemotherapy | cisplatin | CR | |
| CCNA2 | SNV | Missense_Mutation | c.1247N>T | p.Ser416Leu | p.S416L | P20248 | protein_coding | deleterious(0.01) | benign(0.405) | TCGA-IR-A3LI-01 | Cervix | cervical & endocervical cancer | Female | <65 | I/II | Chemotherapy | cisplatin | CR | |
| CCNA2 | SNV | Missense_Mutation | c.620N>G | p.Thr207Ser | p.T207S | P20248 | protein_coding | deleterious(0.02) | benign(0.231) | TCGA-AA-A01T-01 | Colorectum | colon adenocarcinoma | Female | <65 | III/IV | Chemotherapy | 5-fluorouracil | CR | |
| CCNA2 | SNV | Missense_Mutation | c.926N>G | p.Pro309Arg | p.P309R | P20248 | protein_coding | deleterious(0) | probably_damaging(0.999) | TCGA-AA-A01V-01 | Colorectum | colon adenocarcinoma | Male | <65 | I/II | Unknown | Unknown | SD |
| Page: 1 2 3 4 |
Top |
Related drugs of malignant transformation related genes |
| Identification of chemicals and drugs interact with genes involved in malignant transfromation |
| (DGIdb 4.0) |
| Entrez ID | Symbol | Category | Interaction Types | Drug Claim Name | Drug Name | PMIDs |
| 890 | CCNA2 | DRUGGABLE GENOME, KINASE | ETHINYL ESTRADIOL | 9806355 | ||
| 890 | CCNA2 | DRUGGABLE GENOME, KINASE | tamoxifen | TAMOXIFEN | 24622579 | |
| 890 | CCNA2 | DRUGGABLE GENOME, KINASE | SURAMIN | SURAMIN | 10208280 | |
| 890 | CCNA2 | DRUGGABLE GENOME, KINASE | TNF-ALPHA | 15965500 | ||
| 890 | CCNA2 | DRUGGABLE GENOME, KINASE | 3-DEOXYADENOSINE | 11566717 | ||
| 890 | CCNA2 | DRUGGABLE GENOME, KINASE | SELICICLIB | SELICICLIB | 21080703 | |
| 890 | CCNA2 | DRUGGABLE GENOME, KINASE | GENISTEIN | GENISTEIN | 9664138 |
| Page: 1 |

Copyright 2023-Present -The University of Texas Health Science Center at Houston |