
|
|||||
|
 | |
| |
| |
| |
| |
| |
|
Gene: CCN2 |
Gene summary for CCN2 |
| Gene information | Species | Human | Gene symbol | CCN2 | Gene ID | 1490 |
| Gene name | cellular communication network factor 2 | |
| Gene Alias | CTGF | |
| Cytomap | 6q23.2 | |
| Gene Type | protein-coding | GO ID | GO:0000165 | UniProtAcc | P29279 |
Top |
Malignant transformation analysis |
| Identification of the aberrant gene expression in precancerous and cancerous lesions by comparing the gene expression of stem-like cells in diseased tissues with normal stem cells |
| Entrez ID | Symbol | Replicates | Species | Organ | Tissue | Adj P-value | Log2FC | Malignancy |
| 1490 | CCN2 | AEH-subject1 | Human | Endometrium | AEH | 5.07e-16 | 3.99e-01 | -0.3059 |
| 1490 | CCN2 | AEH-subject2 | Human | Endometrium | AEH | 4.27e-13 | 3.80e-01 | -0.2525 |
| 1490 | CCN2 | AEH-subject3 | Human | Endometrium | AEH | 6.48e-14 | 3.45e-01 | -0.2576 |
| 1490 | CCN2 | AEH-subject4 | Human | Endometrium | AEH | 3.00e-20 | 5.35e-01 | -0.2657 |
| 1490 | CCN2 | AEH-subject5 | Human | Endometrium | AEH | 1.66e-03 | 1.43e-01 | -0.2953 |
| 1490 | CCN2 | EEC-subject1 | Human | Endometrium | EEC | 3.89e-10 | 3.15e-01 | -0.2682 |
| 1490 | CCN2 | EEC-subject2 | Human | Endometrium | EEC | 6.95e-19 | 4.42e-01 | -0.2607 |
| 1490 | CCN2 | EEC-subject4 | Human | Endometrium | EEC | 8.38e-18 | 4.17e-01 | -0.2571 |
| 1490 | CCN2 | EEC-subject5 | Human | Endometrium | EEC | 1.69e-11 | 3.38e-01 | -0.249 |
| 1490 | CCN2 | male-WTA | Human | Thyroid | PTC | 6.99e-29 | 4.97e-01 | 0.1037 |
| 1490 | CCN2 | female-WTA | Human | Thyroid | PTC | 1.96e-09 | 5.61e-01 | 0.0726 |
| 1490 | CCN2 | nodule-WTA | Human | Thyroid | goiters | 9.92e-28 | 8.64e-01 | 0.0534 |
| Page: 1 |
| Tissue | Expression Dynamics | Abbreviation |
| Endometrium | 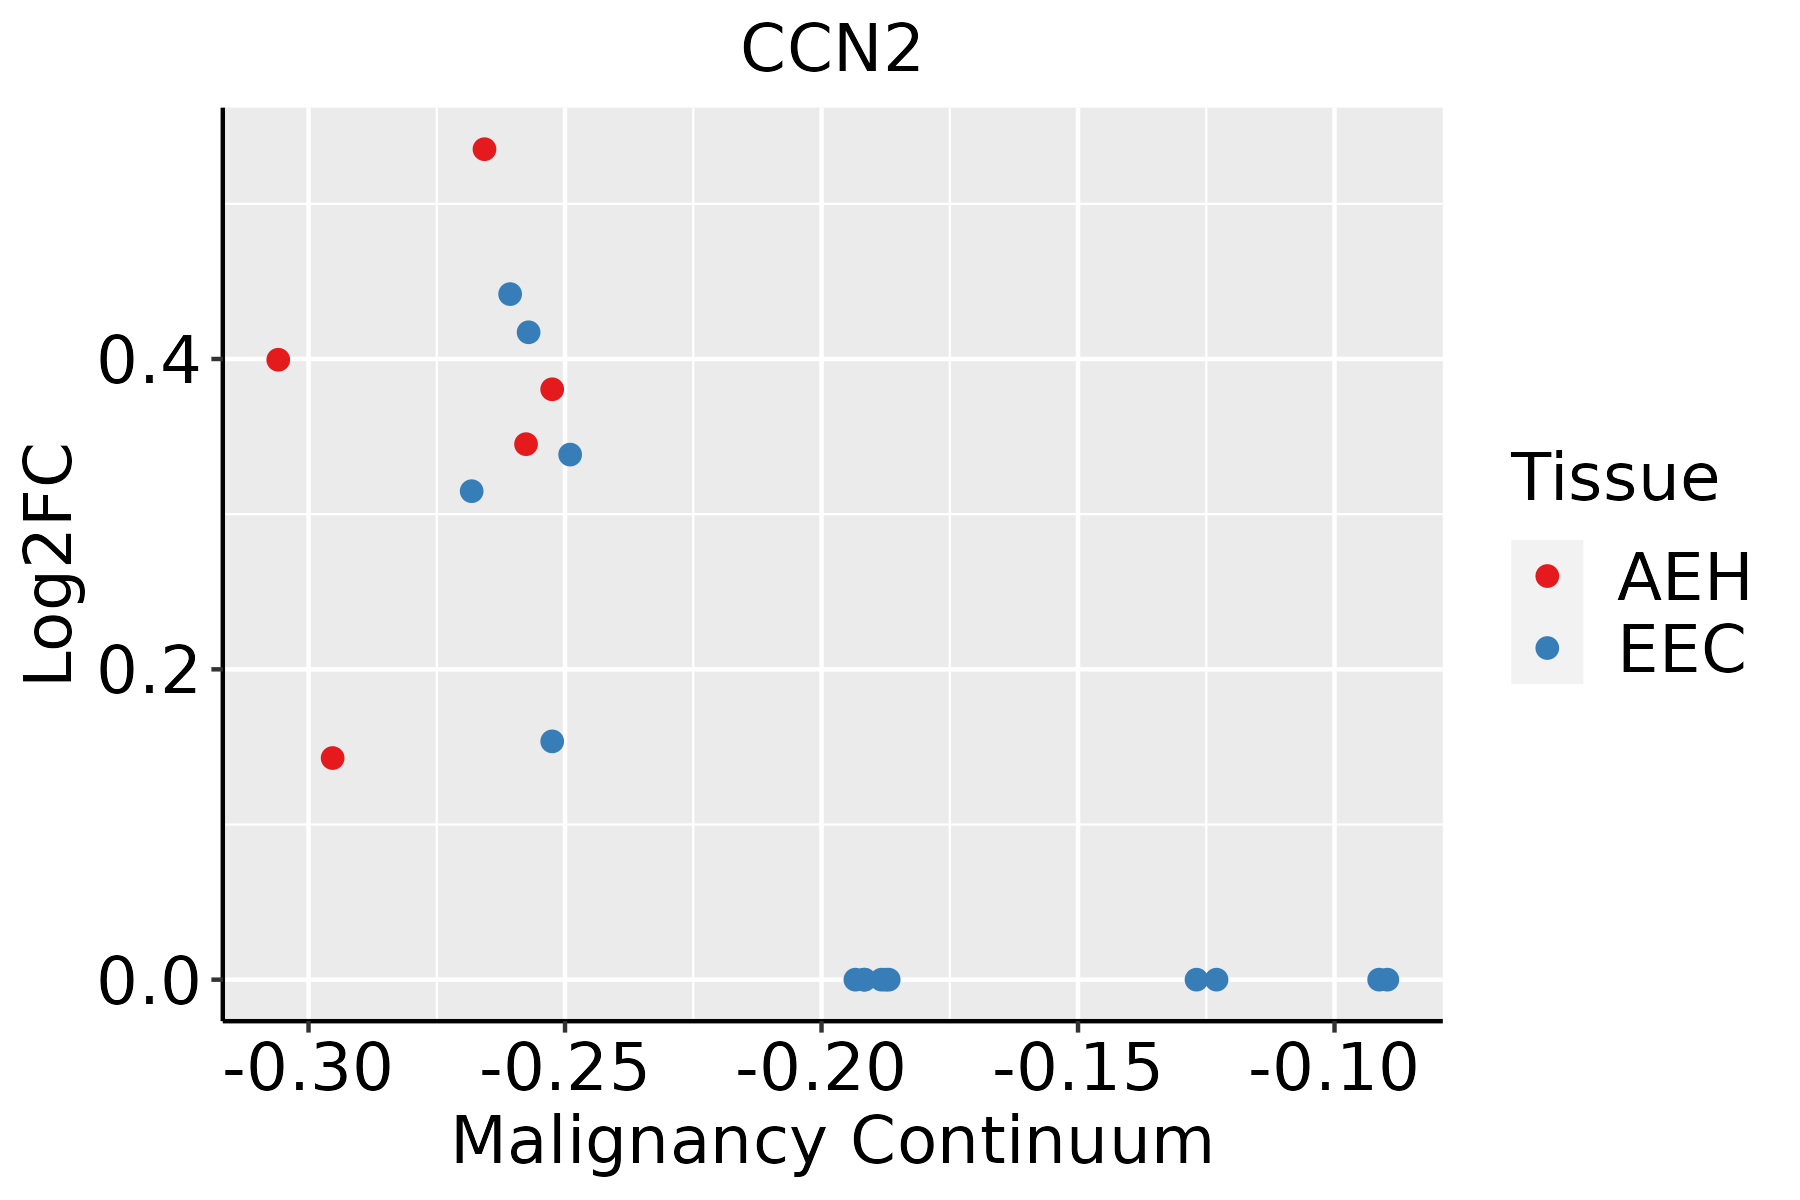 | AEH: Atypical endometrial hyperplasia |
| EEC: Endometrioid Cancer | ||
| Thyroid | 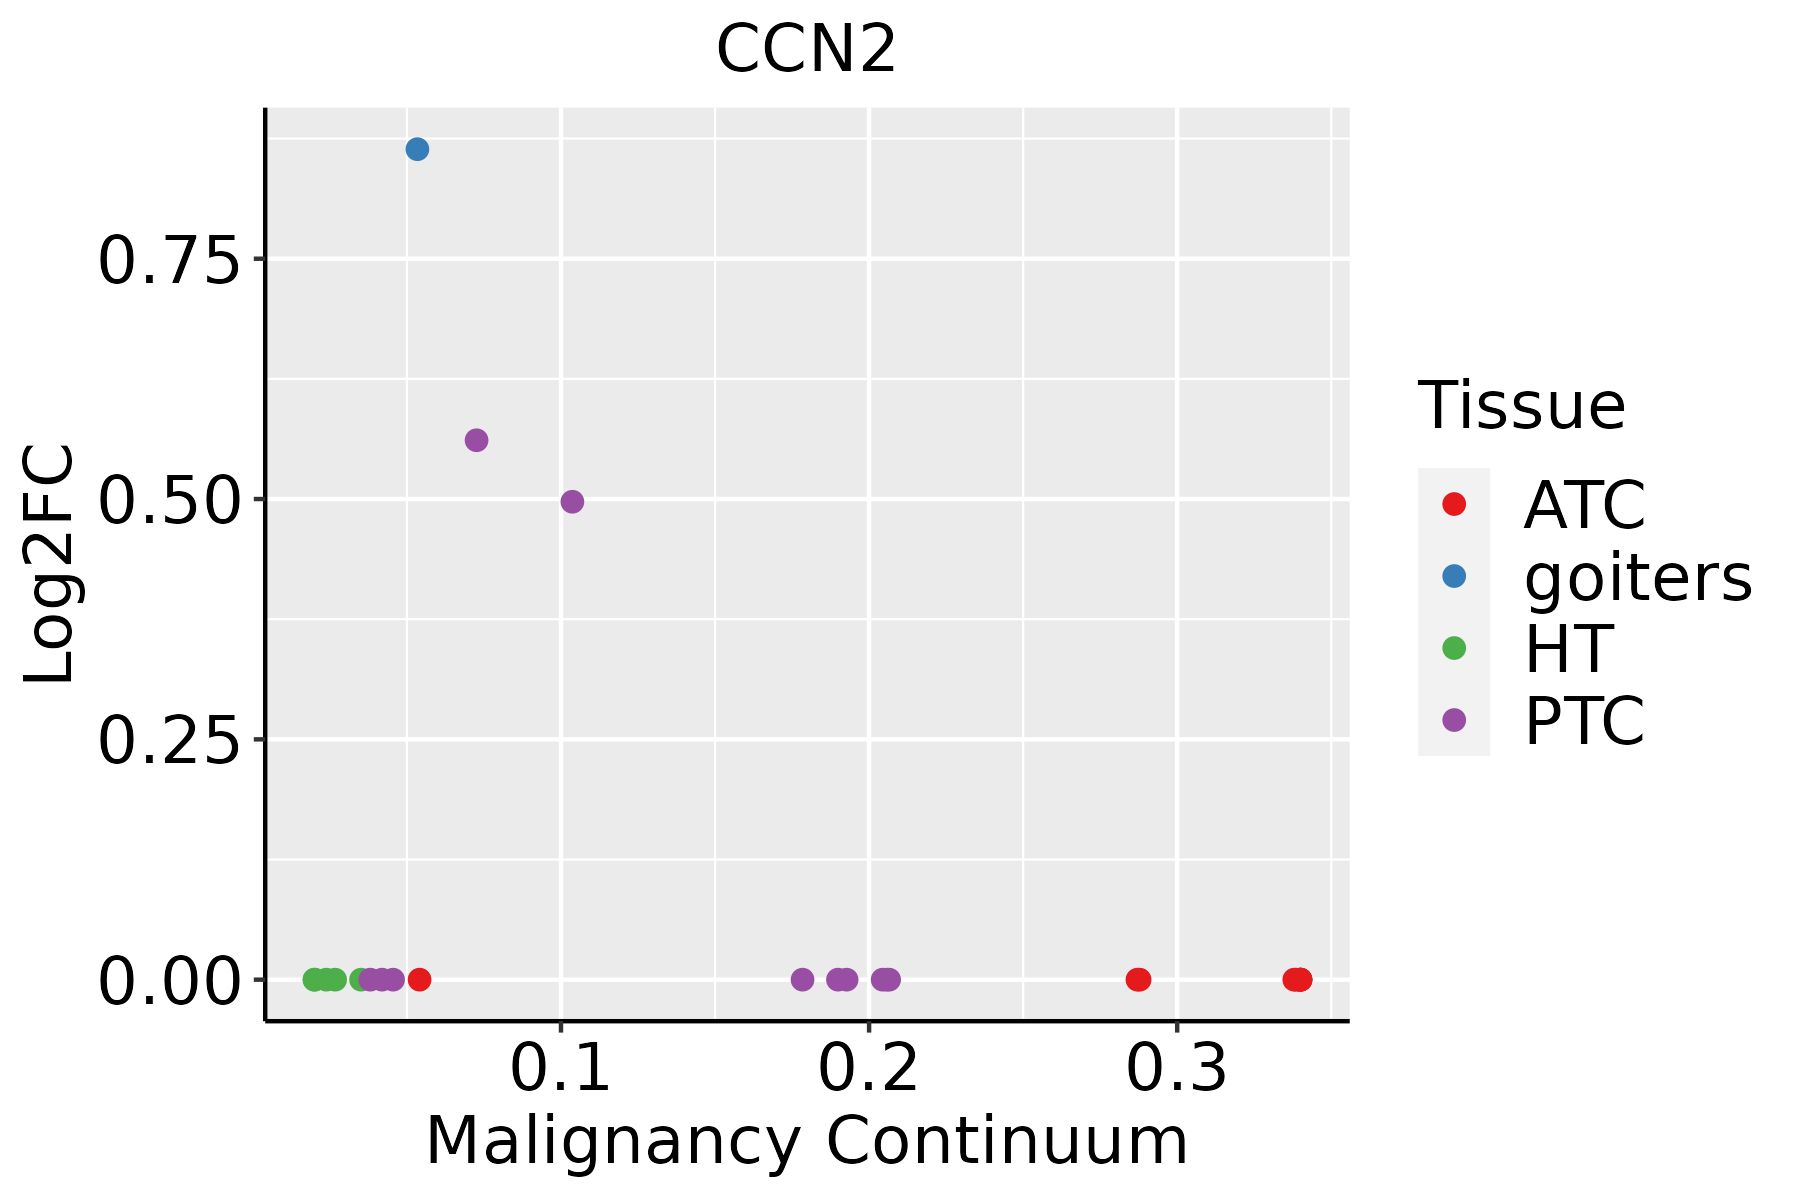 | ATC: Anaplastic thyroid cancer |
| HT: Hashimoto's thyroiditis | ||
| PTC: Papillary thyroid cancer |
| ∗log2FC in expression of this searched gene in stem-like cells from each diseased tissue sample relative to stem-like cells in normal samples in each tissue plotted against the malignancy continuum. Samples are colored based on if they are from different disease stage. |
Top |
Malignant transformation related pathway analysis |
| Find out the enriched GO biological processes and KEGG pathways involved in transition from healthy to precancer to cancer |
| Tissue | Disease Stage | Enriched GO biological Processes |
| Colorectum | AD |  |
| Colorectum | SER |  |
| Colorectum | MSS |  |
| Colorectum | MSI-H |  |
| Colorectum | FAP |  |
| ∗Top 15 enriched GO BP terms are showed in the bar plot of each disease state in each tissue. Each row represents a significant GO biological process which is colored according to the -log10(p.adjust). |
| Page: 1 2 3 4 5 6 7 8 9 |
| GO ID | Tissue | Disease Stage | Description | Gene Ratio | Bg Ratio | pvalue | p.adjust | Count |
| GO:00315899 | Endometrium | AEH | cell-substrate adhesion | 87/2100 | 363/18723 | 3.51e-12 | 5.70e-10 | 87 |
| GO:000701516 | Endometrium | AEH | actin filament organization | 98/2100 | 442/18723 | 1.99e-11 | 2.98e-09 | 98 |
| GO:003297016 | Endometrium | AEH | regulation of actin filament-based process | 89/2100 | 397/18723 | 9.14e-11 | 1.10e-08 | 89 |
| GO:000974316 | Endometrium | AEH | response to carbohydrate | 62/2100 | 253/18723 | 1.76e-09 | 1.51e-07 | 62 |
| GO:003428416 | Endometrium | AEH | response to monosaccharide | 57/2100 | 225/18723 | 2.13e-09 | 1.77e-07 | 57 |
| GO:004854516 | Endometrium | AEH | response to steroid hormone | 76/2100 | 339/18723 | 2.15e-09 | 1.77e-07 | 76 |
| GO:190290316 | Endometrium | AEH | regulation of supramolecular fiber organization | 83/2100 | 383/18723 | 2.20e-09 | 1.78e-07 | 83 |
| GO:004586216 | Endometrium | AEH | positive regulation of proteolysis | 81/2100 | 372/18723 | 2.72e-09 | 2.06e-07 | 81 |
| GO:003295616 | Endometrium | AEH | regulation of actin cytoskeleton organization | 77/2100 | 358/18723 | 1.18e-08 | 7.76e-07 | 77 |
| GO:000974615 | Endometrium | AEH | response to hexose | 54/2100 | 219/18723 | 1.54e-08 | 9.72e-07 | 54 |
| GO:000974910 | Endometrium | AEH | response to glucose | 52/2100 | 212/18723 | 3.40e-08 | 1.91e-06 | 52 |
| GO:00072296 | Endometrium | AEH | integrin-mediated signaling pathway | 32/2100 | 107/18723 | 1.24e-07 | 5.80e-06 | 32 |
| GO:00071609 | Endometrium | AEH | cell-matrix adhesion | 54/2100 | 233/18723 | 1.42e-07 | 6.37e-06 | 54 |
| GO:011005316 | Endometrium | AEH | regulation of actin filament organization | 61/2100 | 278/18723 | 1.83e-07 | 8.11e-06 | 61 |
| GO:003103210 | Endometrium | AEH | actomyosin structure organization | 46/2100 | 196/18723 | 8.00e-07 | 2.91e-05 | 46 |
| GO:190290516 | Endometrium | AEH | positive regulation of supramolecular fiber organization | 48/2100 | 209/18723 | 9.11e-07 | 3.20e-05 | 48 |
| GO:005101716 | Endometrium | AEH | actin filament bundle assembly | 39/2100 | 157/18723 | 1.21e-06 | 3.91e-05 | 39 |
| GO:00015038 | Endometrium | AEH | ossification | 78/2100 | 408/18723 | 1.54e-06 | 4.85e-05 | 78 |
| GO:006157216 | Endometrium | AEH | actin filament bundle organization | 39/2100 | 161/18723 | 2.36e-06 | 6.86e-05 | 39 |
| GO:005254716 | Endometrium | AEH | regulation of peptidase activity | 85/2100 | 461/18723 | 2.47e-06 | 7.11e-05 | 85 |
| Page: 1 2 3 4 5 6 7 8 9 10 11 |
| Pathway ID | Tissue | Disease Stage | Description | Gene Ratio | Bg Ratio | pvalue | p.adjust | qvalue | Count |
| hsa043909 | Endometrium | AEH | Hippo signaling pathway | 38/1197 | 157/8465 | 4.79e-04 | 3.38e-03 | 2.47e-03 | 38 |
| hsa0439014 | Endometrium | AEH | Hippo signaling pathway | 38/1197 | 157/8465 | 4.79e-04 | 3.38e-03 | 2.47e-03 | 38 |
| hsa0439023 | Endometrium | EEC | Hippo signaling pathway | 39/1237 | 157/8465 | 4.54e-04 | 3.47e-03 | 2.59e-03 | 39 |
| hsa0439033 | Endometrium | EEC | Hippo signaling pathway | 39/1237 | 157/8465 | 4.54e-04 | 3.47e-03 | 2.59e-03 | 39 |
| Page: 1 |
Top |
Cell-cell communication analysis |
| Identification of potential cell-cell interactions between two cell types and their ligand-receptor pairs for different disease states |
| Ligand | Receptor | LRpair | Pathway | Tissue | Disease Stage |
| Page: 1 |
Top |
Single-cell gene regulatory network inference analysis |
| Find out the significant the regulons (TFs) and the target genes of each regulon across cell types for different disease states |
| TF | Cell Type | Tissue | Disease Stage | Target Gene | RSS | Regulon Activity |
| ∗The dot plots of a searched regulon are shown for all cell subpopulations in each disease state of each tissue based on the regulon specific score inferred using pySCENIC and by calculating the average expression. |
| Page: 1 |
Top |
Somatic mutation of malignant transformation related genes |
| Annotation of somatic variants for genes involved in malignant transformation |
| Hugo Symbol | Variant Class | Variant Classification | dbSNP RS | HGVSc | HGVSp | HGVSp Short | SWISSPROT | BIOTYPE | SIFT | PolyPhen | Tumor Sample Barcode | Tissue | Histology | Sex | Age | Stage | Therapy Types | Drugs | Outcome |
| Page: 1 |
Top |
Related drugs of malignant transformation related genes |
| Identification of chemicals and drugs interact with genes involved in malignant transfromation |
| (DGIdb 4.0) |
| Entrez ID | Symbol | Category | Interaction Types | Drug Claim Name | Drug Name | PMIDs |
| 1490 | CCN2 | DRUGGABLE GENOME, GROWTH FACTOR | THROMBIN | THROMBIN | 10952976 | |
| 1490 | CCN2 | DRUGGABLE GENOME, GROWTH FACTOR | UVB | 11874477 | ||
| 1490 | CCN2 | DRUGGABLE GENOME, GROWTH FACTOR | ENALAPRIL | ENALAPRIL | 18812665 | |
| 1490 | CCN2 | DRUGGABLE GENOME, GROWTH FACTOR | FG-3019 | PAMREVLUMAB | ||
| 1490 | CCN2 | DRUGGABLE GENOME, GROWTH FACTOR | HUMAN CHORIONIC GONADOTROPIN | 15941869 | ||
| 1490 | CCN2 | DRUGGABLE GENOME, GROWTH FACTOR | RXI-109 | 24587648 | ||
| 1490 | CCN2 | DRUGGABLE GENOME, GROWTH FACTOR | 2-METHOXYESTRADIOL | 2-METHOXYESTRADIOL | 18292194 | |
| 1490 | CCN2 | DRUGGABLE GENOME, GROWTH FACTOR | VEGF | 11018037,12114504 | ||
| 1490 | CCN2 | DRUGGABLE GENOME, GROWTH FACTOR | DIGOXIN | DIGOXIN | 12691286 | |
| 1490 | CCN2 | DRUGGABLE GENOME, GROWTH FACTOR | INSULIN | INSULIN | 11956149 |
| Page: 1 2 3 |

Copyright 2023-Present -The University of Texas Health Science Center at Houston |