
|
|||||
|
 | |
| |
| |
| |
| |
| |
|
Gene: CCN1 |
Gene summary for CCN1 |
| Gene information | Species | Human | Gene symbol | CCN1 | Gene ID | 3491 |
| Gene name | cellular communication network factor 1 | |
| Gene Alias | CYR61 | |
| Cytomap | 1p22.3 | |
| Gene Type | protein-coding | GO ID | GO:0000003 | UniProtAcc | O00622 |
Top |
Malignant transformation analysis |
| Identification of the aberrant gene expression in precancerous and cancerous lesions by comparing the gene expression of stem-like cells in diseased tissues with normal stem cells |
| Entrez ID | Symbol | Replicates | Species | Organ | Tissue | Adj P-value | Log2FC | Malignancy |
| 3491 | CCN1 | CA_HPV_1 | Human | Cervix | CC | 1.55e-06 | -1.60e-01 | 0.0264 |
| 3491 | CCN1 | Tumor | Human | Cervix | CC | 4.20e-07 | -1.75e-01 | 0.1241 |
| 3491 | CCN1 | sample1 | Human | Cervix | CC | 5.32e-04 | 3.57e-01 | 0.0959 |
| 3491 | CCN1 | T1 | Human | Cervix | CC | 3.54e-24 | 6.37e-01 | 0.0918 |
| 3491 | CCN1 | T2 | Human | Cervix | CC | 6.24e-09 | 6.14e-01 | 0.0709 |
| 3491 | CCN1 | AEH-subject1 | Human | Endometrium | AEH | 7.22e-51 | 8.29e-01 | -0.3059 |
| 3491 | CCN1 | AEH-subject2 | Human | Endometrium | AEH | 8.34e-19 | 5.05e-01 | -0.2525 |
| 3491 | CCN1 | AEH-subject3 | Human | Endometrium | AEH | 1.02e-26 | 5.59e-01 | -0.2576 |
| 3491 | CCN1 | AEH-subject4 | Human | Endometrium | AEH | 1.34e-37 | 8.51e-01 | -0.2657 |
| 3491 | CCN1 | AEH-subject5 | Human | Endometrium | AEH | 6.95e-19 | 4.06e-01 | -0.2953 |
| 3491 | CCN1 | EEC-subject1 | Human | Endometrium | EEC | 4.51e-35 | 7.06e-01 | -0.2682 |
| 3491 | CCN1 | EEC-subject2 | Human | Endometrium | EEC | 3.02e-19 | 4.02e-01 | -0.2607 |
| 3491 | CCN1 | EEC-subject3 | Human | Endometrium | EEC | 1.89e-07 | 4.08e-01 | -0.2525 |
| 3491 | CCN1 | EEC-subject4 | Human | Endometrium | EEC | 5.97e-26 | 5.13e-01 | -0.2571 |
| 3491 | CCN1 | EEC-subject5 | Human | Endometrium | EEC | 8.27e-52 | 9.35e-01 | -0.249 |
| 3491 | CCN1 | LZE3D | Human | Esophagus | HGIN | 8.88e-07 | 2.23e+00 | 0.0668 |
| 3491 | CCN1 | LZE4T | Human | Esophagus | ESCC | 7.96e-15 | 7.84e-01 | 0.0811 |
| 3491 | CCN1 | LZE5T | Human | Esophagus | ESCC | 1.48e-05 | 4.15e-01 | 0.0514 |
| 3491 | CCN1 | LZE7T | Human | Esophagus | ESCC | 1.40e-08 | 4.76e-01 | 0.0667 |
| 3491 | CCN1 | LZE8T | Human | Esophagus | ESCC | 1.65e-04 | 2.12e-01 | 0.067 |
| Page: 1 2 3 4 5 6 |
| Tissue | Expression Dynamics | Abbreviation |
| Cervix | 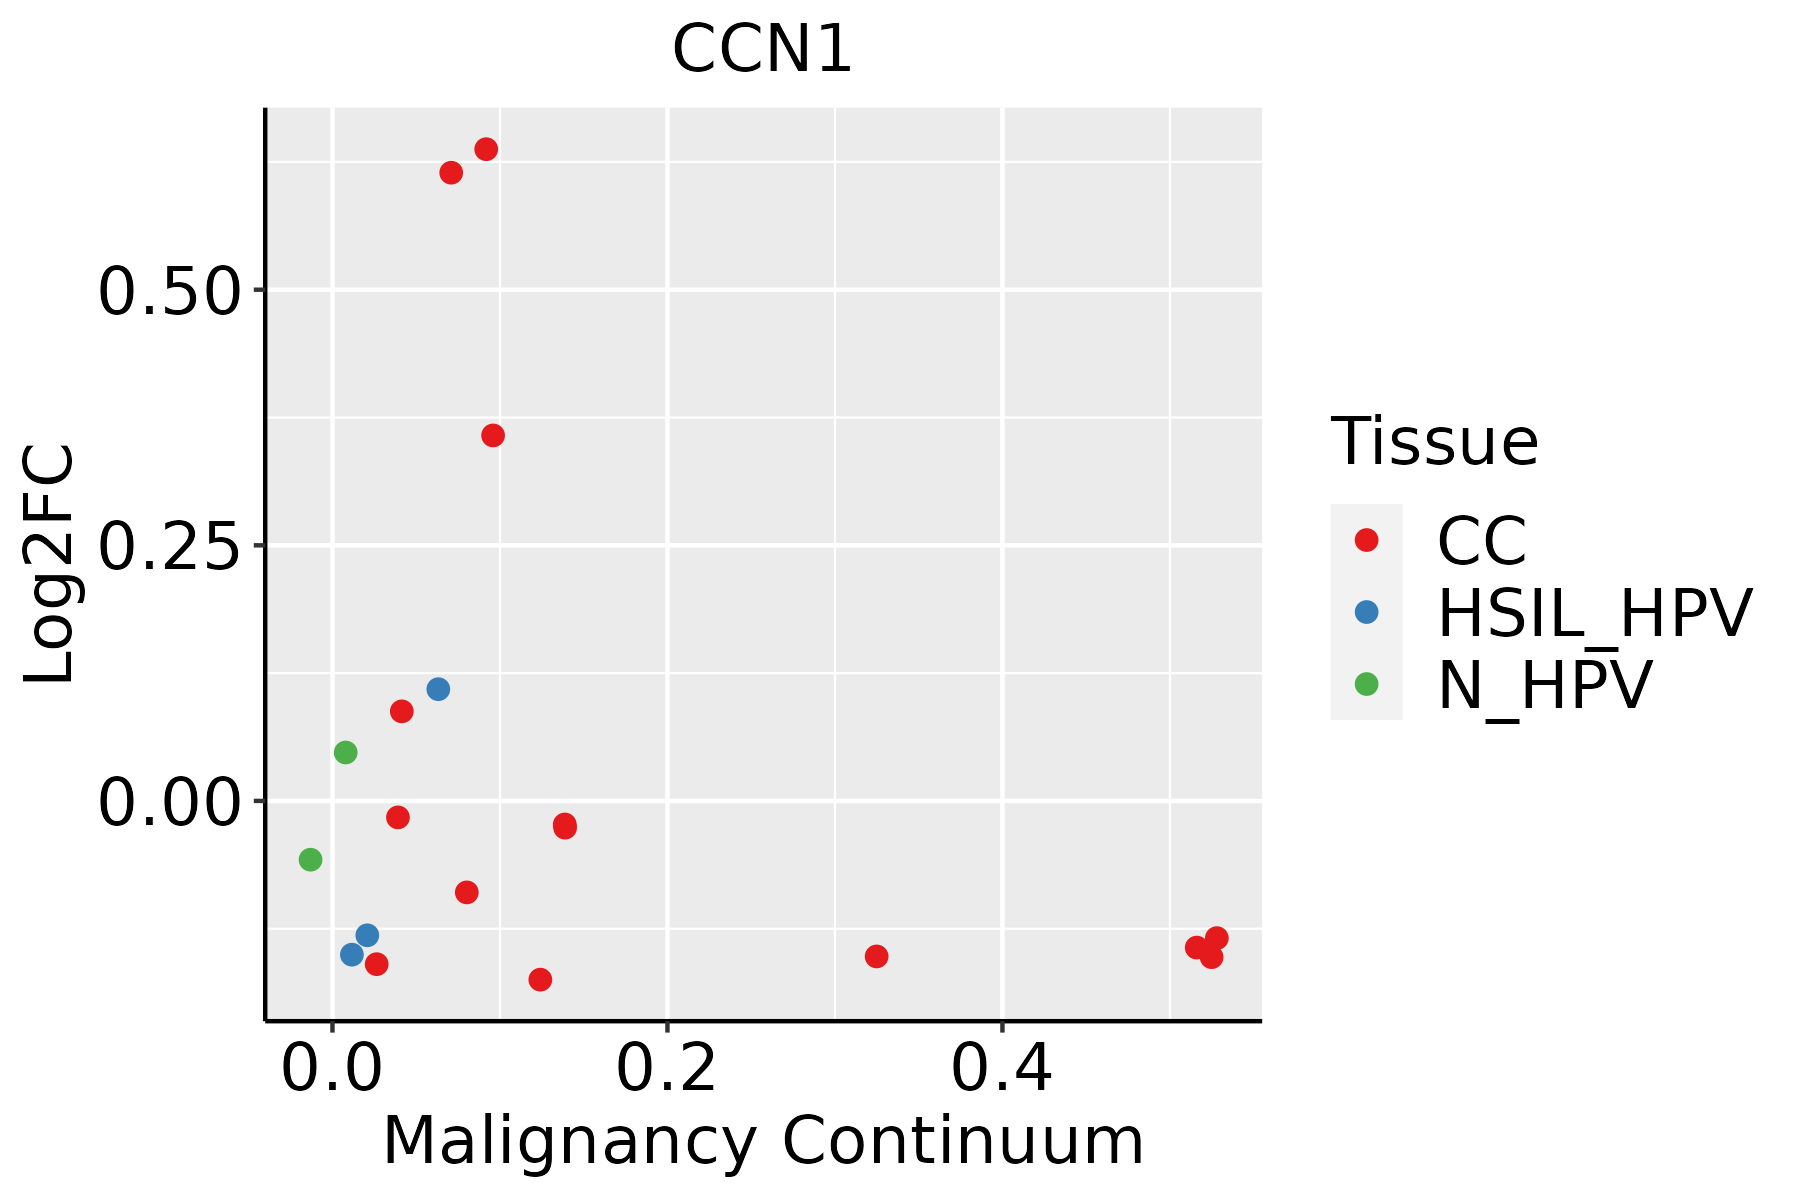 | CC: Cervix cancer |
| HSIL_HPV: HPV-infected high-grade squamous intraepithelial lesions | ||
| N_HPV: HPV-infected normal cervix | ||
| Endometrium | 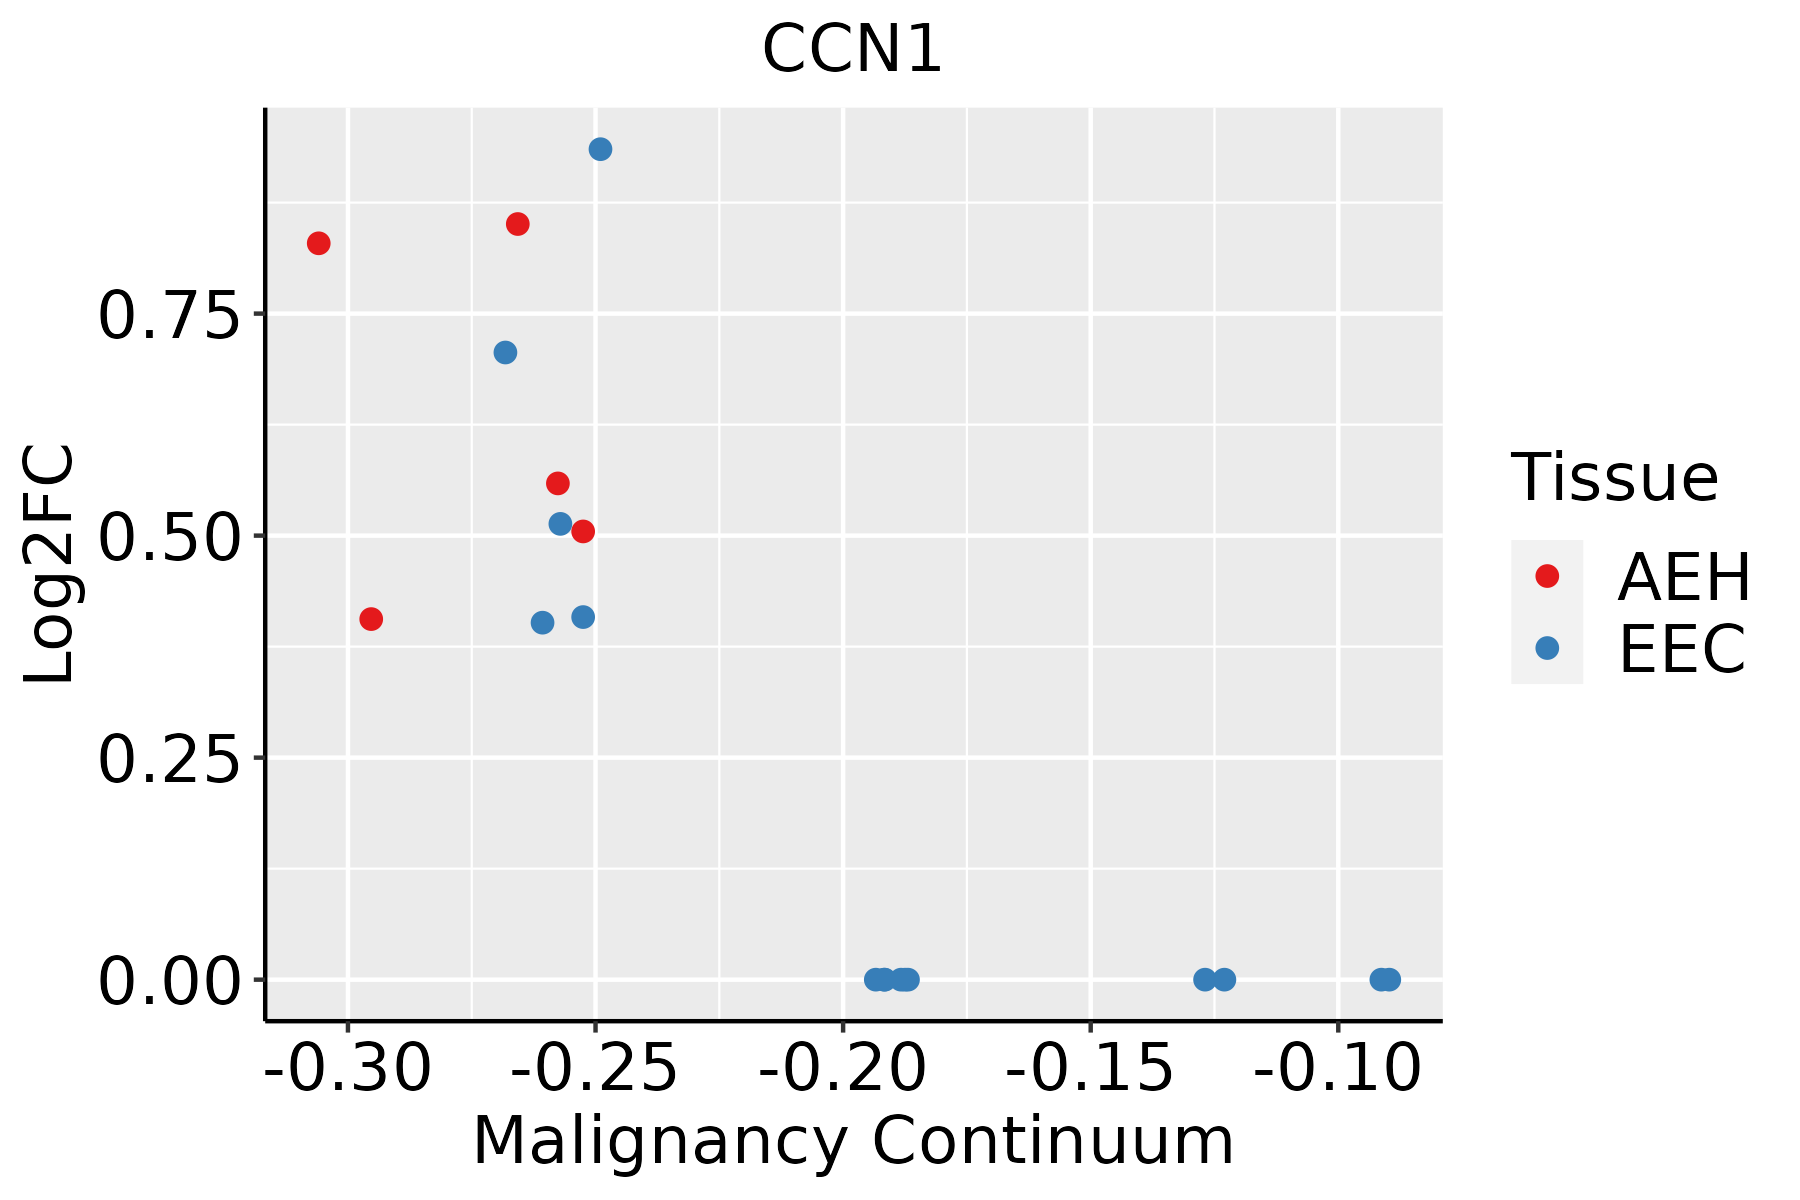 | AEH: Atypical endometrial hyperplasia |
| EEC: Endometrioid Cancer | ||
| Esophagus |  | ESCC: Esophageal squamous cell carcinoma |
| HGIN: High-grade intraepithelial neoplasias | ||
| LGIN: Low-grade intraepithelial neoplasias | ||
| Lung | 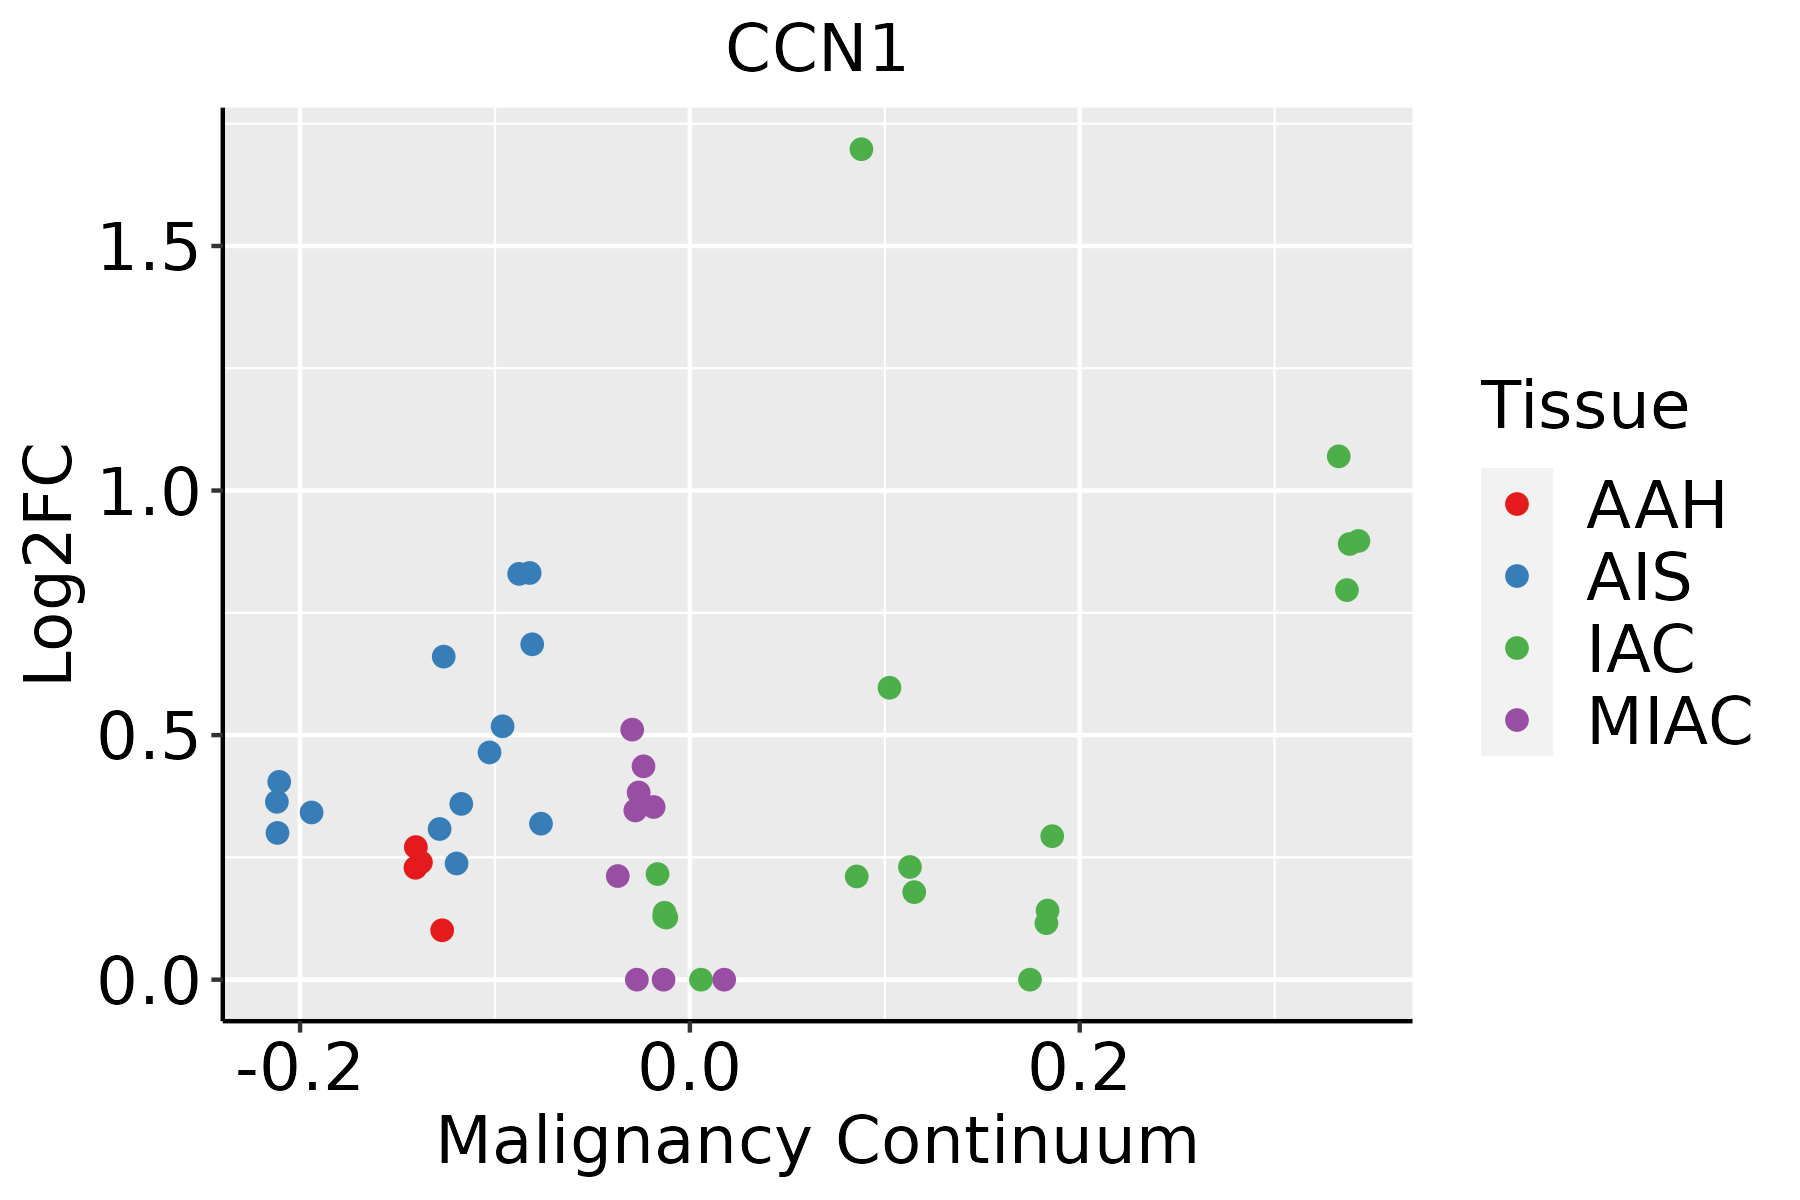 | AAH: Atypical adenomatous hyperplasia |
| AIS: Adenocarcinoma in situ | ||
| IAC: Invasive lung adenocarcinoma | ||
| MIA: Minimally invasive adenocarcinoma | ||
| Oral Cavity | 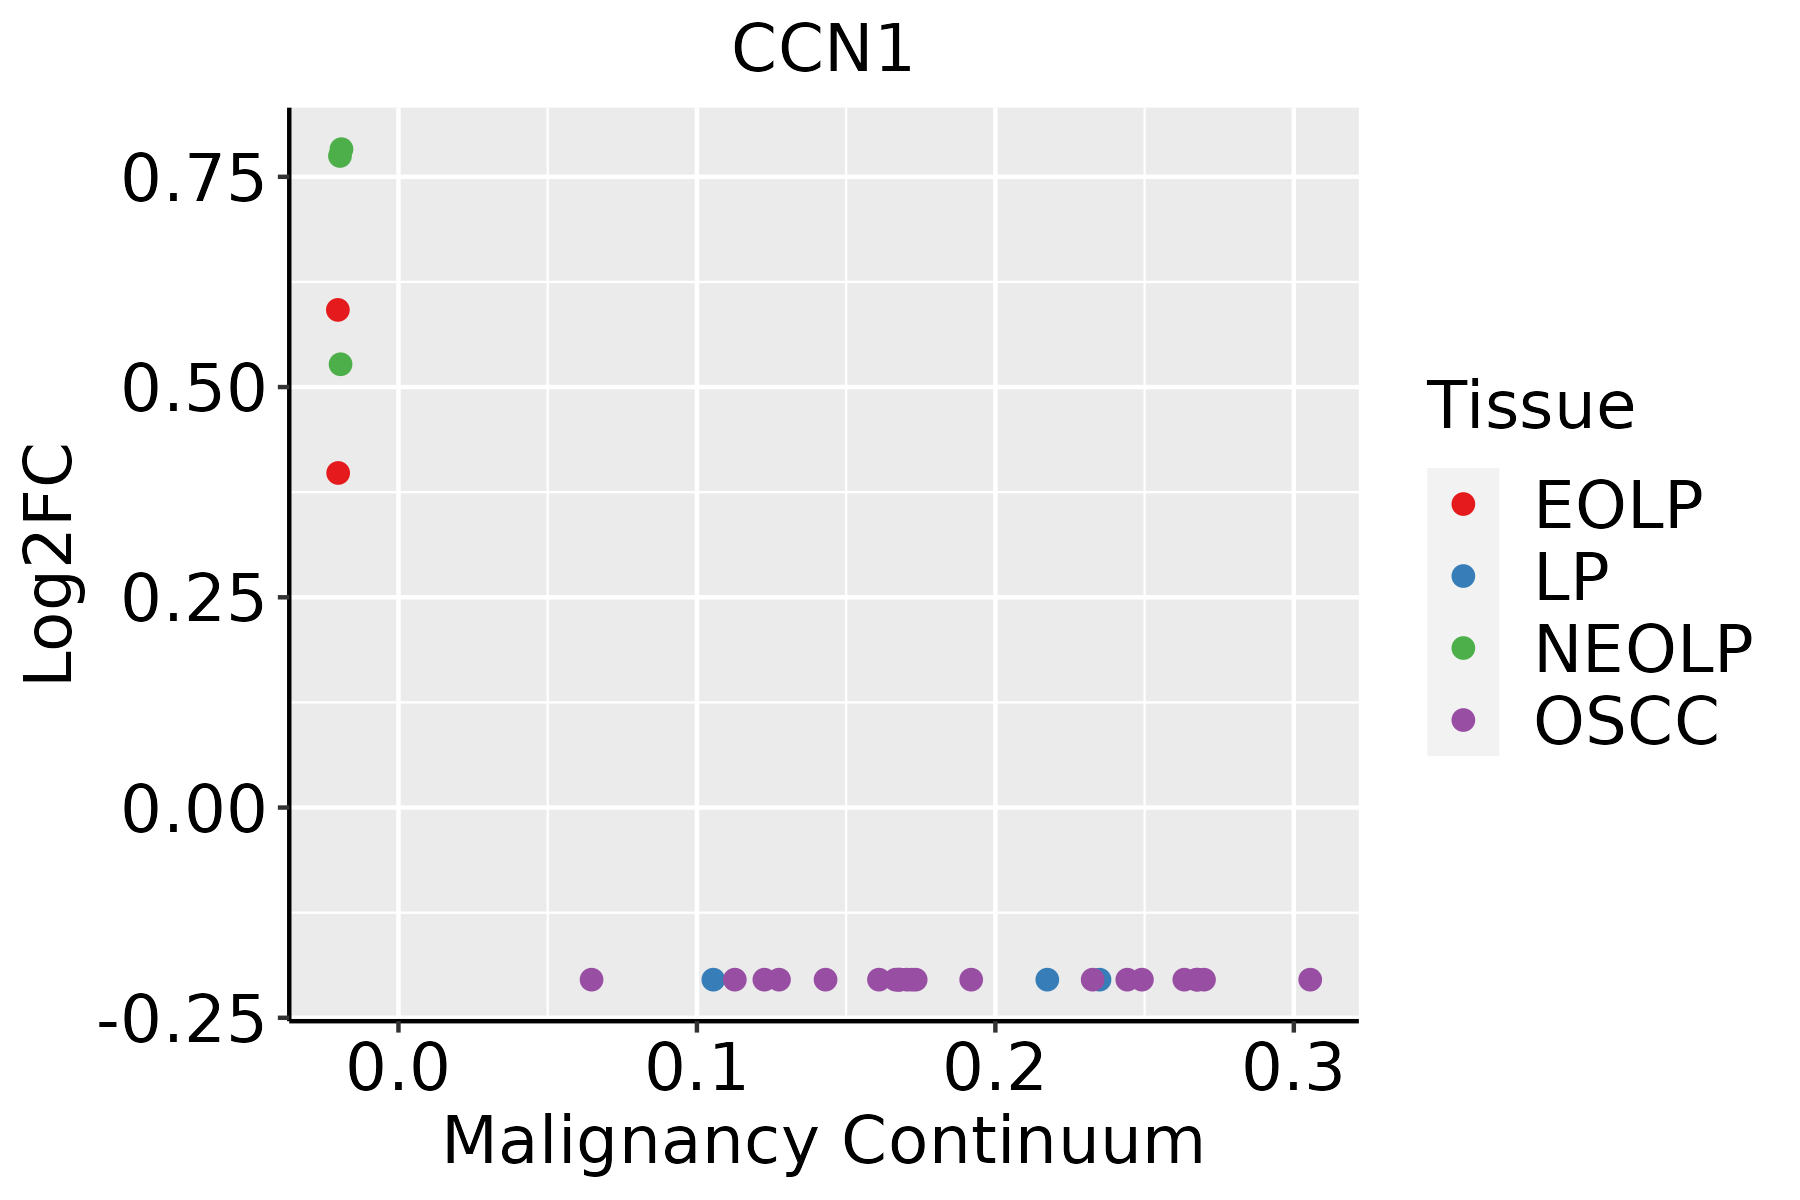 | EOLP: Erosive Oral lichen planus |
| LP: leukoplakia | ||
| NEOLP: Non-erosive oral lichen planus | ||
| OSCC: Oral squamous cell carcinoma | ||
| Prostate | 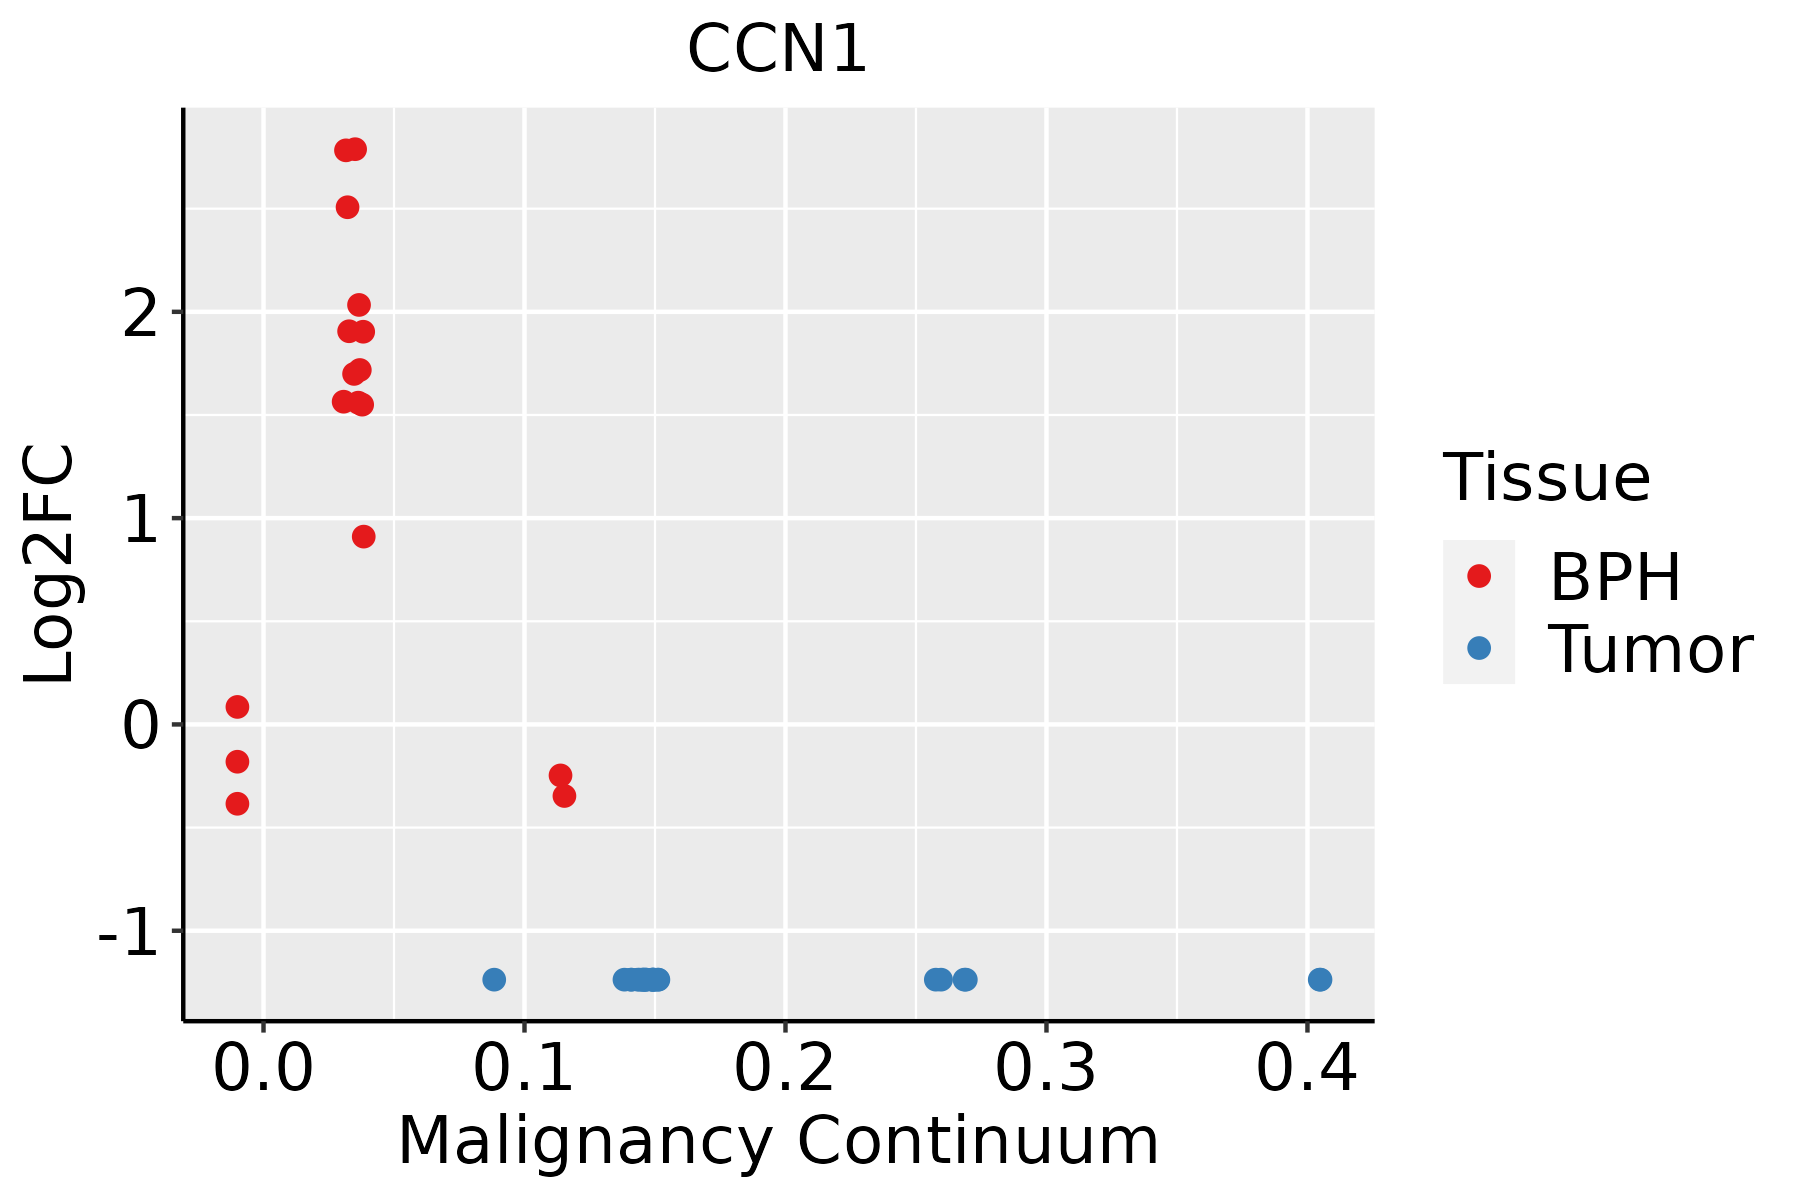 | BPH: Benign Prostatic Hyperplasia |
| Skin | 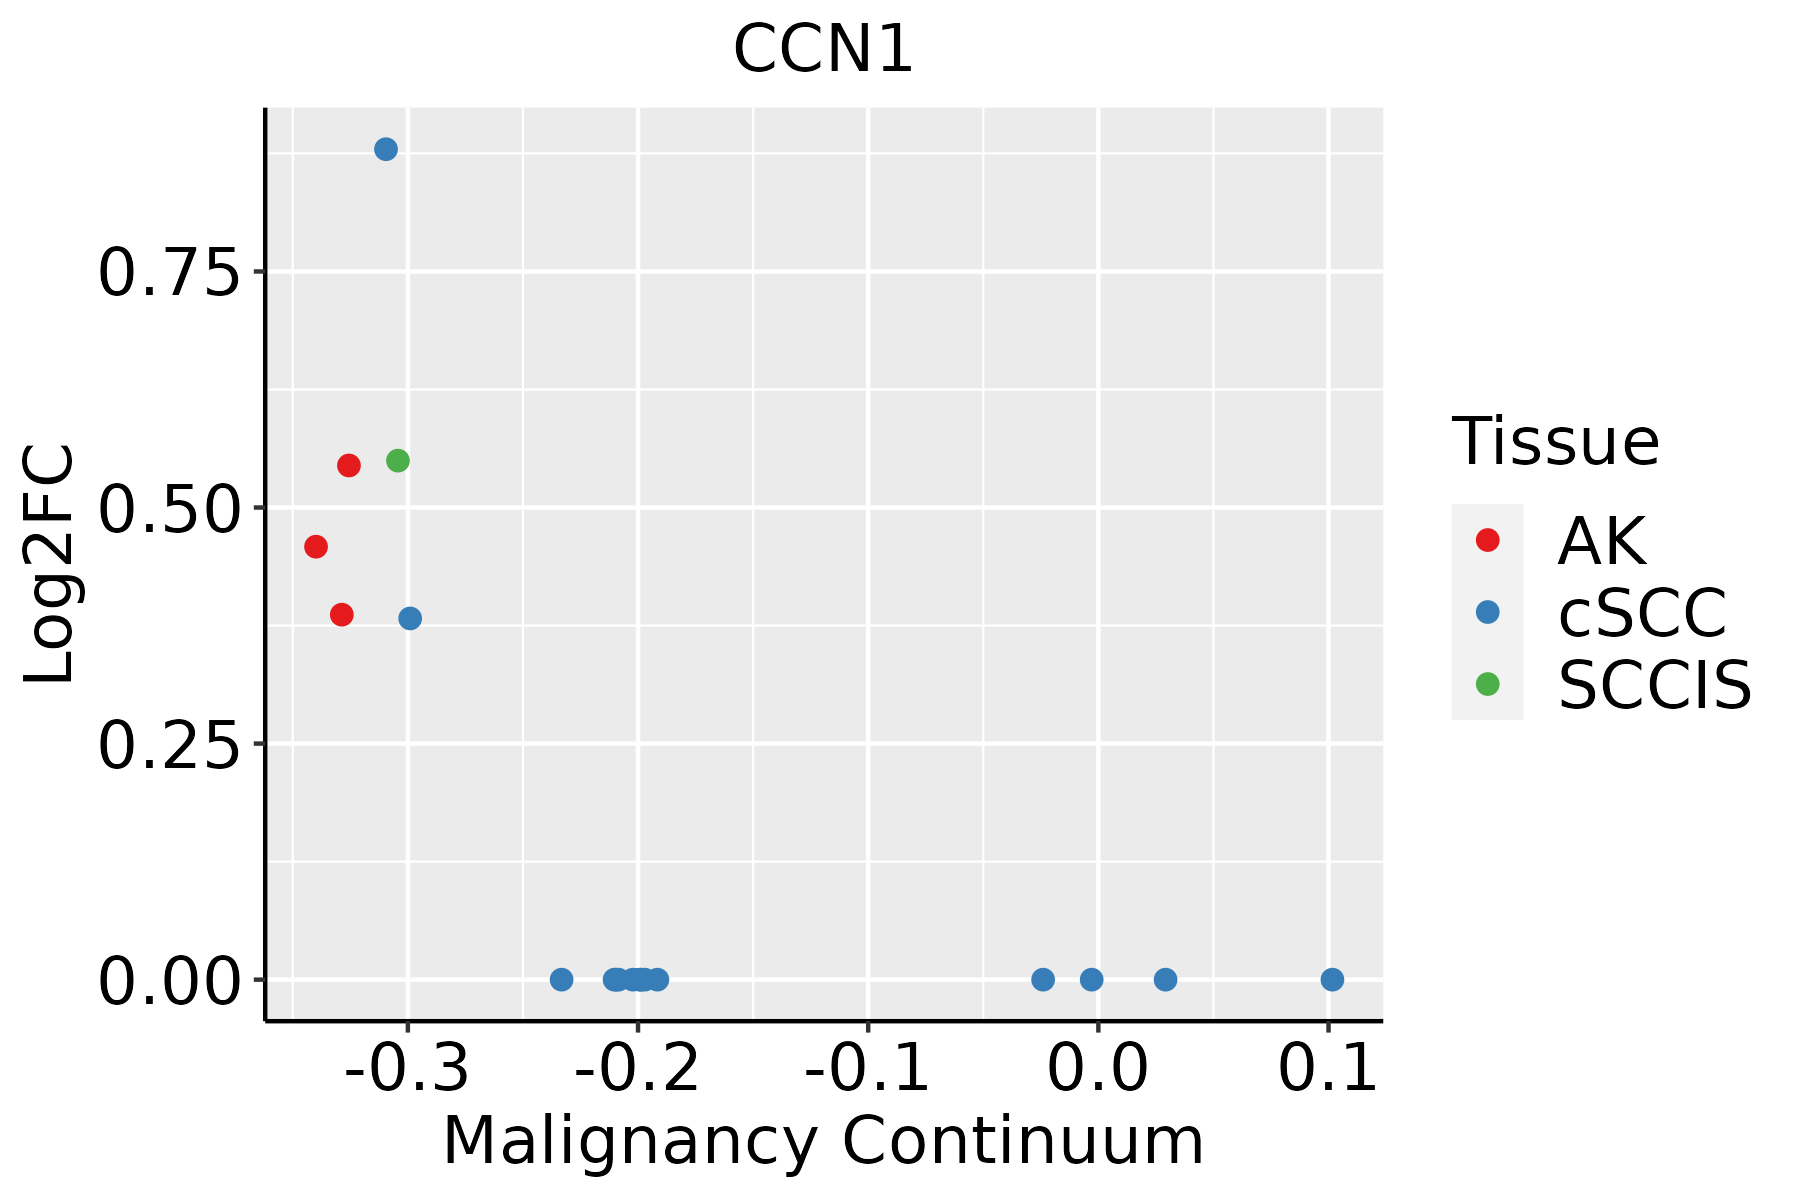 | AK: Actinic keratosis |
| cSCC: Cutaneous squamous cell carcinoma | ||
| SCCIS:squamous cell carcinoma in situ | ||
| Thyroid | 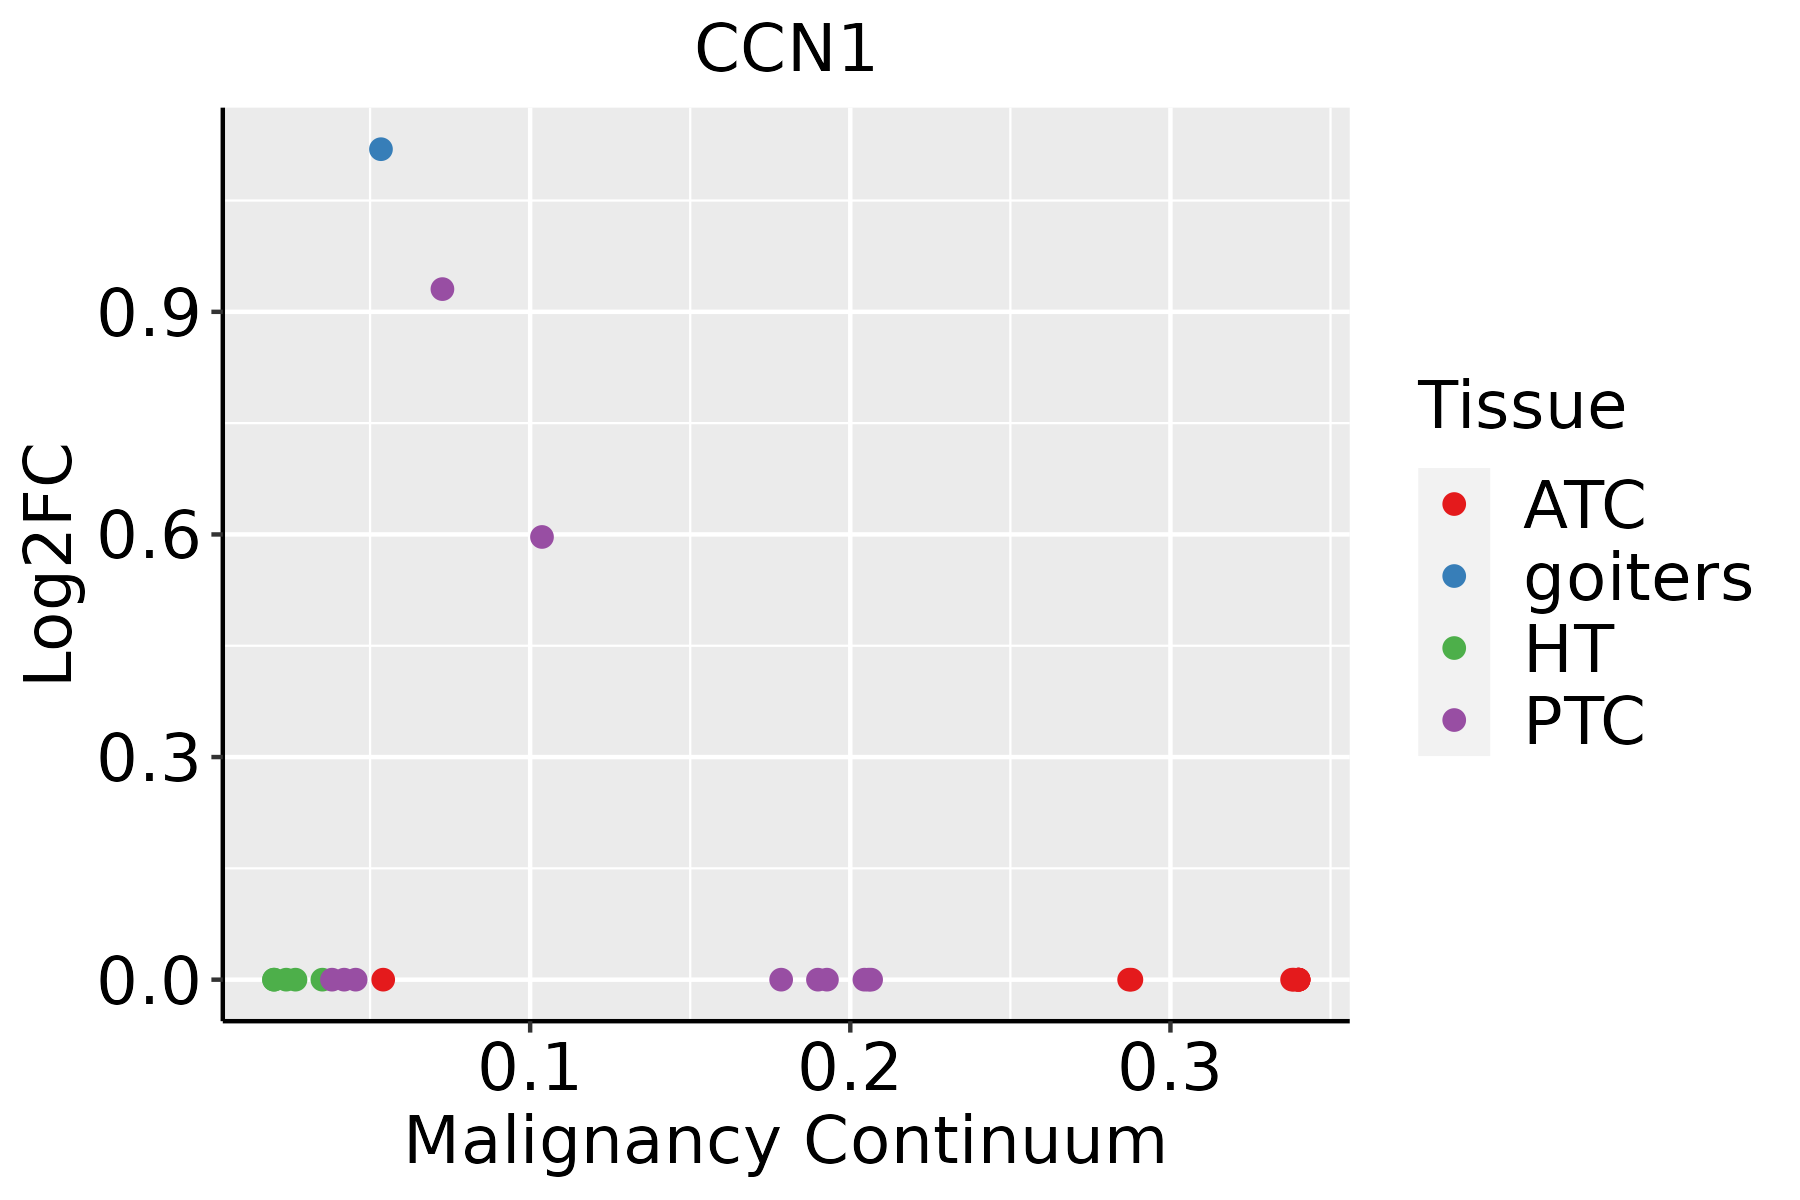 | ATC: Anaplastic thyroid cancer |
| HT: Hashimoto's thyroiditis | ||
| PTC: Papillary thyroid cancer |
| ∗log2FC in expression of this searched gene in stem-like cells from each diseased tissue sample relative to stem-like cells in normal samples in each tissue plotted against the malignancy continuum. Samples are colored based on if they are from different disease stage. |
Top |
Malignant transformation related pathway analysis |
| Find out the enriched GO biological processes and KEGG pathways involved in transition from healthy to precancer to cancer |
| Tissue | Disease Stage | Enriched GO biological Processes |
| Colorectum | AD |  |
| Colorectum | SER |  |
| Colorectum | MSS |  |
| Colorectum | MSI-H |  |
| Colorectum | FAP |  |
| ∗Top 15 enriched GO BP terms are showed in the bar plot of each disease state in each tissue. Each row represents a significant GO biological process which is colored according to the -log10(p.adjust). |
| Page: 1 2 3 4 5 6 7 8 9 |
| GO ID | Tissue | Disease Stage | Description | Gene Ratio | Bg Ratio | pvalue | p.adjust | Count |
| GO:004206010 | Cervix | CC | wound healing | 109/2311 | 422/18723 | 1.84e-14 | 1.57e-11 | 109 |
| GO:001081010 | Cervix | CC | regulation of cell-substrate adhesion | 69/2311 | 221/18723 | 8.57e-14 | 5.69e-11 | 69 |
| GO:00315898 | Cervix | CC | cell-substrate adhesion | 96/2311 | 363/18723 | 1.48e-13 | 8.85e-11 | 96 |
| GO:005254710 | Cervix | CC | regulation of peptidase activity | 112/2311 | 461/18723 | 6.70e-13 | 3.08e-10 | 112 |
| GO:004586210 | Cervix | CC | positive regulation of proteolysis | 95/2311 | 372/18723 | 1.84e-12 | 6.86e-10 | 95 |
| GO:005254810 | Cervix | CC | regulation of endopeptidase activity | 103/2311 | 432/18723 | 1.89e-11 | 5.14e-09 | 103 |
| GO:004578510 | Cervix | CC | positive regulation of cell adhesion | 101/2311 | 437/18723 | 1.96e-10 | 3.08e-08 | 101 |
| GO:001095210 | Cervix | CC | positive regulation of peptidase activity | 54/2311 | 197/18723 | 8.06e-09 | 6.99e-07 | 54 |
| GO:003367410 | Cervix | CC | positive regulation of kinase activity | 101/2311 | 467/18723 | 8.66e-09 | 7.22e-07 | 101 |
| GO:200011610 | Cervix | CC | regulation of cysteine-type endopeptidase activity | 61/2311 | 235/18723 | 8.69e-09 | 7.22e-07 | 61 |
| GO:004328110 | Cervix | CC | regulation of cysteine-type endopeptidase activity involved in apoptotic process | 55/2311 | 209/18723 | 2.77e-08 | 1.95e-06 | 55 |
| GO:00458608 | Cervix | CC | positive regulation of protein kinase activity | 85/2311 | 386/18723 | 5.61e-08 | 3.29e-06 | 85 |
| GO:00443193 | Cervix | CC | wound healing, spreading of cells | 17/2311 | 34/18723 | 9.86e-08 | 5.25e-06 | 17 |
| GO:00905053 | Cervix | CC | epiboly involved in wound healing | 17/2311 | 34/18723 | 9.86e-08 | 5.25e-06 | 17 |
| GO:001095010 | Cervix | CC | positive regulation of endopeptidase activity | 48/2311 | 179/18723 | 1.12e-07 | 5.71e-06 | 48 |
| GO:00905043 | Cervix | CC | epiboly | 17/2311 | 35/18723 | 1.70e-07 | 7.93e-06 | 17 |
| GO:00018908 | Cervix | CC | placenta development | 40/2311 | 144/18723 | 4.59e-07 | 1.77e-05 | 40 |
| GO:00614588 | Cervix | CC | reproductive system development | 87/2311 | 427/18723 | 1.37e-06 | 4.55e-05 | 87 |
| GO:00486088 | Cervix | CC | reproductive structure development | 86/2311 | 424/18723 | 1.90e-06 | 5.97e-05 | 86 |
| GO:00020111 | Cervix | CC | morphogenesis of an epithelial sheet | 21/2311 | 57/18723 | 1.91e-06 | 5.97e-05 | 21 |
| Page: 1 2 3 4 5 6 7 8 9 10 11 12 13 14 15 16 17 18 19 20 21 22 23 24 25 26 27 28 29 30 31 32 33 34 35 36 37 |
| Pathway ID | Tissue | Disease Stage | Description | Gene Ratio | Bg Ratio | pvalue | p.adjust | qvalue | Count |
| Page: 1 |
Top |
Cell-cell communication analysis |
| Identification of potential cell-cell interactions between two cell types and their ligand-receptor pairs for different disease states |
| Ligand | Receptor | LRpair | Pathway | Tissue | Disease Stage |
| Page: 1 |
Top |
Single-cell gene regulatory network inference analysis |
| Find out the significant the regulons (TFs) and the target genes of each regulon across cell types for different disease states |
| TF | Cell Type | Tissue | Disease Stage | Target Gene | RSS | Regulon Activity |
| ∗The dot plots of a searched regulon are shown for all cell subpopulations in each disease state of each tissue based on the regulon specific score inferred using pySCENIC and by calculating the average expression. |
| Page: 1 |
Top |
Somatic mutation of malignant transformation related genes |
| Annotation of somatic variants for genes involved in malignant transformation |
| Hugo Symbol | Variant Class | Variant Classification | dbSNP RS | HGVSc | HGVSp | HGVSp Short | SWISSPROT | BIOTYPE | SIFT | PolyPhen | Tumor Sample Barcode | Tissue | Histology | Sex | Age | Stage | Therapy Types | Drugs | Outcome |
| Page: 1 |
Top |
Related drugs of malignant transformation related genes |
| Identification of chemicals and drugs interact with genes involved in malignant transfromation |
| (DGIdb 4.0) |
| Entrez ID | Symbol | Category | Interaction Types | Drug Claim Name | Drug Name | PMIDs |
| 3491 | CCN1 | DRUGGABLE GENOME | ANTISENSE OLIGONUCLEOTIDES | 18381294 | ||
| 3491 | CCN1 | DRUGGABLE GENOME | INTERLEUKIN-8 | 18025257 | ||
| 3491 | CCN1 | DRUGGABLE GENOME | HYPOTENSIVE AGENTS | 12724323 |
| Page: 1 |

Copyright 2023-Present -The University of Texas Health Science Center at Houston |