
|
|||||
|
 | |
| |
| |
| |
| |
| |
|
Gene: CCM2 |
Gene summary for CCM2 |
| Gene information | Species | Human | Gene symbol | CCM2 | Gene ID | 83605 |
| Gene name | CCM2 scaffold protein | |
| Gene Alias | C7orf22 | |
| Cytomap | 7p13 | |
| Gene Type | protein-coding | GO ID | GO:0000165 | UniProtAcc | Q9BSQ5 |
Top |
Malignant transformation analysis |
| Identification of the aberrant gene expression in precancerous and cancerous lesions by comparing the gene expression of stem-like cells in diseased tissues with normal stem cells |
| Entrez ID | Symbol | Replicates | Species | Organ | Tissue | Adj P-value | Log2FC | Malignancy |
| 83605 | CCM2 | LZE4T | Human | Esophagus | ESCC | 1.47e-05 | 1.50e-01 | 0.0811 |
| 83605 | CCM2 | LZE7T | Human | Esophagus | ESCC | 3.80e-02 | 1.26e-01 | 0.0667 |
| 83605 | CCM2 | LZE20T | Human | Esophagus | ESCC | 2.40e-05 | 3.19e-01 | 0.0662 |
| 83605 | CCM2 | LZE22T | Human | Esophagus | ESCC | 4.08e-08 | 4.58e-01 | 0.068 |
| 83605 | CCM2 | LZE24T | Human | Esophagus | ESCC | 1.70e-02 | 1.93e-01 | 0.0596 |
| 83605 | CCM2 | P1T-E | Human | Esophagus | ESCC | 1.62e-08 | 5.23e-01 | 0.0875 |
| 83605 | CCM2 | P2T-E | Human | Esophagus | ESCC | 1.83e-22 | 4.11e-01 | 0.1177 |
| 83605 | CCM2 | P4T-E | Human | Esophagus | ESCC | 3.26e-18 | 3.71e-01 | 0.1323 |
| 83605 | CCM2 | P5T-E | Human | Esophagus | ESCC | 2.19e-09 | 2.08e-01 | 0.1327 |
| 83605 | CCM2 | P8T-E | Human | Esophagus | ESCC | 6.91e-14 | 2.47e-01 | 0.0889 |
| 83605 | CCM2 | P9T-E | Human | Esophagus | ESCC | 3.64e-10 | 3.29e-01 | 0.1131 |
| 83605 | CCM2 | P10T-E | Human | Esophagus | ESCC | 2.07e-16 | 3.01e-01 | 0.116 |
| 83605 | CCM2 | P11T-E | Human | Esophagus | ESCC | 1.09e-14 | 6.63e-01 | 0.1426 |
| 83605 | CCM2 | P12T-E | Human | Esophagus | ESCC | 1.11e-18 | 2.90e-01 | 0.1122 |
| 83605 | CCM2 | P15T-E | Human | Esophagus | ESCC | 5.00e-19 | 4.62e-01 | 0.1149 |
| 83605 | CCM2 | P16T-E | Human | Esophagus | ESCC | 4.14e-10 | 2.20e-01 | 0.1153 |
| 83605 | CCM2 | P17T-E | Human | Esophagus | ESCC | 9.47e-18 | 6.13e-01 | 0.1278 |
| 83605 | CCM2 | P20T-E | Human | Esophagus | ESCC | 6.66e-10 | 2.35e-01 | 0.1124 |
| 83605 | CCM2 | P21T-E | Human | Esophagus | ESCC | 1.06e-30 | 5.81e-01 | 0.1617 |
| 83605 | CCM2 | P22T-E | Human | Esophagus | ESCC | 2.24e-28 | 4.88e-01 | 0.1236 |
| Page: 1 2 3 4 5 6 |
| Tissue | Expression Dynamics | Abbreviation |
| Esophagus |  | ESCC: Esophageal squamous cell carcinoma |
| HGIN: High-grade intraepithelial neoplasias | ||
| LGIN: Low-grade intraepithelial neoplasias | ||
| Liver | 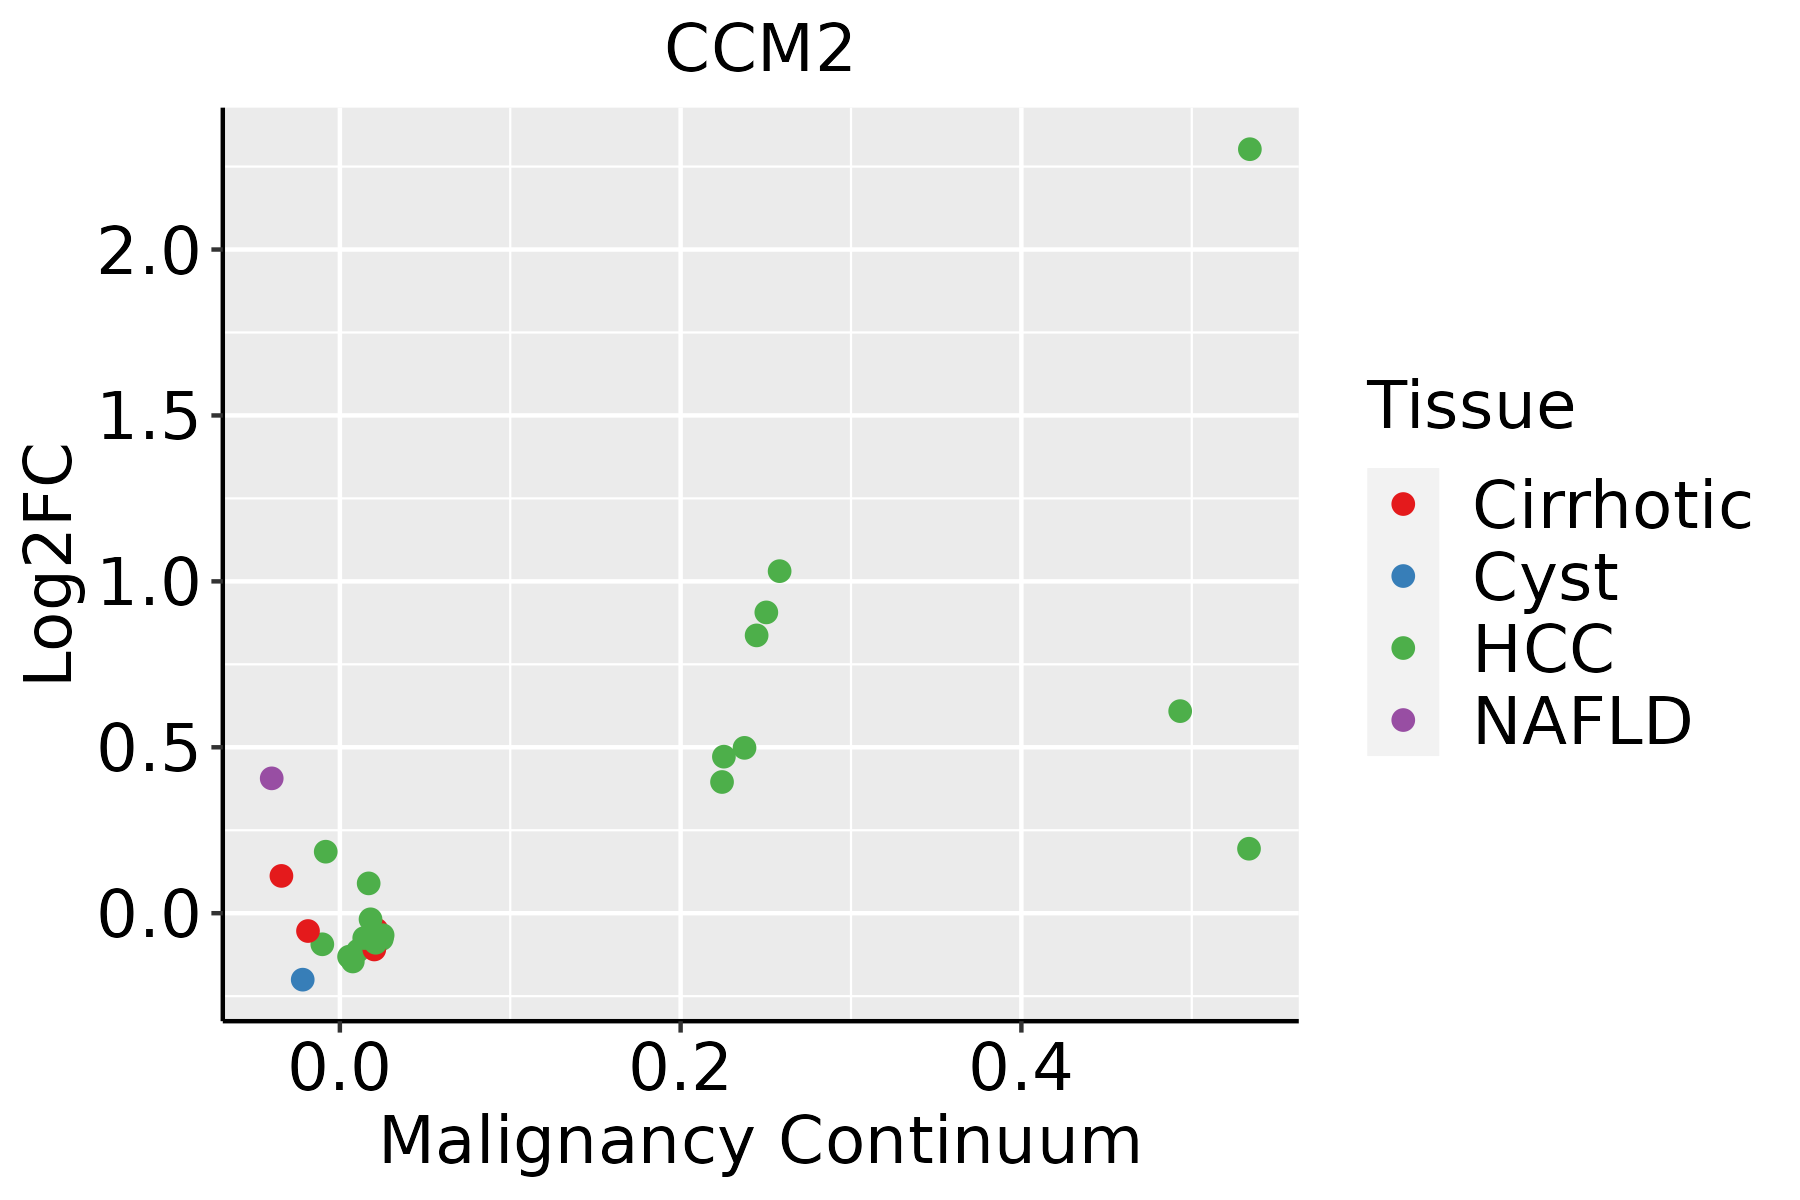 | HCC: Hepatocellular carcinoma |
| NAFLD: Non-alcoholic fatty liver disease | ||
| Oral Cavity | 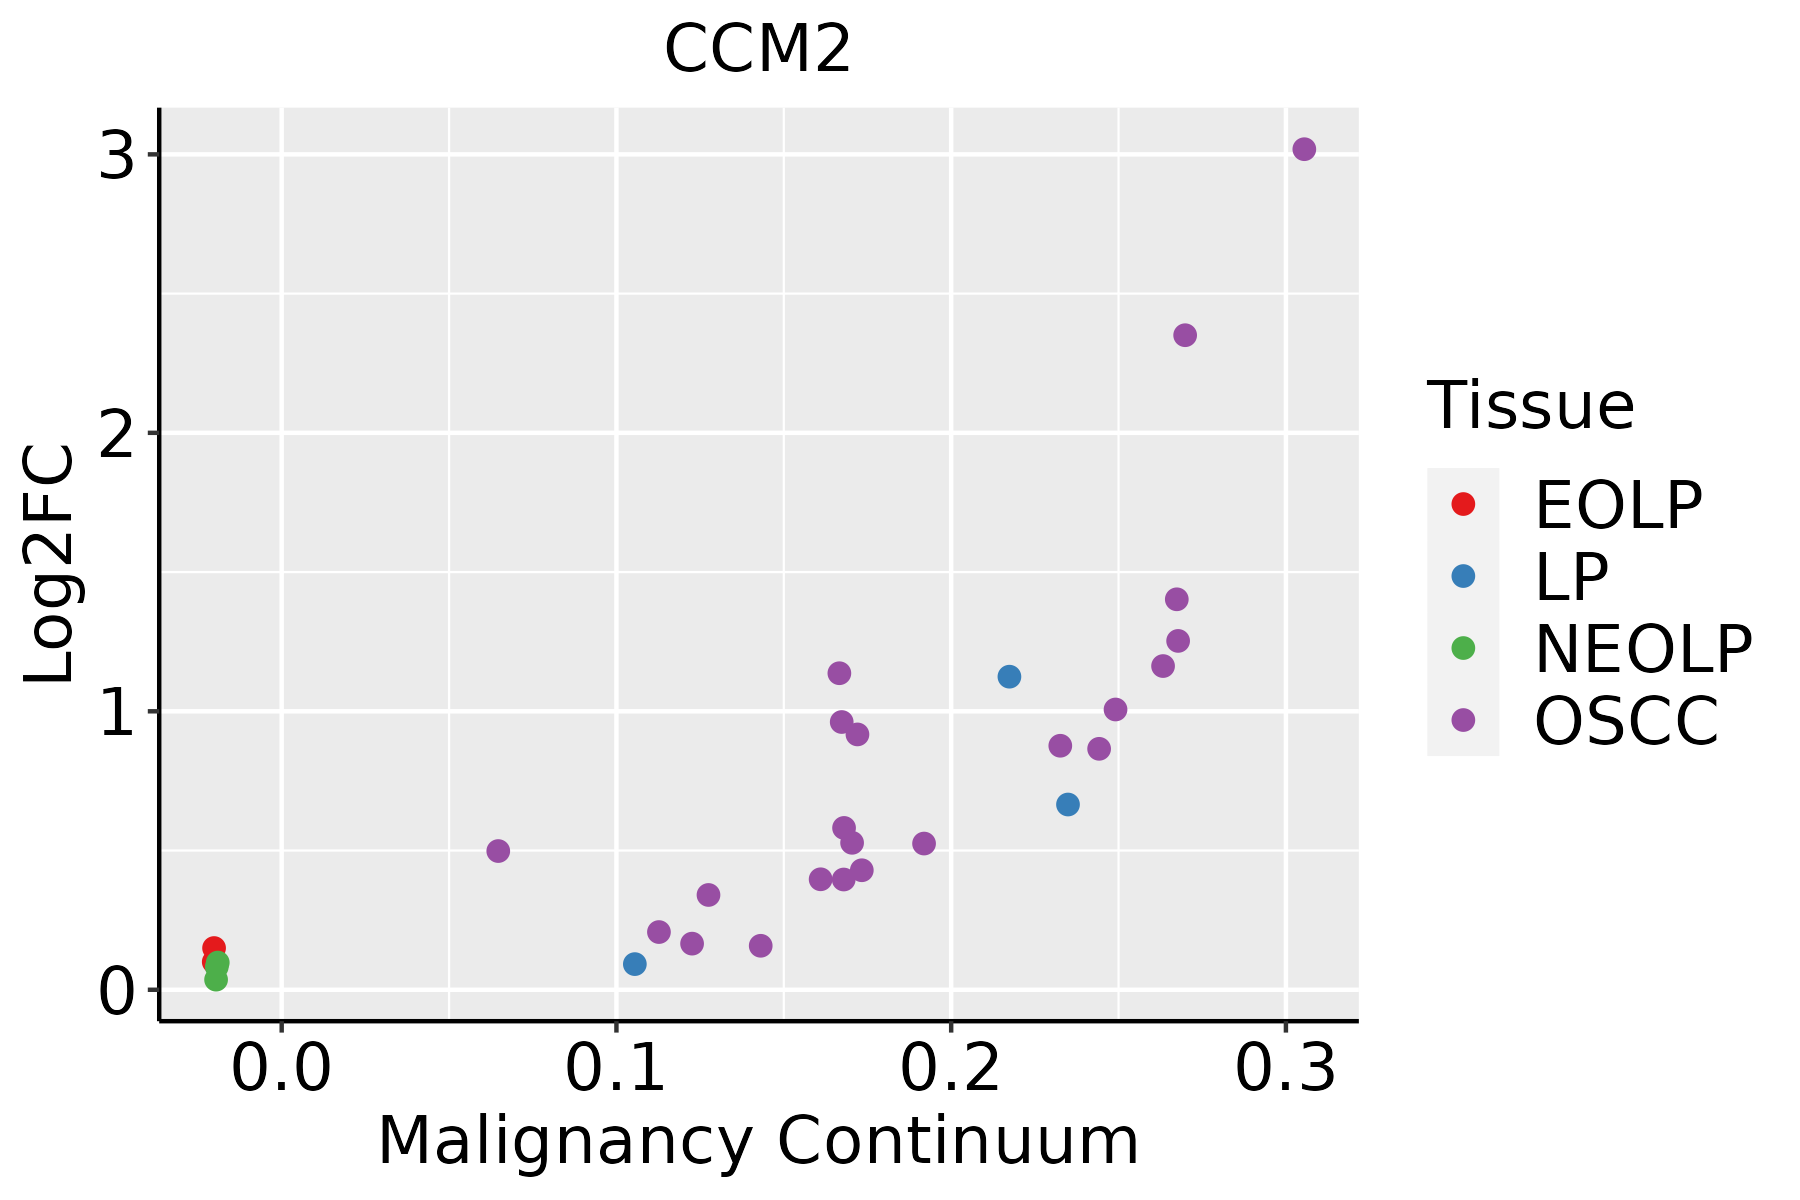 | EOLP: Erosive Oral lichen planus |
| LP: leukoplakia | ||
| NEOLP: Non-erosive oral lichen planus | ||
| OSCC: Oral squamous cell carcinoma | ||
| Skin |  | AK: Actinic keratosis |
| cSCC: Cutaneous squamous cell carcinoma | ||
| SCCIS:squamous cell carcinoma in situ | ||
| Thyroid | 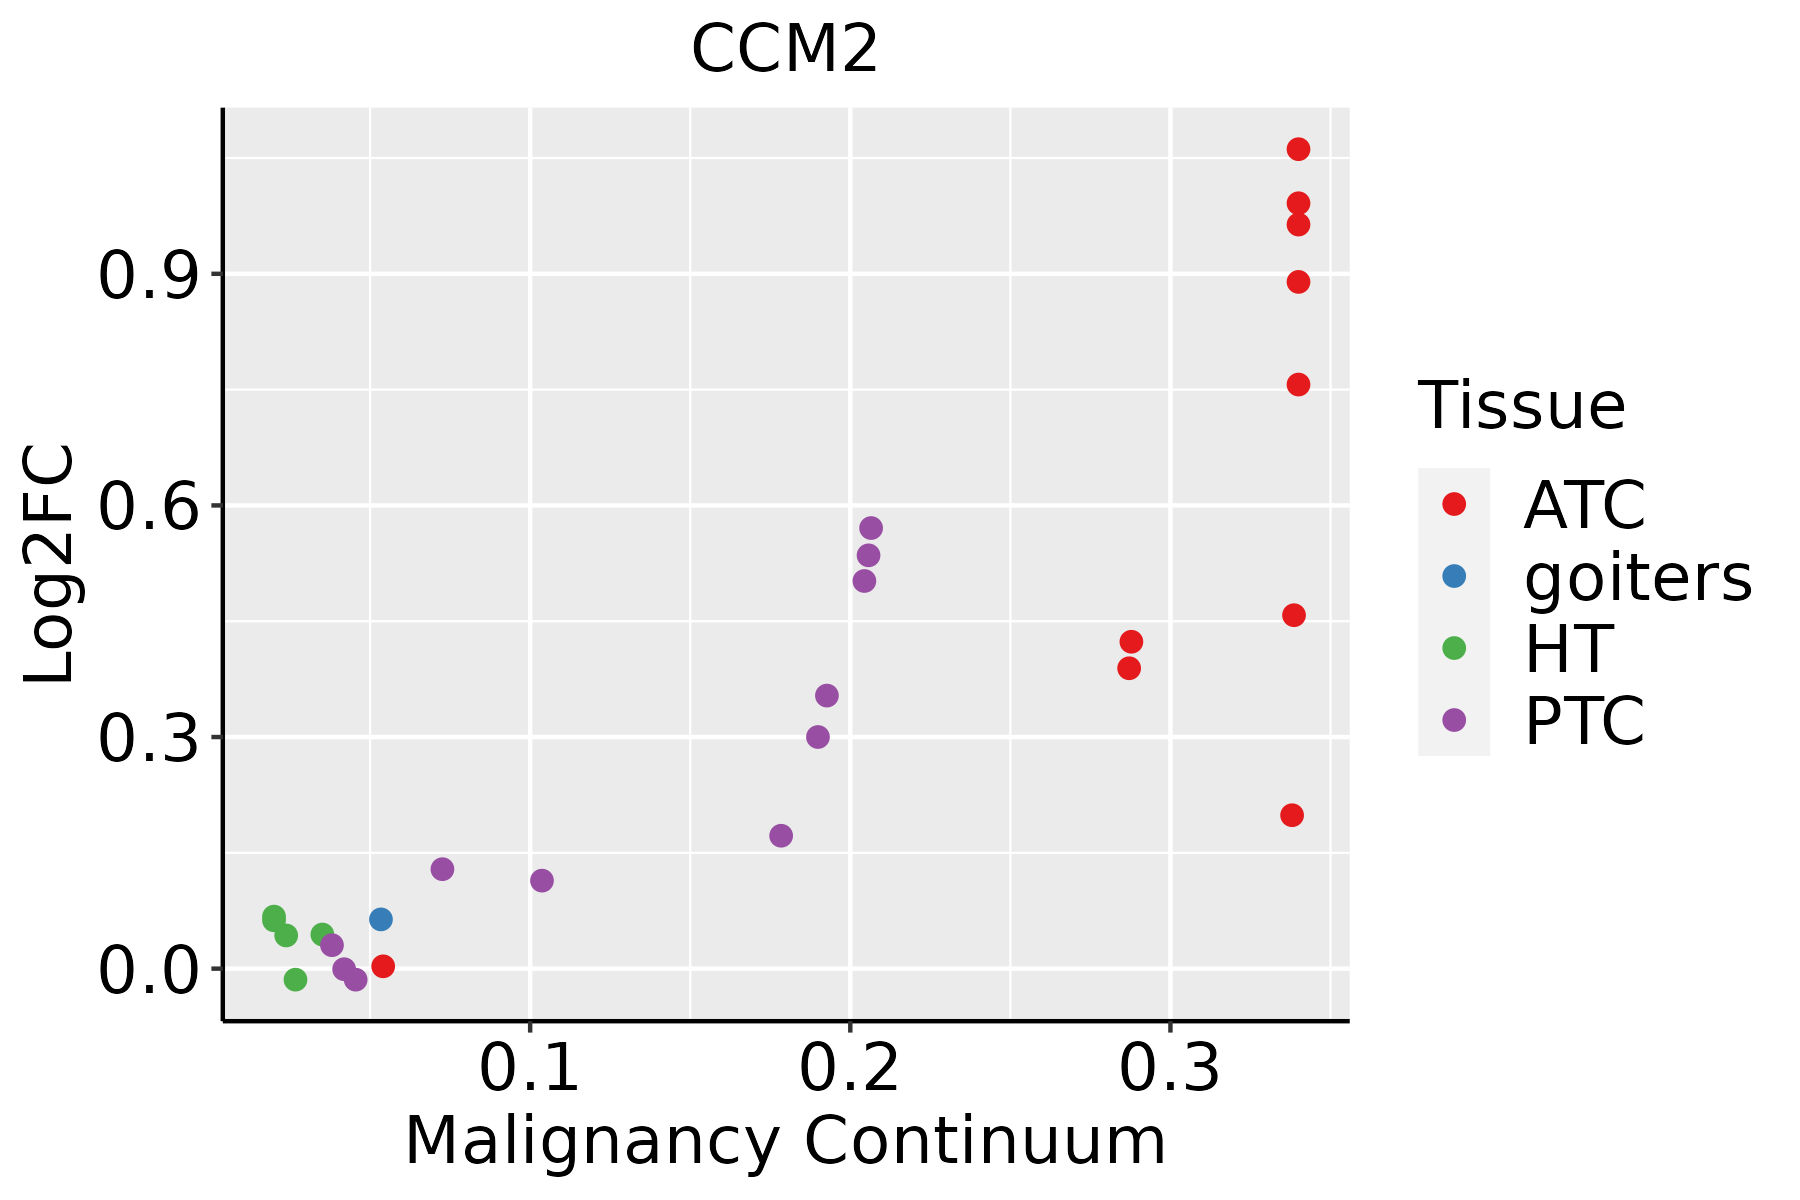 | ATC: Anaplastic thyroid cancer |
| HT: Hashimoto's thyroiditis | ||
| PTC: Papillary thyroid cancer |
| ∗log2FC in expression of this searched gene in stem-like cells from each diseased tissue sample relative to stem-like cells in normal samples in each tissue plotted against the malignancy continuum. Samples are colored based on if they are from different disease stage. |
Top |
Malignant transformation related pathway analysis |
| Find out the enriched GO biological processes and KEGG pathways involved in transition from healthy to precancer to cancer |
| Tissue | Disease Stage | Enriched GO biological Processes |
| Colorectum | AD |  |
| Colorectum | SER |  |
| Colorectum | MSS |  |
| Colorectum | MSI-H |  |
| Colorectum | FAP |  |
| ∗Top 15 enriched GO BP terms are showed in the bar plot of each disease state in each tissue. Each row represents a significant GO biological process which is colored according to the -log10(p.adjust). |
| Page: 1 2 3 4 5 6 7 8 9 |
| GO ID | Tissue | Disease Stage | Description | Gene Ratio | Bg Ratio | pvalue | p.adjust | Count |
| GO:000170119 | Esophagus | ESCC | in utero embryonic development | 243/8552 | 367/18723 | 1.00e-15 | 6.86e-14 | 243 |
| GO:003109818 | Esophagus | ESCC | stress-activated protein kinase signaling cascade | 154/8552 | 247/18723 | 8.53e-08 | 1.44e-06 | 154 |
| GO:005140318 | Esophagus | ESCC | stress-activated MAPK cascade | 147/8552 | 239/18723 | 5.43e-07 | 7.18e-06 | 147 |
| GO:000206420 | Esophagus | ESCC | epithelial cell development | 136/8552 | 220/18723 | 9.50e-07 | 1.21e-05 | 136 |
| GO:006056210 | Esophagus | ESCC | epithelial tube morphogenesis | 187/8552 | 325/18723 | 9.95e-06 | 9.44e-05 | 187 |
| GO:000188510 | Esophagus | ESCC | endothelial cell development | 44/8552 | 64/18723 | 1.59e-04 | 1.05e-03 | 44 |
| GO:00072299 | Esophagus | ESCC | integrin-mediated signaling pathway | 67/8552 | 107/18723 | 3.03e-04 | 1.81e-03 | 67 |
| GO:00352647 | Esophagus | ESCC | multicellular organism growth | 80/8552 | 132/18723 | 3.84e-04 | 2.22e-03 | 80 |
| GO:004521620 | Esophagus | ESCC | cell-cell junction organization | 114/8552 | 200/18723 | 8.04e-04 | 4.16e-03 | 114 |
| GO:004544610 | Esophagus | ESCC | endothelial cell differentiation | 67/8552 | 118/18723 | 9.86e-03 | 3.40e-02 | 67 |
| GO:000315818 | Esophagus | ESCC | endothelium development | 76/8552 | 136/18723 | 1.05e-02 | 3.59e-02 | 76 |
| GO:00514036 | Liver | NAFLD | stress-activated MAPK cascade | 47/1882 | 239/18723 | 5.26e-06 | 1.93e-04 | 47 |
| GO:00310986 | Liver | NAFLD | stress-activated protein kinase signaling cascade | 48/1882 | 247/18723 | 5.89e-06 | 2.07e-04 | 48 |
| GO:00020647 | Liver | NAFLD | epithelial cell development | 41/1882 | 220/18723 | 7.39e-05 | 1.53e-03 | 41 |
| GO:00352643 | Liver | NAFLD | multicellular organism growth | 27/1882 | 132/18723 | 2.57e-04 | 4.19e-03 | 27 |
| GO:00072293 | Liver | NAFLD | integrin-mediated signaling pathway | 21/1882 | 107/18723 | 2.05e-03 | 2.03e-02 | 21 |
| GO:00452167 | Liver | NAFLD | cell-cell junction organization | 32/1882 | 200/18723 | 5.53e-03 | 4.23e-02 | 32 |
| GO:00017015 | Liver | Cirrhotic | in utero embryonic development | 134/4634 | 367/18723 | 2.78e-07 | 6.86e-06 | 134 |
| GO:000722911 | Liver | Cirrhotic | integrin-mediated signaling pathway | 46/4634 | 107/18723 | 2.66e-05 | 3.42e-04 | 46 |
| GO:000206412 | Liver | Cirrhotic | epithelial cell development | 80/4634 | 220/18723 | 7.63e-05 | 8.44e-04 | 80 |
| Page: 1 2 3 4 5 |
| Pathway ID | Tissue | Disease Stage | Description | Gene Ratio | Bg Ratio | pvalue | p.adjust | qvalue | Count |
| hsa0452030 | Esophagus | ESCC | Adherens junction | 69/4205 | 93/8465 | 1.08e-06 | 6.83e-06 | 3.50e-06 | 69 |
| hsa04520114 | Esophagus | ESCC | Adherens junction | 69/4205 | 93/8465 | 1.08e-06 | 6.83e-06 | 3.50e-06 | 69 |
| hsa0452014 | Liver | NAFLD | Adherens junction | 37/1043 | 93/8465 | 1.50e-11 | 1.64e-09 | 1.32e-09 | 37 |
| hsa0452015 | Liver | NAFLD | Adherens junction | 37/1043 | 93/8465 | 1.50e-11 | 1.64e-09 | 1.32e-09 | 37 |
| hsa0452022 | Liver | Cirrhotic | Adherens junction | 52/2530 | 93/8465 | 1.36e-07 | 1.97e-06 | 1.21e-06 | 52 |
| hsa0452032 | Liver | Cirrhotic | Adherens junction | 52/2530 | 93/8465 | 1.36e-07 | 1.97e-06 | 1.21e-06 | 52 |
| hsa0452042 | Liver | HCC | Adherens junction | 68/4020 | 93/8465 | 3.99e-07 | 4.46e-06 | 2.48e-06 | 68 |
| hsa0452052 | Liver | HCC | Adherens junction | 68/4020 | 93/8465 | 3.99e-07 | 4.46e-06 | 2.48e-06 | 68 |
| hsa0452029 | Oral cavity | OSCC | Adherens junction | 62/3704 | 93/8465 | 6.34e-06 | 3.12e-05 | 1.59e-05 | 62 |
| hsa04520113 | Oral cavity | OSCC | Adherens junction | 62/3704 | 93/8465 | 6.34e-06 | 3.12e-05 | 1.59e-05 | 62 |
| Page: 1 |
Top |
Cell-cell communication analysis |
| Identification of potential cell-cell interactions between two cell types and their ligand-receptor pairs for different disease states |
| Ligand | Receptor | LRpair | Pathway | Tissue | Disease Stage |
| Page: 1 |
Top |
Single-cell gene regulatory network inference analysis |
| Find out the significant the regulons (TFs) and the target genes of each regulon across cell types for different disease states |
| TF | Cell Type | Tissue | Disease Stage | Target Gene | RSS | Regulon Activity |
| ∗The dot plots of a searched regulon are shown for all cell subpopulations in each disease state of each tissue based on the regulon specific score inferred using pySCENIC and by calculating the average expression. |
| Page: 1 |
Top |
Somatic mutation of malignant transformation related genes |
| Annotation of somatic variants for genes involved in malignant transformation |
| Hugo Symbol | Variant Class | Variant Classification | dbSNP RS | HGVSc | HGVSp | HGVSp Short | SWISSPROT | BIOTYPE | SIFT | PolyPhen | Tumor Sample Barcode | Tissue | Histology | Sex | Age | Stage | Therapy Types | Drugs | Outcome |
| CCM2 | SNV | Missense_Mutation | c.683N>T | p.Glu228Val | p.E228V | Q9BSQ5 | protein_coding | deleterious(0) | probably_damaging(0.998) | TCGA-A8-A08H-01 | Breast | breast invasive carcinoma | Female | >=65 | I/II | Unknown | Unknown | SD | |
| CCM2 | SNV | Missense_Mutation | c.664N>A | p.Glu222Lys | p.E222K | Q9BSQ5 | protein_coding | tolerated(0.07) | benign(0.275) | TCGA-C8-A26Y-01 | Breast | breast invasive carcinoma | Female | >=65 | I/II | Unknown | Unknown | SD | |
| CCM2 | SNV | Missense_Mutation | rs372739455 | c.983N>A | p.Arg328His | p.R328H | Q9BSQ5 | protein_coding | deleterious(0) | benign(0.343) | TCGA-E2-A1II-01 | Breast | breast invasive carcinoma | Female | <65 | I/II | Chemotherapy | doxorubicin | SD |
| CCM2 | deletion | Frame_Shift_Del | novel | c.109delN | p.Pro37HisfsTer7 | p.P37Hfs*7 | Q9BSQ5 | protein_coding | TCGA-D8-A27V-01 | Breast | breast invasive carcinoma | Female | <65 | I/II | Hormone Therapy | tamoxiphen | SD | ||
| CCM2 | deletion | Frame_Shift_Del | novel | c.689delN | p.Cys231AlafsTer4 | p.C231Afs*4 | Q9BSQ5 | protein_coding | TCGA-D8-A27V-01 | Breast | breast invasive carcinoma | Female | <65 | I/II | Hormone Therapy | tamoxiphen | SD | ||
| CCM2 | insertion | Frame_Shift_Ins | novel | c.1290_1291insTCTCTCA | p.Asp431SerfsTer4 | p.D431Sfs*4 | Q9BSQ5 | protein_coding | TCGA-DS-A1OB-01 | Cervix | cervical & endocervical cancer | Female | <65 | I/II | Chemotherapy | carboplatin | PD | ||
| CCM2 | SNV | Missense_Mutation | rs139533504 | c.487N>A | p.Val163Ile | p.V163I | Q9BSQ5 | protein_coding | tolerated(0.08) | possibly_damaging(0.502) | TCGA-A6-6649-01 | Colorectum | colon adenocarcinoma | Male | >=65 | III/IV | Chemotherapy | fluorouracil | SD |
| CCM2 | SNV | Missense_Mutation | rs750771937 | c.284N>T | p.Thr95Met | p.T95M | Q9BSQ5 | protein_coding | deleterious(0.05) | benign(0.031) | TCGA-AA-3864-01 | Colorectum | colon adenocarcinoma | Male | >=65 | I/II | Unknown | Unknown | SD |
| CCM2 | SNV | Missense_Mutation | novel | c.916N>G | p.Thr306Ala | p.T306A | Q9BSQ5 | protein_coding | tolerated(0.7) | benign(0.024) | TCGA-AA-A00N-01 | Colorectum | colon adenocarcinoma | Male | >=65 | I/II | Unknown | Unknown | PD |
| CCM2 | SNV | Missense_Mutation | rs781634033 | c.217N>T | p.Arg73Cys | p.R73C | Q9BSQ5 | protein_coding | deleterious(0.01) | probably_damaging(0.938) | TCGA-AD-5900-01 | Colorectum | colon adenocarcinoma | Male | >=65 | I/II | Unknown | Unknown | SD |
| Page: 1 2 3 4 5 |
Top |
Related drugs of malignant transformation related genes |
| Identification of chemicals and drugs interact with genes involved in malignant transfromation |
| (DGIdb 4.0) |
| Entrez ID | Symbol | Category | Interaction Types | Drug Claim Name | Drug Name | PMIDs |
| Page: 1 |

Copyright 2023-Present -The University of Texas Health Science Center at Houston |