
|
|||||
|
 | |
| |
| |
| |
| |
| |
|
Gene: CCL5 |
Gene summary for CCL5 |
| Gene information | Species | Human | Gene symbol | CCL5 | Gene ID | 6352 |
| Gene name | C-C motif chemokine ligand 5 | |
| Gene Alias | D17S136E | |
| Cytomap | 17q12 | |
| Gene Type | protein-coding | GO ID | GO:0000165 | UniProtAcc | D0EI67 |
Top |
Malignant transformation analysis |
| Identification of the aberrant gene expression in precancerous and cancerous lesions by comparing the gene expression of stem-like cells in diseased tissues with normal stem cells |
| Entrez ID | Symbol | Replicates | Species | Organ | Tissue | Adj P-value | Log2FC | Malignancy |
| 6352 | CCL5 | GSM4909285 | Human | Breast | IDC | 1.48e-02 | -1.50e-01 | 0.21 |
| 6352 | CCL5 | GSM4909286 | Human | Breast | IDC | 7.01e-03 | -1.56e-01 | 0.1081 |
| 6352 | CCL5 | GSM4909312 | Human | Breast | IDC | 1.48e-02 | -1.52e-01 | 0.1552 |
| 6352 | CCL5 | GSM4909317 | Human | Breast | IDC | 2.13e-05 | 3.48e-01 | 0.1355 |
| 6352 | CCL5 | brca1 | Human | Breast | Precancer | 1.48e-02 | -1.55e-01 | -0.0338 |
| 6352 | CCL5 | P1 | Human | Breast | IDC | 7.28e-06 | 5.34e-01 | 0.1527 |
| 6352 | CCL5 | P2 | Human | Breast | IDC | 3.44e-08 | 6.05e-01 | 0.21 |
| 6352 | CCL5 | LZE4T | Human | Esophagus | ESCC | 1.57e-08 | 1.74e+00 | 0.0811 |
| 6352 | CCL5 | LZE6T | Human | Esophagus | ESCC | 9.51e-21 | 3.19e+00 | 0.0845 |
| 6352 | CCL5 | P12T-E | Human | Esophagus | ESCC | 3.03e-06 | 1.43e-02 | 0.1122 |
| 6352 | CCL5 | P23T-E | Human | Esophagus | ESCC | 8.25e-05 | 5.70e-02 | 0.108 |
| 6352 | CCL5 | P24T-E | Human | Esophagus | ESCC | 4.46e-03 | 1.22e+00 | 0.1287 |
| 6352 | CCL5 | P52T-E | Human | Esophagus | ESCC | 1.28e-60 | 4.35e+00 | 0.1555 |
| 6352 | CCL5 | P130T-E | Human | Esophagus | ESCC | 2.18e-09 | 2.12e+00 | 0.1676 |
| 6352 | CCL5 | S43 | Human | Liver | Cirrhotic | 3.17e-21 | -6.82e-01 | -0.0187 |
| 6352 | CCL5 | HCC1_Meng | Human | Liver | HCC | 8.21e-17 | -6.49e-01 | 0.0246 |
| 6352 | CCL5 | HCC2_Meng | Human | Liver | HCC | 1.55e-15 | -5.63e-01 | 0.0107 |
| 6352 | CCL5 | cirrhotic1 | Human | Liver | Cirrhotic | 5.32e-14 | -5.66e-01 | 0.0202 |
| 6352 | CCL5 | cirrhotic2 | Human | Liver | Cirrhotic | 5.32e-22 | -2.20e-01 | 0.0201 |
| 6352 | CCL5 | cirrhotic3 | Human | Liver | Cirrhotic | 1.92e-08 | -5.21e-01 | 0.0215 |
| Page: 1 2 3 |
| Tissue | Expression Dynamics | Abbreviation |
| Breast | 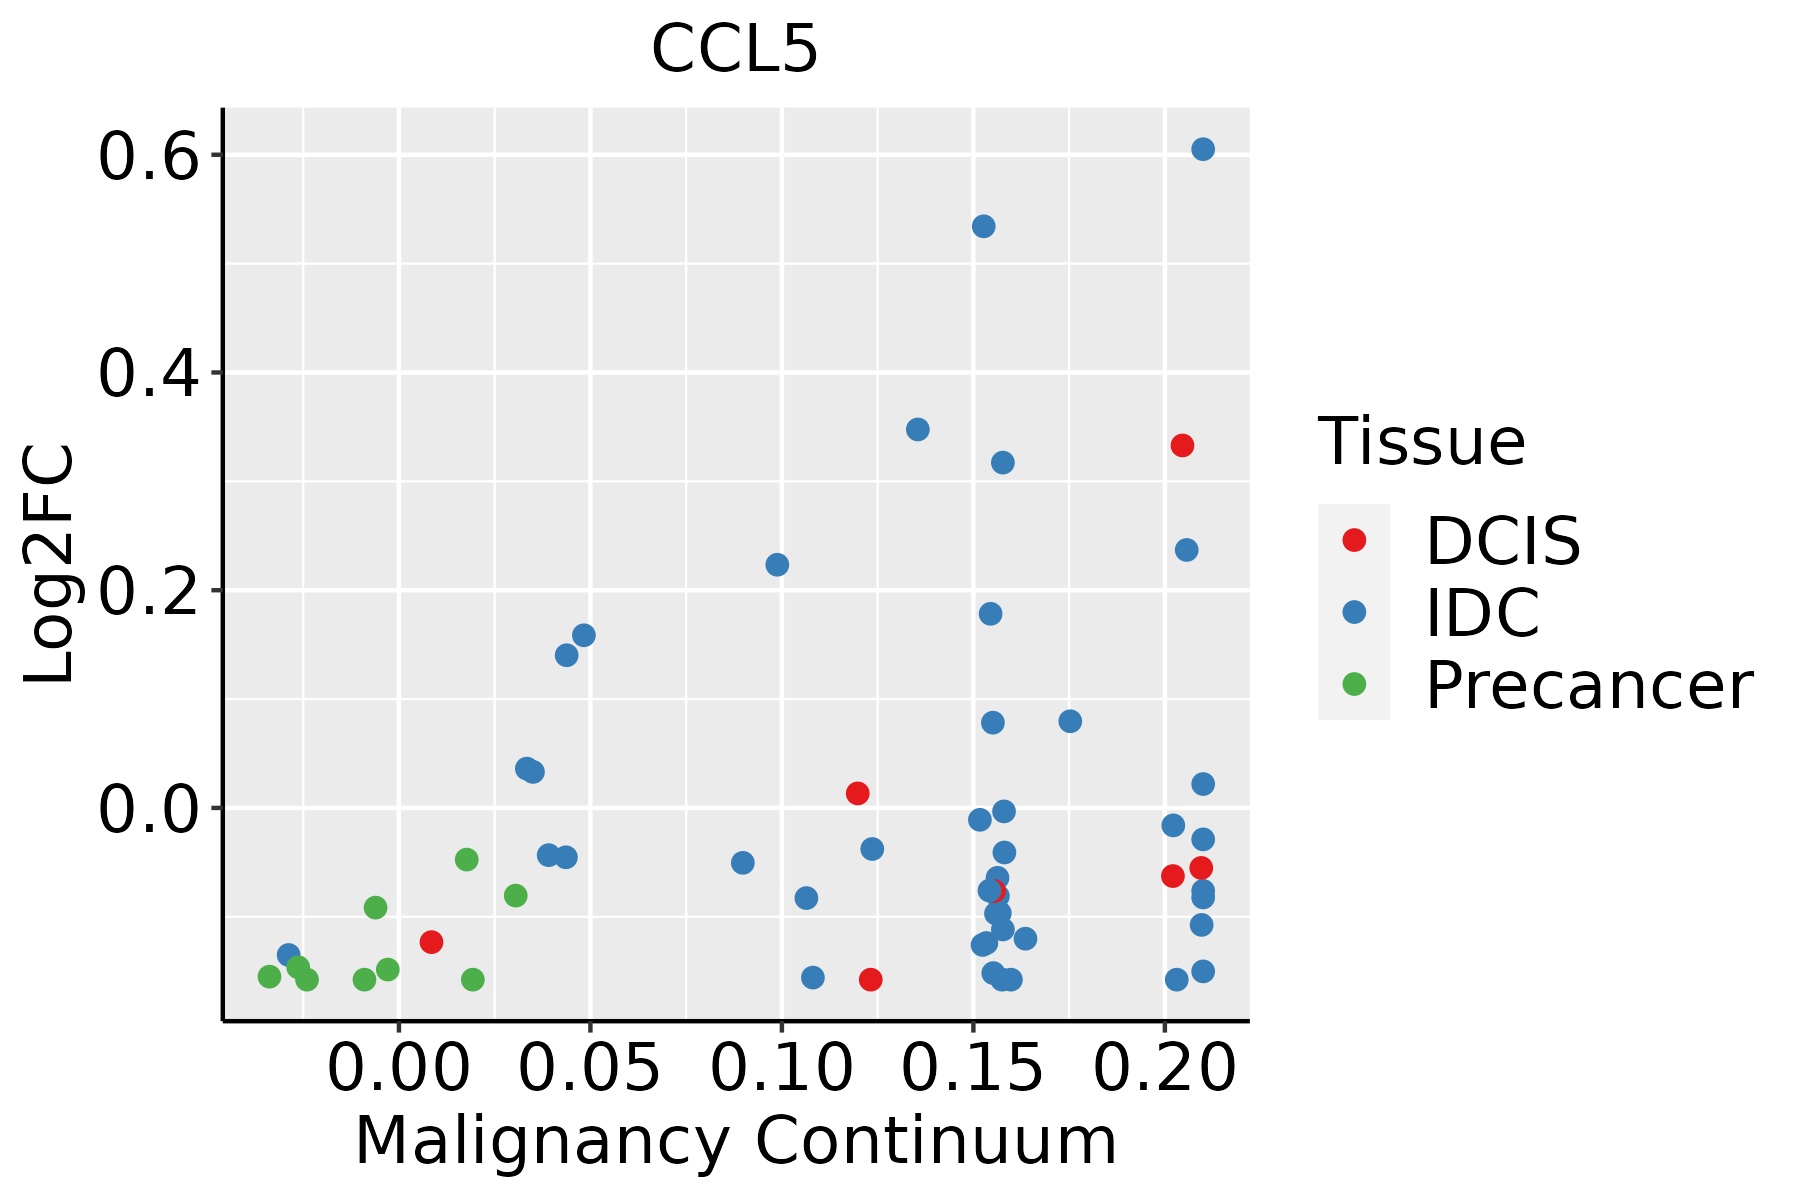 | IDC: Invasive ductal carcinoma |
| DCIS: Ductal carcinoma in situ | ||
| Precancer(BRCA1-mut): Precancerous lesion from BRCA1 mutation carriers | ||
| Esophagus |  | ESCC: Esophageal squamous cell carcinoma |
| HGIN: High-grade intraepithelial neoplasias | ||
| LGIN: Low-grade intraepithelial neoplasias | ||
| Liver | 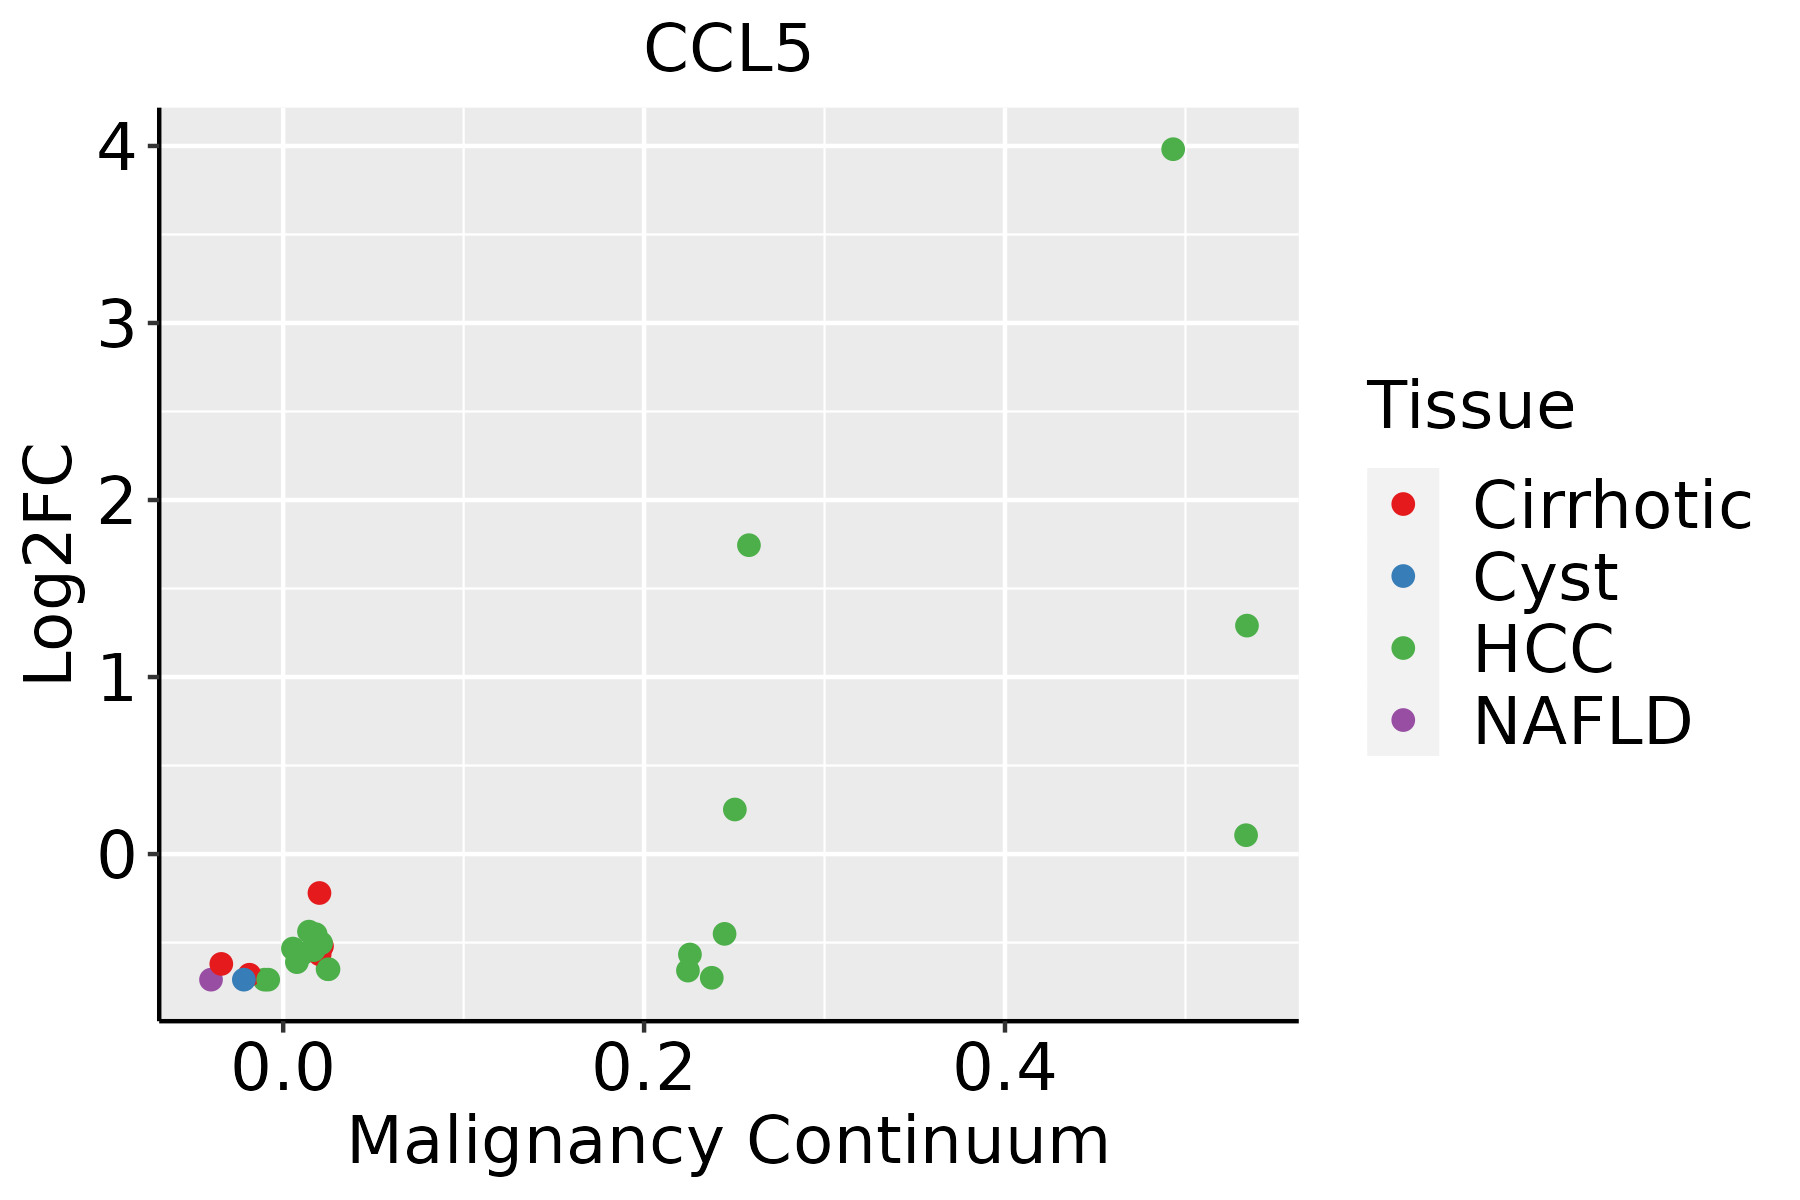 | HCC: Hepatocellular carcinoma |
| NAFLD: Non-alcoholic fatty liver disease | ||
| Oral Cavity | 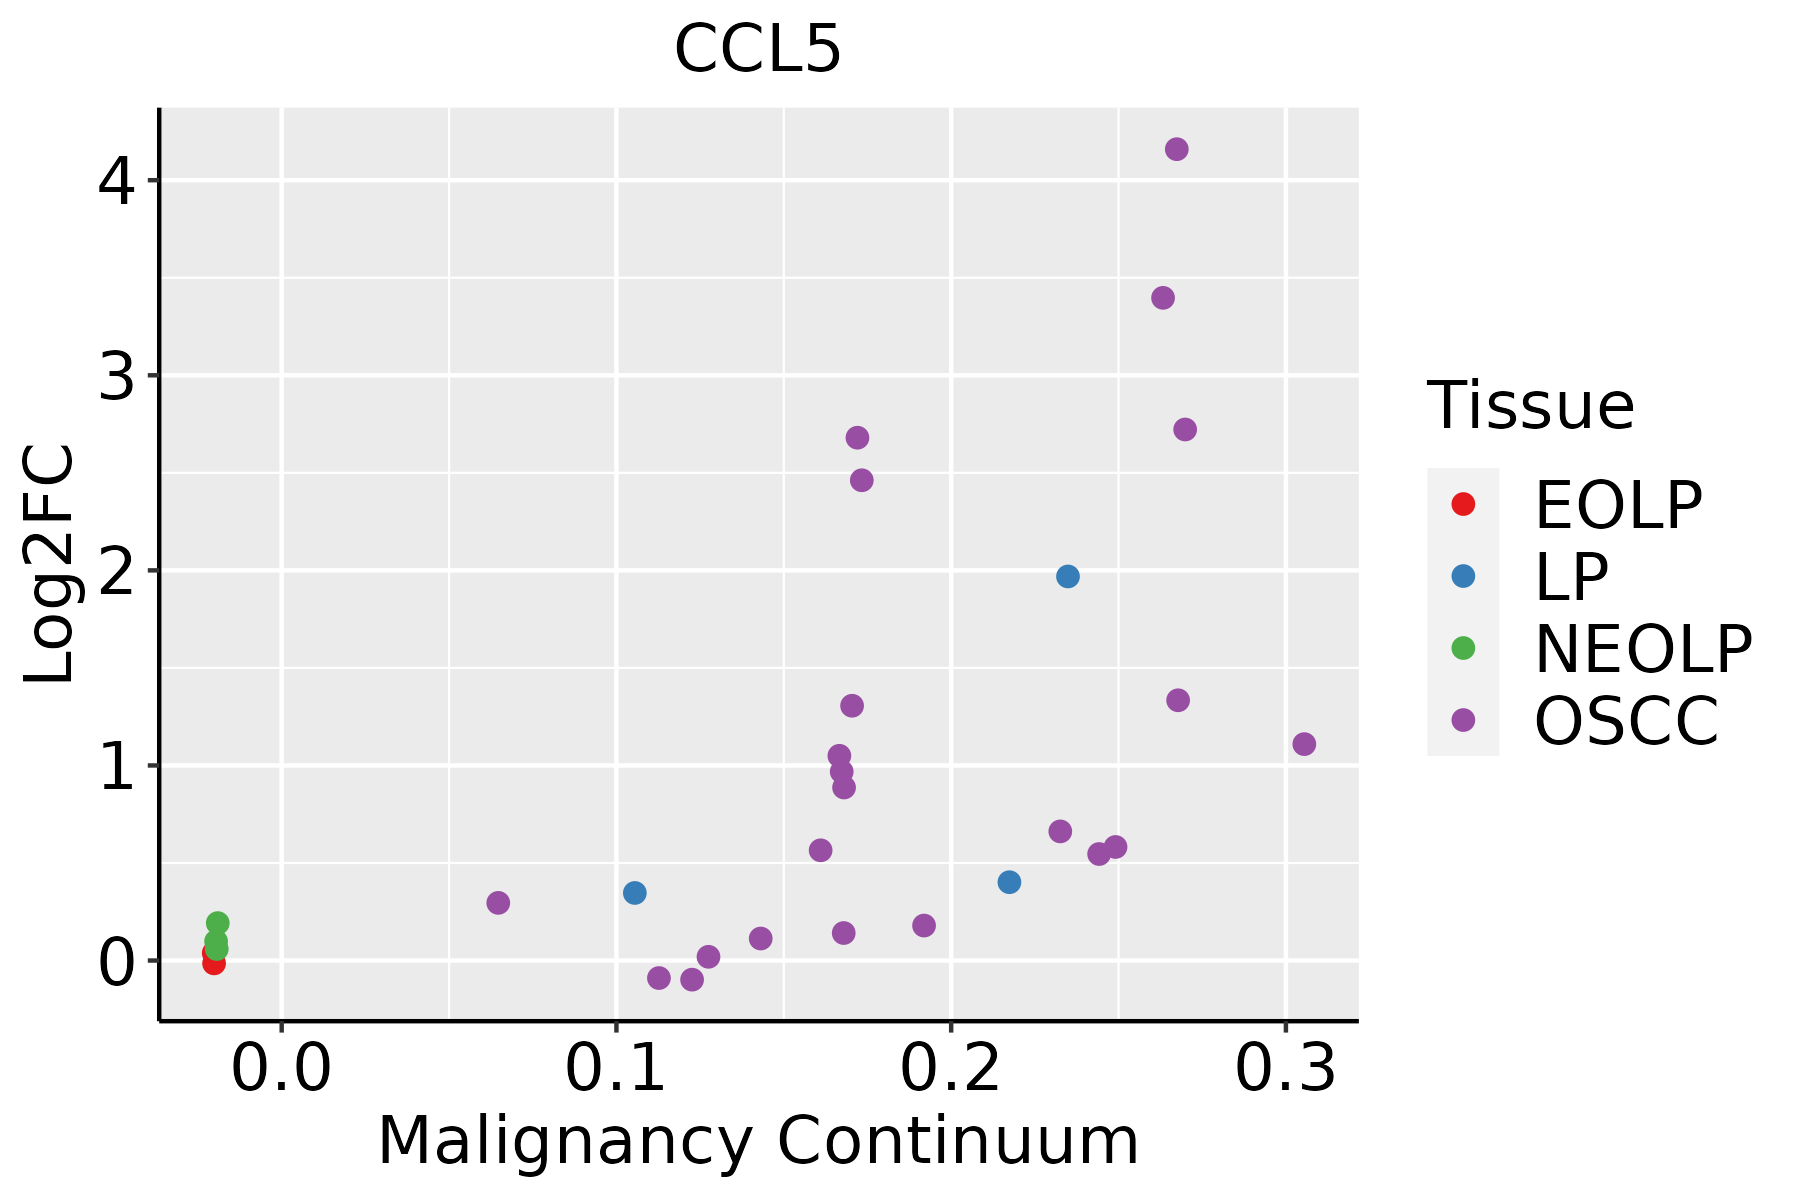 | EOLP: Erosive Oral lichen planus |
| LP: leukoplakia | ||
| NEOLP: Non-erosive oral lichen planus | ||
| OSCC: Oral squamous cell carcinoma | ||
| Thyroid |  | ATC: Anaplastic thyroid cancer |
| HT: Hashimoto's thyroiditis | ||
| PTC: Papillary thyroid cancer |
| ∗log2FC in expression of this searched gene in stem-like cells from each diseased tissue sample relative to stem-like cells in normal samples in each tissue plotted against the malignancy continuum. Samples are colored based on if they are from different disease stage. |
Top |
Malignant transformation related pathway analysis |
| Find out the enriched GO biological processes and KEGG pathways involved in transition from healthy to precancer to cancer |
| Tissue | Disease Stage | Enriched GO biological Processes |
| Colorectum | AD |  |
| Colorectum | SER |  |
| Colorectum | MSS |  |
| Colorectum | MSI-H |  |
| Colorectum | FAP |  |
| ∗Top 15 enriched GO BP terms are showed in the bar plot of each disease state in each tissue. Each row represents a significant GO biological process which is colored according to the -log10(p.adjust). |
| Page: 1 2 3 4 5 6 7 8 9 |
| GO ID | Tissue | Disease Stage | Description | Gene Ratio | Bg Ratio | pvalue | p.adjust | Count |
| GO:00064138 | Breast | Precancer | translational initiation | 30/1080 | 118/18723 | 3.23e-12 | 5.58e-10 | 30 |
| GO:00064179 | Breast | Precancer | regulation of translation | 67/1080 | 468/18723 | 4.71e-12 | 7.64e-10 | 67 |
| GO:00457279 | Breast | Precancer | positive regulation of translation | 32/1080 | 136/18723 | 5.89e-12 | 9.27e-10 | 32 |
| GO:00342509 | Breast | Precancer | positive regulation of cellular amide metabolic process | 33/1080 | 162/18723 | 1.72e-10 | 1.77e-08 | 33 |
| GO:00160329 | Breast | Precancer | viral process | 58/1080 | 415/18723 | 3.42e-10 | 3.16e-08 | 58 |
| GO:00190589 | Breast | Precancer | viral life cycle | 47/1080 | 317/18723 | 2.42e-09 | 1.99e-07 | 47 |
| GO:00709979 | Breast | Precancer | neuron death | 50/1080 | 361/18723 | 7.75e-09 | 5.70e-07 | 50 |
| GO:00444039 | Breast | Precancer | biological process involved in symbiotic interaction | 42/1080 | 290/18723 | 3.40e-08 | 2.11e-06 | 42 |
| GO:00064466 | Breast | Precancer | regulation of translational initiation | 19/1080 | 79/18723 | 7.99e-08 | 4.60e-06 | 19 |
| GO:00975297 | Breast | Precancer | myeloid leukocyte migration | 34/1080 | 220/18723 | 1.42e-07 | 7.82e-06 | 34 |
| GO:00509006 | Breast | Precancer | leukocyte migration | 47/1080 | 369/18723 | 2.82e-07 | 1.39e-05 | 47 |
| GO:00305956 | Breast | Precancer | leukocyte chemotaxis | 34/1080 | 230/18723 | 4.16e-07 | 1.89e-05 | 34 |
| GO:00457859 | Breast | Precancer | positive regulation of cell adhesion | 52/1080 | 437/18723 | 5.74e-07 | 2.49e-05 | 52 |
| GO:00603266 | Breast | Precancer | cell chemotaxis | 41/1080 | 310/18723 | 5.99e-07 | 2.55e-05 | 41 |
| GO:00716217 | Breast | Precancer | granulocyte chemotaxis | 23/1080 | 125/18723 | 6.73e-07 | 2.77e-05 | 23 |
| GO:00507929 | Breast | Precancer | regulation of viral process | 27/1080 | 164/18723 | 7.59e-07 | 3.05e-05 | 27 |
| GO:19012149 | Breast | Precancer | regulation of neuron death | 41/1080 | 319/18723 | 1.27e-06 | 4.80e-05 | 41 |
| GO:00341099 | Breast | Precancer | homotypic cell-cell adhesion | 18/1080 | 90/18723 | 3.15e-06 | 1.03e-04 | 18 |
| GO:00975307 | Breast | Precancer | granulocyte migration | 24/1080 | 148/18723 | 4.04e-06 | 1.26e-04 | 24 |
| GO:00190799 | Breast | Precancer | viral genome replication | 22/1080 | 131/18723 | 5.63e-06 | 1.66e-04 | 22 |
| Page: 1 2 3 4 5 6 7 8 9 10 11 12 13 14 15 16 17 18 19 20 21 22 23 24 25 26 27 28 29 30 31 32 33 34 35 36 |
| Pathway ID | Tissue | Disease Stage | Description | Gene Ratio | Bg Ratio | pvalue | p.adjust | qvalue | Count |
| hsa0502016 | Breast | Precancer | Prion disease | 95/684 | 273/8465 | 1.39e-37 | 1.46e-35 | 1.12e-35 | 95 |
| hsa0513118 | Breast | Precancer | Shigellosis | 44/684 | 247/8465 | 3.91e-07 | 6.86e-06 | 5.26e-06 | 44 |
| hsa0541718 | Breast | Precancer | Lipid and atherosclerosis | 37/684 | 215/8465 | 7.64e-06 | 9.29e-05 | 7.12e-05 | 37 |
| hsa0532312 | Breast | Precancer | Rheumatoid arthritis | 19/684 | 93/8465 | 1.30e-04 | 1.14e-03 | 8.73e-04 | 19 |
| hsa0516316 | Breast | Precancer | Human cytomegalovirus infection | 32/684 | 225/8465 | 1.13e-03 | 7.57e-03 | 5.80e-03 | 32 |
| hsa051206 | Breast | Precancer | Epithelial cell signaling in Helicobacter pylori infection | 14/684 | 70/8465 | 1.21e-03 | 7.99e-03 | 6.12e-03 | 14 |
| hsa0502017 | Breast | Precancer | Prion disease | 95/684 | 273/8465 | 1.39e-37 | 1.46e-35 | 1.12e-35 | 95 |
| hsa0513119 | Breast | Precancer | Shigellosis | 44/684 | 247/8465 | 3.91e-07 | 6.86e-06 | 5.26e-06 | 44 |
| hsa0541719 | Breast | Precancer | Lipid and atherosclerosis | 37/684 | 215/8465 | 7.64e-06 | 9.29e-05 | 7.12e-05 | 37 |
| hsa0532313 | Breast | Precancer | Rheumatoid arthritis | 19/684 | 93/8465 | 1.30e-04 | 1.14e-03 | 8.73e-04 | 19 |
| hsa0516317 | Breast | Precancer | Human cytomegalovirus infection | 32/684 | 225/8465 | 1.13e-03 | 7.57e-03 | 5.80e-03 | 32 |
| hsa0512013 | Breast | Precancer | Epithelial cell signaling in Helicobacter pylori infection | 14/684 | 70/8465 | 1.21e-03 | 7.99e-03 | 6.12e-03 | 14 |
| hsa0502023 | Breast | IDC | Prion disease | 102/867 | 273/8465 | 3.70e-34 | 4.01e-32 | 3.00e-32 | 102 |
| hsa0513124 | Breast | IDC | Shigellosis | 47/867 | 247/8465 | 1.78e-05 | 2.00e-04 | 1.49e-04 | 47 |
| hsa0532321 | Breast | IDC | Rheumatoid arthritis | 21/867 | 93/8465 | 3.69e-04 | 3.15e-03 | 2.36e-03 | 21 |
| hsa0516324 | Breast | IDC | Human cytomegalovirus infection | 39/867 | 225/8465 | 6.66e-04 | 5.41e-03 | 4.05e-03 | 39 |
| hsa0512022 | Breast | IDC | Epithelial cell signaling in Helicobacter pylori infection | 16/867 | 70/8465 | 1.56e-03 | 1.13e-02 | 8.42e-03 | 16 |
| hsa0541724 | Breast | IDC | Lipid and atherosclerosis | 35/867 | 215/8465 | 3.67e-03 | 2.29e-02 | 1.71e-02 | 35 |
| hsa0502033 | Breast | IDC | Prion disease | 102/867 | 273/8465 | 3.70e-34 | 4.01e-32 | 3.00e-32 | 102 |
| hsa0513134 | Breast | IDC | Shigellosis | 47/867 | 247/8465 | 1.78e-05 | 2.00e-04 | 1.49e-04 | 47 |
| Page: 1 2 3 4 5 6 |
Top |
Cell-cell communication analysis |
| Identification of potential cell-cell interactions between two cell types and their ligand-receptor pairs for different disease states |
| Ligand | Receptor | LRpair | Pathway | Tissue | Disease Stage |
| CCL5 | CCR5 | CCL5_CCR5 | CCL | Breast | ADJ |
| CCL5 | CCR1 | CCL5_CCR1 | CCL | Breast | DCIS |
| CCL5 | ACKR1 | CCL5_ACKR1 | CCL | Breast | DCIS |
| CCL5 | ACKR1 | CCL5_ACKR1 | CCL | Breast | Healthy |
| CCL5 | CCR1 | CCL5_CCR1 | CCL | Breast | IDC |
| CCL5 | ACKR1 | CCL5_ACKR1 | CCL | Breast | IDC |
| CCL5 | ACKR1 | CCL5_ACKR1 | CCL | Breast | Precancer |
| CCL5 | CCR1 | CCL5_CCR1 | CCL | Cervix | ADJ |
| CCL5 | CCR4 | CCL5_CCR4 | CCL | Cervix | ADJ |
| CCL5 | CCR5 | CCL5_CCR5 | CCL | Cervix | ADJ |
| CCL5 | ACKR1 | CCL5_ACKR1 | CCL | Cervix | ADJ |
| CCL5 | CCR1 | CCL5_CCR1 | CCL | Cervix | CC |
| CCL5 | ACKR1 | CCL5_ACKR1 | CCL | Cervix | CC |
| CCL5 | CCR1 | CCL5_CCR1 | CCL | Cervix | Healthy |
| CCL5 | CCR1 | CCL5_CCR1 | CCL | Cervix | Precancer |
| CCL5 | ACKR1 | CCL5_ACKR1 | CCL | Cervix | Precancer |
| CCL5 | CCR1 | CCL5_CCR1 | CCL | CRC | AD |
| CCL5 | ACKR1 | CCL5_ACKR1 | CCL | CRC | AD |
| CCL5 | ACKR1 | CCL5_ACKR1 | CCL | CRC | MSI-H |
| CCL5 | ACKR1 | CCL5_ACKR1 | CCL | CRC | MSS |
| Page: 1 2 3 4 |
Top |
Single-cell gene regulatory network inference analysis |
| Find out the significant the regulons (TFs) and the target genes of each regulon across cell types for different disease states |
| TF | Cell Type | Tissue | Disease Stage | Target Gene | RSS | Regulon Activity |
| ∗The dot plots of a searched regulon are shown for all cell subpopulations in each disease state of each tissue based on the regulon specific score inferred using pySCENIC and by calculating the average expression. |
| Page: 1 |
Top |
Somatic mutation of malignant transformation related genes |
| Annotation of somatic variants for genes involved in malignant transformation |
| Hugo Symbol | Variant Class | Variant Classification | dbSNP RS | HGVSc | HGVSp | HGVSp Short | SWISSPROT | BIOTYPE | SIFT | PolyPhen | Tumor Sample Barcode | Tissue | Histology | Sex | Age | Stage | Therapy Types | Drugs | Outcome |
| CCL5 | SNV | Missense_Mutation | novel | c.110N>G | p.Tyr37Cys | p.Y37C | P13501 | protein_coding | deleterious(0) | probably_damaging(0.979) | TCGA-A5-A0VP-01 | Endometrium | uterine corpus endometrioid carcinoma | Female | >=65 | I/II | Unknown | Unknown | SD |
| CCL5 | SNV | Missense_Mutation | novel | c.56N>T | p.Ala19Val | p.A19V | P13501 | protein_coding | tolerated(0.2) | benign(0) | TCGA-A5-A1OF-01 | Endometrium | uterine corpus endometrioid carcinoma | Female | <65 | I/II | Unknown | Unknown | SD |
| CCL5 | SNV | Missense_Mutation | rs779249457 | c.244N>T | p.Arg82Trp | p.R82W | P13501 | protein_coding | deleterious(0) | possibly_damaging(0.828) | TCGA-AP-A1E0-01 | Endometrium | uterine corpus endometrioid carcinoma | Female | <65 | III/IV | Chemotherapy | paclitaxel | SD |
| CCL5 | SNV | Missense_Mutation | novel | c.49N>A | p.Leu17Ile | p.L17I | P13501 | protein_coding | deleterious(0.04) | benign(0.142) | TCGA-AX-A0J1-01 | Endometrium | uterine corpus endometrioid carcinoma | Female | >=65 | I/II | Unknown | Unknown | SD |
| CCL5 | SNV | Missense_Mutation | novel | c.5N>G | p.Lys2Arg | p.K2R | P13501 | protein_coding | deleterious(0.04) | benign(0.005) | TCGA-DF-A2KN-01 | Endometrium | uterine corpus endometrioid carcinoma | Female | Unknown | I/II | Unknown | Unknown | SD |
| CCL5 | SNV | Missense_Mutation | rs571565063 | c.14N>T | p.Ala5Val | p.A5V | P13501 | protein_coding | tolerated(1) | benign(0.001) | TCGA-DF-A2KV-01 | Endometrium | uterine corpus endometrioid carcinoma | Female | <65 | I/II | Unknown | Unknown | SD |
| CCL5 | SNV | Missense_Mutation | novel | c.234G>C | p.Lys78Asn | p.K78N | P13501 | protein_coding | deleterious(0.05) | benign(0.057) | TCGA-21-1083-01 | Lung | lung squamous cell carcinoma | Male | >=65 | I/II | Unknown | Unknown | SD |
| CCL5 | SNV | Missense_Mutation | novel | c.62N>T | p.Ala21Val | p.A21V | P13501 | protein_coding | tolerated(0.83) | benign(0.007) | TCGA-BR-8487-01 | Stomach | stomach adenocarcinoma | Female | <65 | I/II | Unknown | Unknown | SD |
| CCL5 | SNV | Missense_Mutation | novel | c.240N>C | p.Trp80Cys | p.W80C | P13501 | protein_coding | deleterious(0) | probably_damaging(0.999) | TCGA-CD-5800-01 | Stomach | stomach adenocarcinoma | Female | <65 | I/II | Unknown | Unknown | SD |
| CCL5 | SNV | Missense_Mutation | novel | c.270N>T | p.Met90Ile | p.M90I | P13501 | protein_coding | deleterious(0.01) | benign(0.023) | TCGA-VQ-AA6J-01 | Stomach | stomach adenocarcinoma | Male | >=65 | III/IV | Unknown | Unknown | SD |
| Page: 1 |
Top |
Related drugs of malignant transformation related genes |
| Identification of chemicals and drugs interact with genes involved in malignant transfromation |
| (DGIdb 4.0) |
| Entrez ID | Symbol | Category | Interaction Types | Drug Claim Name | Drug Name | PMIDs |
| 6352 | CCL5 | CELL SURFACE, ENZYME, KINASE, DRUGGABLE GENOME | NI-0701 | |||
| 6352 | CCL5 | CELL SURFACE, ENZYME, KINASE, DRUGGABLE GENOME | FLUTICASONE PROPIONATE | 14556981 | ||
| 6352 | CCL5 | CELL SURFACE, ENZYME, KINASE, DRUGGABLE GENOME | OX40 LIGAND | 12161277 |
| Page: 1 |

Copyright 2023-Present -The University of Texas Health Science Center at Houston |