
|
|||||
|
 | |
| |
| |
| |
| |
| |
|
Gene: CCL4L2 |
Gene summary for CCL4L2 |
| Gene information | Species | Human | Gene symbol | CCL4L2 | Gene ID | 9560 |
| Gene name | C-C motif chemokine ligand 4 like 2 | |
| Gene Alias | AT744.2 | |
| Cytomap | 17q12 | |
| Gene Type | protein-coding | GO ID | NA | UniProtAcc | Q8NHW4 |
Top |
Malignant transformation analysis |
| Identification of the aberrant gene expression in precancerous and cancerous lesions by comparing the gene expression of stem-like cells in diseased tissues with normal stem cells |
| Entrez ID | Symbol | Replicates | Species | Organ | Tissue | Adj P-value | Log2FC | Malignancy |
| 9560 | CCL4L2 | C21 | Human | Oral cavity | OSCC | 1.05e-51 | 1.57e+00 | 0.2678 |
| 9560 | CCL4L2 | C30 | Human | Oral cavity | OSCC | 1.69e-49 | 1.72e+00 | 0.3055 |
| 9560 | CCL4L2 | C38 | Human | Oral cavity | OSCC | 1.16e-02 | 1.35e+00 | 0.172 |
| 9560 | CCL4L2 | C46 | Human | Oral cavity | OSCC | 5.19e-19 | 2.21e-01 | 0.1673 |
| 9560 | CCL4L2 | C51 | Human | Oral cavity | OSCC | 6.74e-04 | 1.60e-01 | 0.2674 |
| 9560 | CCL4L2 | C07 | Human | Oral cavity | OSCC | 1.88e-03 | 5.39e-01 | 0.2491 |
| 9560 | CCL4L2 | C09 | Human | Oral cavity | OSCC | 7.91e-12 | 1.27e-01 | 0.1431 |
| 9560 | CCL4L2 | LN22 | Human | Oral cavity | OSCC | 1.03e-04 | 5.12e-01 | 0.1733 |
| 9560 | CCL4L2 | LN46 | Human | Oral cavity | OSCC | 3.90e-08 | 2.89e-01 | 0.1666 |
| 9560 | CCL4L2 | SYSMH6 | Human | Oral cavity | OSCC | 6.61e-20 | 1.46e-01 | 0.1275 |
| 9560 | CCL4L2 | PTCwithHT_1 | Human | Thyroid | HT | 2.77e-26 | 1.51e+00 | 0.0238 |
| 9560 | CCL4L2 | PTCwithHT_6 | Human | Thyroid | HT | 1.78e-21 | 9.11e-01 | 0.02 |
| 9560 | CCL4L2 | PTCwithHT_8 | Human | Thyroid | HT | 6.49e-27 | 1.12e+00 | 0.0351 |
| 9560 | CCL4L2 | PTCwithoutHT_2 | Human | Thyroid | PTC | 5.62e-15 | 8.26e-01 | 0.0419 |
| 9560 | CCL4L2 | PTCwithoutHT_7 | Human | Thyroid | PTC | 3.58e-09 | 9.64e-01 | 0.0381 |
| Page: 1 |
| Tissue | Expression Dynamics | Abbreviation |
| Oral Cavity | 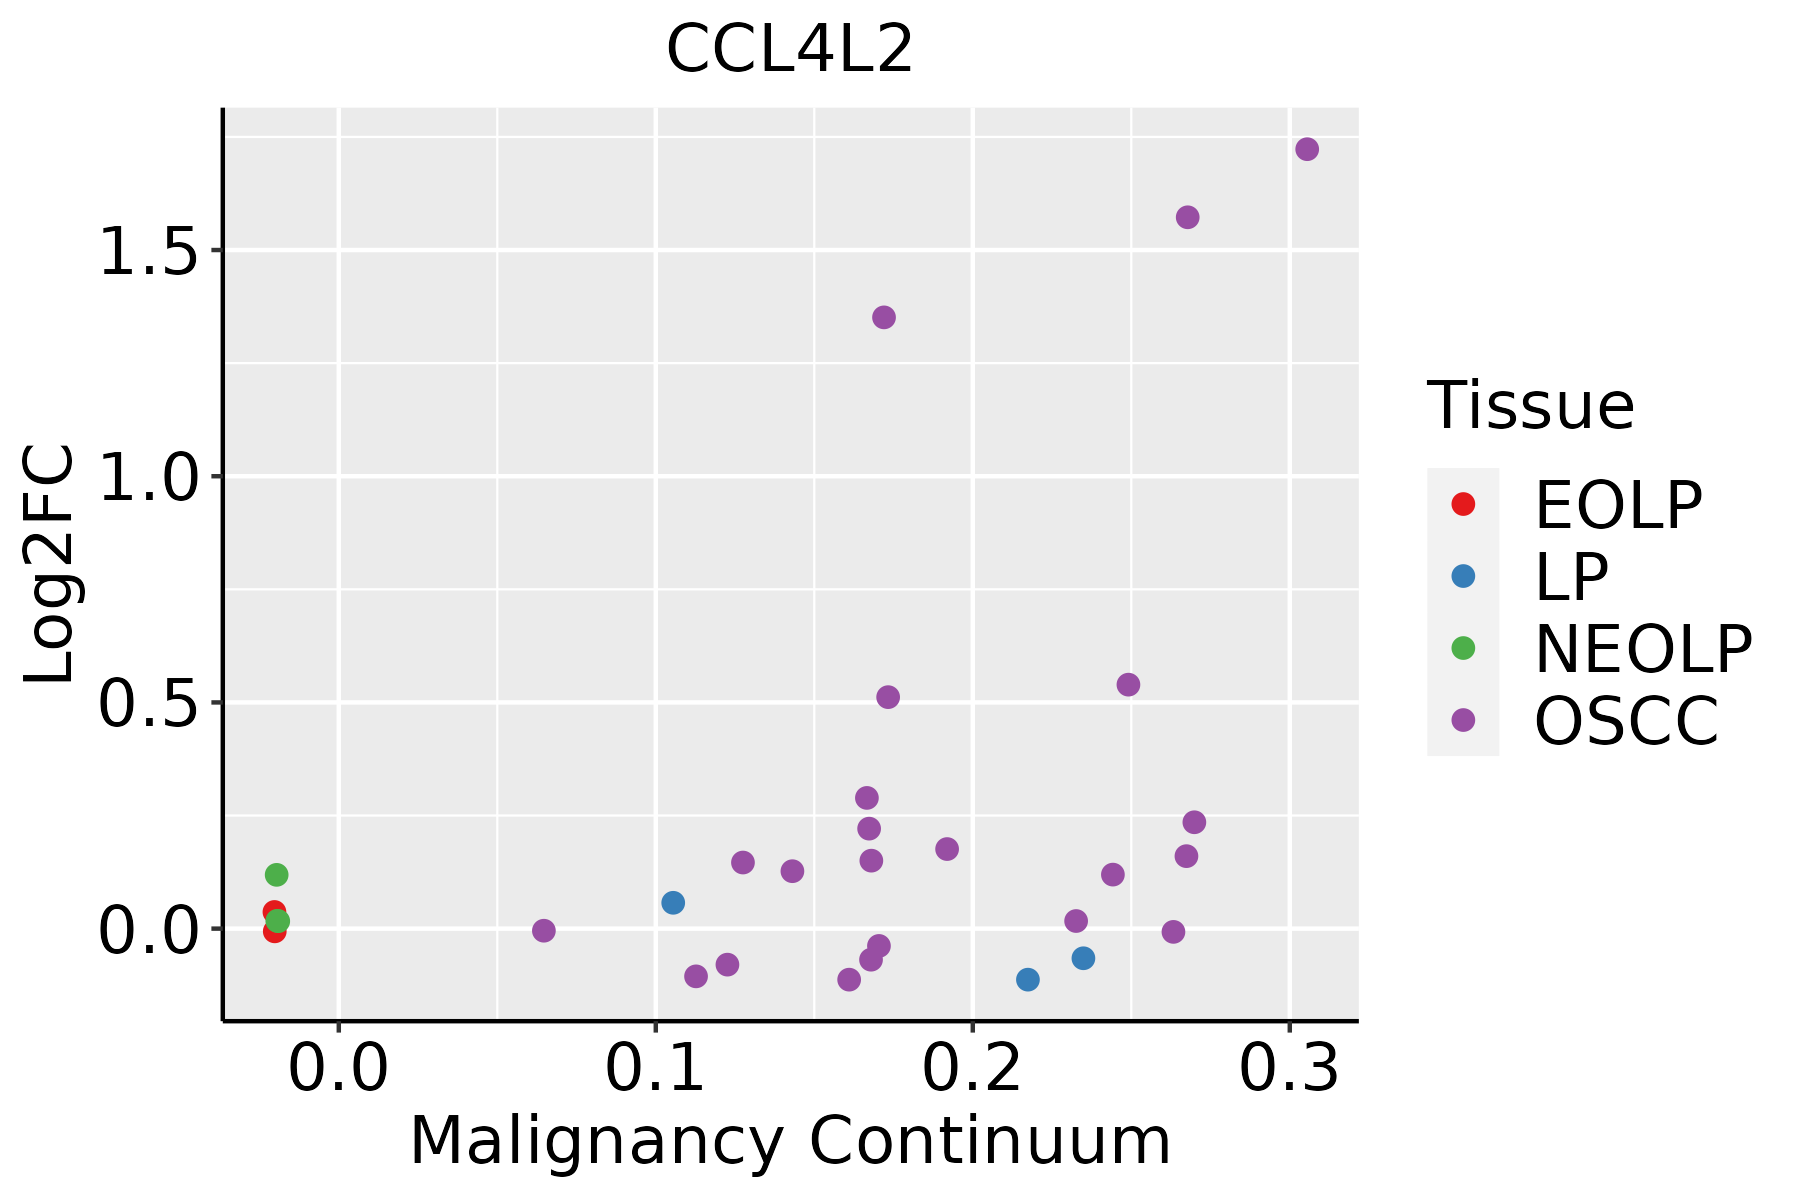 | EOLP: Erosive Oral lichen planus |
| LP: leukoplakia | ||
| NEOLP: Non-erosive oral lichen planus | ||
| OSCC: Oral squamous cell carcinoma | ||
| Thyroid | 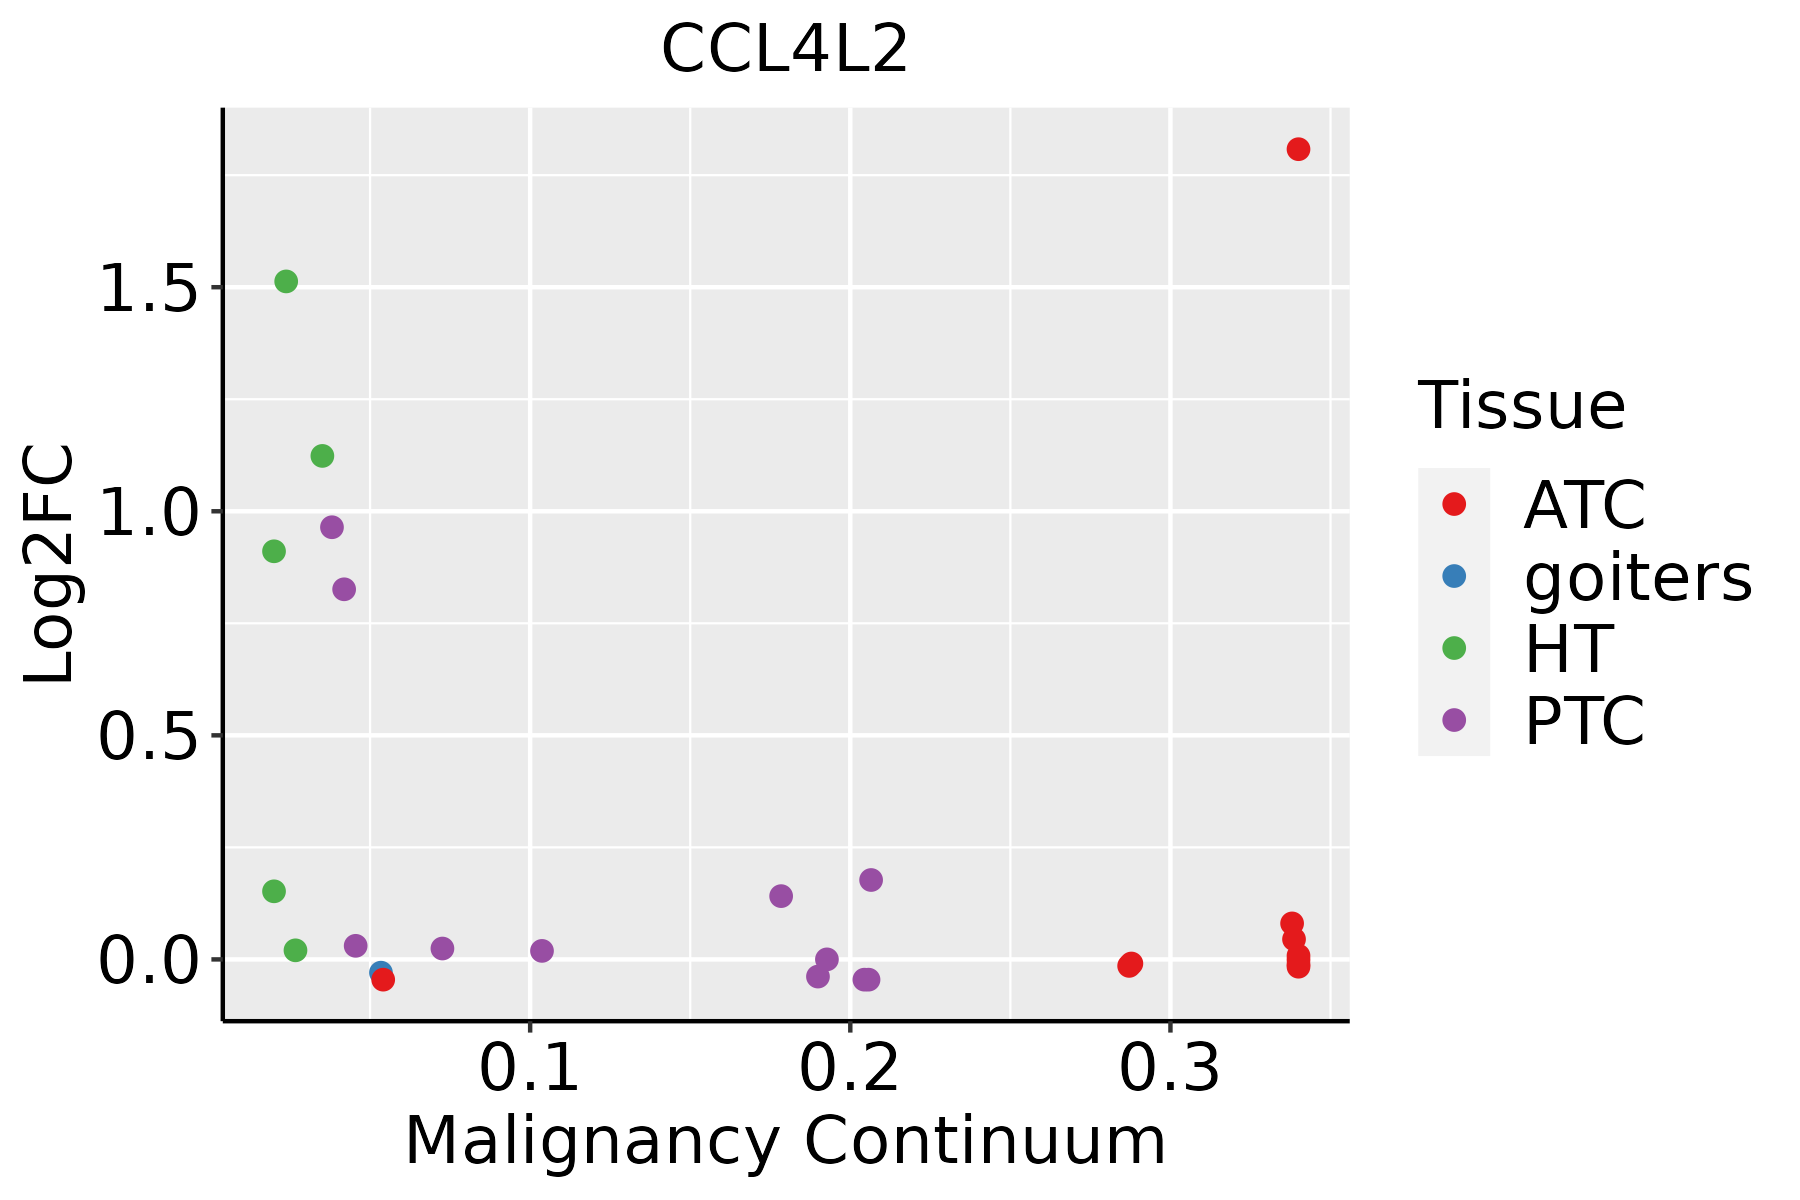 | ATC: Anaplastic thyroid cancer |
| HT: Hashimoto's thyroiditis | ||
| PTC: Papillary thyroid cancer |
| ∗log2FC in expression of this searched gene in stem-like cells from each diseased tissue sample relative to stem-like cells in normal samples in each tissue plotted against the malignancy continuum. Samples are colored based on if they are from different disease stage. |
Top |
Malignant transformation related pathway analysis |
| Find out the enriched GO biological processes and KEGG pathways involved in transition from healthy to precancer to cancer |
| Tissue | Disease Stage | Enriched GO biological Processes |
| Colorectum | AD |  |
| Colorectum | SER |  |
| Colorectum | MSS |  |
| Colorectum | MSI-H |  |
| Colorectum | FAP |  |
| ∗Top 15 enriched GO BP terms are showed in the bar plot of each disease state in each tissue. Each row represents a significant GO biological process which is colored according to the -log10(p.adjust). |
| Page: 1 2 3 4 5 6 7 8 9 |
| GO ID | Tissue | Disease Stage | Description | Gene Ratio | Bg Ratio | pvalue | p.adjust | Count |
| Page: 1 |
| Pathway ID | Tissue | Disease Stage | Description | Gene Ratio | Bg Ratio | pvalue | p.adjust | qvalue | Count |
| hsa0516328 | Oral cavity | OSCC | Human cytomegalovirus infection | 139/3704 | 225/8465 | 2.77e-08 | 2.38e-07 | 1.21e-07 | 139 |
| hsa040644 | Oral cavity | OSCC | NF-kappa B signaling pathway | 67/3704 | 104/8465 | 1.57e-05 | 6.75e-05 | 3.44e-05 | 67 |
| hsa04623 | Oral cavity | OSCC | Cytosolic DNA-sensing pathway | 44/3704 | 75/8465 | 6.44e-03 | 1.51e-02 | 7.68e-03 | 44 |
| hsa04620 | Oral cavity | OSCC | Toll-like receptor signaling pathway | 58/3704 | 104/8465 | 8.77e-03 | 1.98e-02 | 1.01e-02 | 58 |
| hsa05163112 | Oral cavity | OSCC | Human cytomegalovirus infection | 139/3704 | 225/8465 | 2.77e-08 | 2.38e-07 | 1.21e-07 | 139 |
| hsa0406411 | Oral cavity | OSCC | NF-kappa B signaling pathway | 67/3704 | 104/8465 | 1.57e-05 | 6.75e-05 | 3.44e-05 | 67 |
| hsa046231 | Oral cavity | OSCC | Cytosolic DNA-sensing pathway | 44/3704 | 75/8465 | 6.44e-03 | 1.51e-02 | 7.68e-03 | 44 |
| hsa046201 | Oral cavity | OSCC | Toll-like receptor signaling pathway | 58/3704 | 104/8465 | 8.77e-03 | 1.98e-02 | 1.01e-02 | 58 |
| Page: 1 |
Top |
Cell-cell communication analysis |
| Identification of potential cell-cell interactions between two cell types and their ligand-receptor pairs for different disease states |
| Ligand | Receptor | LRpair | Pathway | Tissue | Disease Stage |
| Page: 1 |
Top |
Single-cell gene regulatory network inference analysis |
| Find out the significant the regulons (TFs) and the target genes of each regulon across cell types for different disease states |
| TF | Cell Type | Tissue | Disease Stage | Target Gene | RSS | Regulon Activity |
| ∗The dot plots of a searched regulon are shown for all cell subpopulations in each disease state of each tissue based on the regulon specific score inferred using pySCENIC and by calculating the average expression. |
| Page: 1 |
Top |
Somatic mutation of malignant transformation related genes |
| Annotation of somatic variants for genes involved in malignant transformation |
| Hugo Symbol | Variant Class | Variant Classification | dbSNP RS | HGVSc | HGVSp | HGVSp Short | SWISSPROT | BIOTYPE | SIFT | PolyPhen | Tumor Sample Barcode | Tissue | Histology | Sex | Age | Stage | Therapy Types | Drugs | Outcome |
| CCL4L2 | SNV | Missense_Mutation | novel | c.148G>A | p.Asp50Asn | p.D50N | Q8NHW4 | protein_coding | deleterious(0.02) | possibly_damaging(0.685) | TCGA-VS-A959-01 | Cervix | cervical & endocervical cancer | Female | >=65 | I/II | Unknown | Unknown | SD |
| CCL4L2 | SNV | Missense_Mutation | novel | c.13G>A | p.Val5Met | p.V5M | Q8NHW4 | protein_coding | tolerated(0.05) | benign(0.007) | TCGA-AA-A010-01 | Colorectum | colon adenocarcinoma | Female | <65 | I/II | Chemotherapy | folinic | CR |
| CCL4L2 | SNV | Missense_Mutation | novel | c.5N>C | p.Lys2Thr | p.K2T | Q8NHW4 | protein_coding | deleterious(0) | probably_damaging(0.958) | TCGA-AG-A002-01 | Colorectum | rectum adenocarcinoma | Male | <65 | I/II | Unknown | Unknown | SD |
| CCL4L2 | SNV | Missense_Mutation | novel | c.7N>T | p.Leu3Phe | p.L3F | Q8NHW4 | protein_coding | tolerated(0.11) | benign(0) | TCGA-A5-A1OF-01 | Endometrium | uterine corpus endometrioid carcinoma | Female | <65 | I/II | Unknown | Unknown | SD |
| CCL4L2 | SNV | Missense_Mutation | novel | c.80G>A | p.Gly27Asp | p.G27D | Q8NHW4 | protein_coding | deleterious(0.02) | probably_damaging(0.995) | TCGA-B5-A3FC-01 | Endometrium | uterine corpus endometrioid carcinoma | Female | <65 | I/II | Unknown | Unknown | SD |
| CCL4L2 | SNV | Missense_Mutation | novel | c.274N>A | p.Val92Ile | p.V92I | Q8NHW4 | protein_coding | tolerated_low_confidence(0.34) | unknown(0) | TCGA-44-6777-01 | Lung | lung adenocarcinoma | Female | >=65 | I/II | Unknown | Unknown | SD |
| CCL4L2 | SNV | Missense_Mutation | novel | c.260N>A | p.Pro87His | p.P87H | Q8NHW4 | protein_coding | tolerated_low_confidence(0.06) | benign(0.003) | TCGA-44-8117-01 | Lung | lung adenocarcinoma | Female | <65 | I/II | Chemotherapy | cisplatin | CR |
| CCL4L2 | SNV | Missense_Mutation | novel | c.46N>T | p.Ala16Ser | p.A16S | Q8NHW4 | protein_coding | deleterious(0.05) | probably_damaging(0.931) | TCGA-34-8455-01 | Lung | lung squamous cell carcinoma | Male | >=65 | III/IV | Unknown | Unknown | PD |
| CCL4L2 | SNV | Missense_Mutation | novel | c.306N>T | p.Lys102Asn | p.K102N | Q8NHW4 | protein_coding | unknown(0) | TCGA-CV-7421-01 | Oral cavity | head & neck squamous cell carcinoma | Male | >=65 | I/II | Unknown | Unknown | SD | |
| CCL4L2 | SNV | Missense_Mutation | novel | c.253N>T | p.Ser85Cys | p.S85C | Q8NHW4 | protein_coding | deleterious(0.05) | benign(0.048) | TCGA-QK-A8Z7-01 | Oral cavity | head & neck squamous cell carcinoma | Male | <65 | I/II | Chemotherapy | carboplatin | CR |
| Page: 1 2 |
Top |
Related drugs of malignant transformation related genes |
| Identification of chemicals and drugs interact with genes involved in malignant transfromation |
| (DGIdb 4.0) |
| Entrez ID | Symbol | Category | Interaction Types | Drug Claim Name | Drug Name | PMIDs |
| Page: 1 |

Copyright 2023-Present -The University of Texas Health Science Center at Houston |