
|
|||||
|
 | |
| |
| |
| |
| |
| |
|
Gene: CCL4 |
Gene summary for CCL4 |
| Gene information | Species | Human | Gene symbol | CCL4 | Gene ID | 6351 |
| Gene name | C-C motif chemokine ligand 4 | |
| Gene Alias | ACT2 | |
| Cytomap | 17q12 | |
| Gene Type | protein-coding | GO ID | GO:0000165 | UniProtAcc | P13236 |
Top |
Malignant transformation analysis |
| Identification of the aberrant gene expression in precancerous and cancerous lesions by comparing the gene expression of stem-like cells in diseased tissues with normal stem cells |
| Entrez ID | Symbol | Replicates | Species | Organ | Tissue | Adj P-value | Log2FC | Malignancy |
| 6351 | CCL4 | GSM4909291 | Human | Breast | IDC | 7.70e-06 | 3.25e-01 | 0.1753 |
| 6351 | CCL4 | GSM4909317 | Human | Breast | IDC | 7.10e-04 | 2.92e-01 | 0.1355 |
| 6351 | CCL4 | GSM4909319 | Human | Breast | IDC | 3.05e-04 | 1.39e-01 | 0.1563 |
| 6351 | CCL4 | NCCBC5 | Human | Breast | DCIS | 2.73e-07 | 5.76e-01 | 0.2046 |
| 6351 | CCL4 | P2 | Human | Breast | IDC | 1.07e-10 | 6.59e-01 | 0.21 |
| 6351 | CCL4 | CA_HPV_1 | Human | Cervix | CC | 1.59e-18 | 7.13e-01 | 0.0264 |
| 6351 | CCL4 | N_HPV_2 | Human | Cervix | N_HPV | 1.93e-35 | 9.18e-01 | -0.0131 |
| 6351 | CCL4 | Tumor | Human | Cervix | CC | 8.81e-06 | -1.83e-01 | 0.1241 |
| 6351 | CCL4 | T3 | Human | Cervix | CC | 8.81e-06 | -1.80e-01 | 0.1389 |
| 6351 | CCL4 | EEC-subject4 | Human | Endometrium | EEC | 8.52e-23 | 8.41e-01 | -0.2571 |
| 6351 | CCL4 | EEC-subject5 | Human | Endometrium | EEC | 4.07e-09 | 4.99e-01 | -0.249 |
| 6351 | CCL4 | LZE6T | Human | Esophagus | ESCC | 8.83e-13 | 3.09e+00 | 0.0845 |
| 6351 | CCL4 | P9T-E | Human | Esophagus | ESCC | 6.31e-16 | 1.24e-01 | 0.1131 |
| 6351 | CCL4 | P10T-E | Human | Esophagus | ESCC | 3.50e-02 | -1.67e-01 | 0.116 |
| 6351 | CCL4 | P12T-E | Human | Esophagus | ESCC | 7.90e-03 | -1.67e-01 | 0.1122 |
| 6351 | CCL4 | P16T-E | Human | Esophagus | ESCC | 3.75e-03 | -1.63e-01 | 0.1153 |
| 6351 | CCL4 | P22T-E | Human | Esophagus | ESCC | 3.50e-02 | -1.67e-01 | 0.1236 |
| 6351 | CCL4 | P27T-E | Human | Esophagus | ESCC | 4.74e-23 | -1.14e-01 | 0.1055 |
| 6351 | CCL4 | P28T-E | Human | Esophagus | ESCC | 2.88e-02 | -5.04e-02 | 0.1149 |
| 6351 | CCL4 | P47T-E | Human | Esophagus | ESCC | 7.90e-03 | -1.64e-01 | 0.1067 |
| Page: 1 2 3 4 |
| Tissue | Expression Dynamics | Abbreviation |
| Breast | 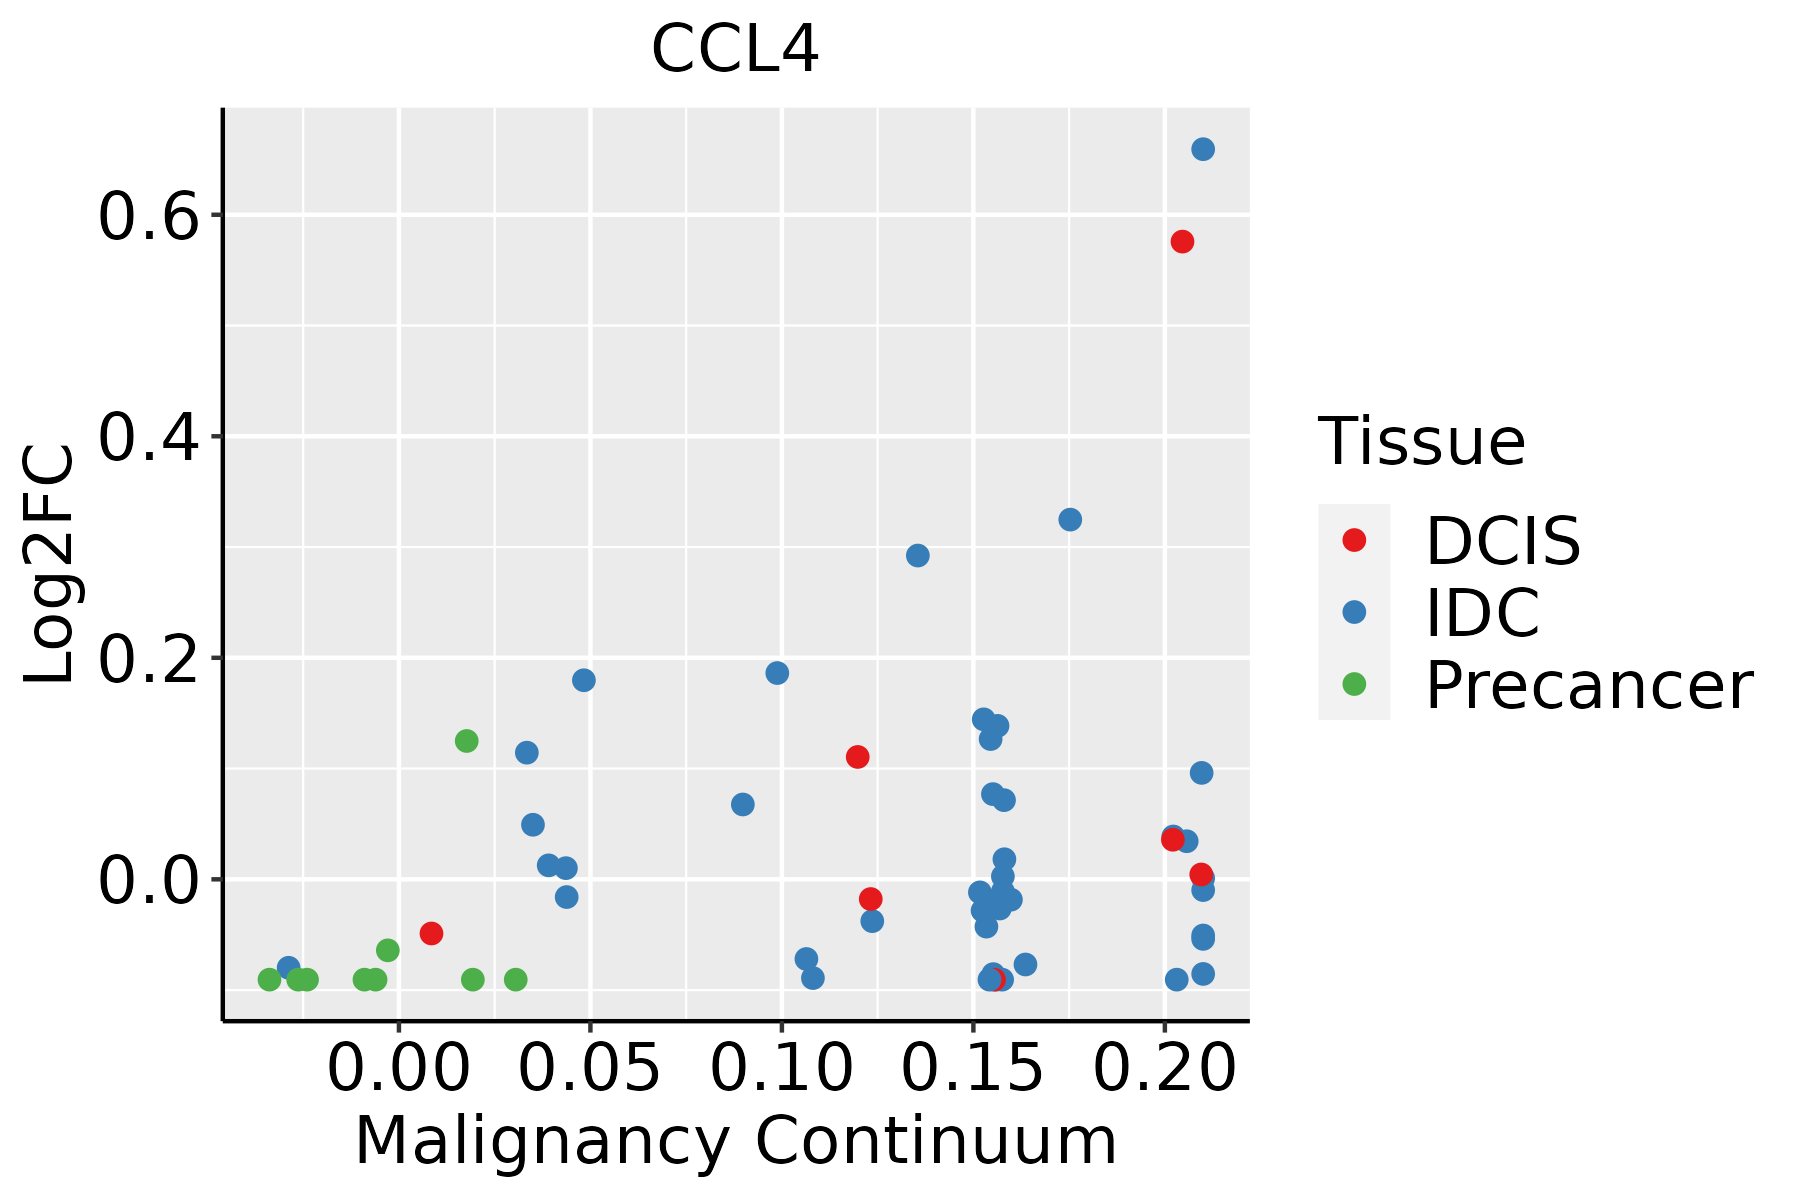 | IDC: Invasive ductal carcinoma |
| DCIS: Ductal carcinoma in situ | ||
| Precancer(BRCA1-mut): Precancerous lesion from BRCA1 mutation carriers | ||
| Cervix | 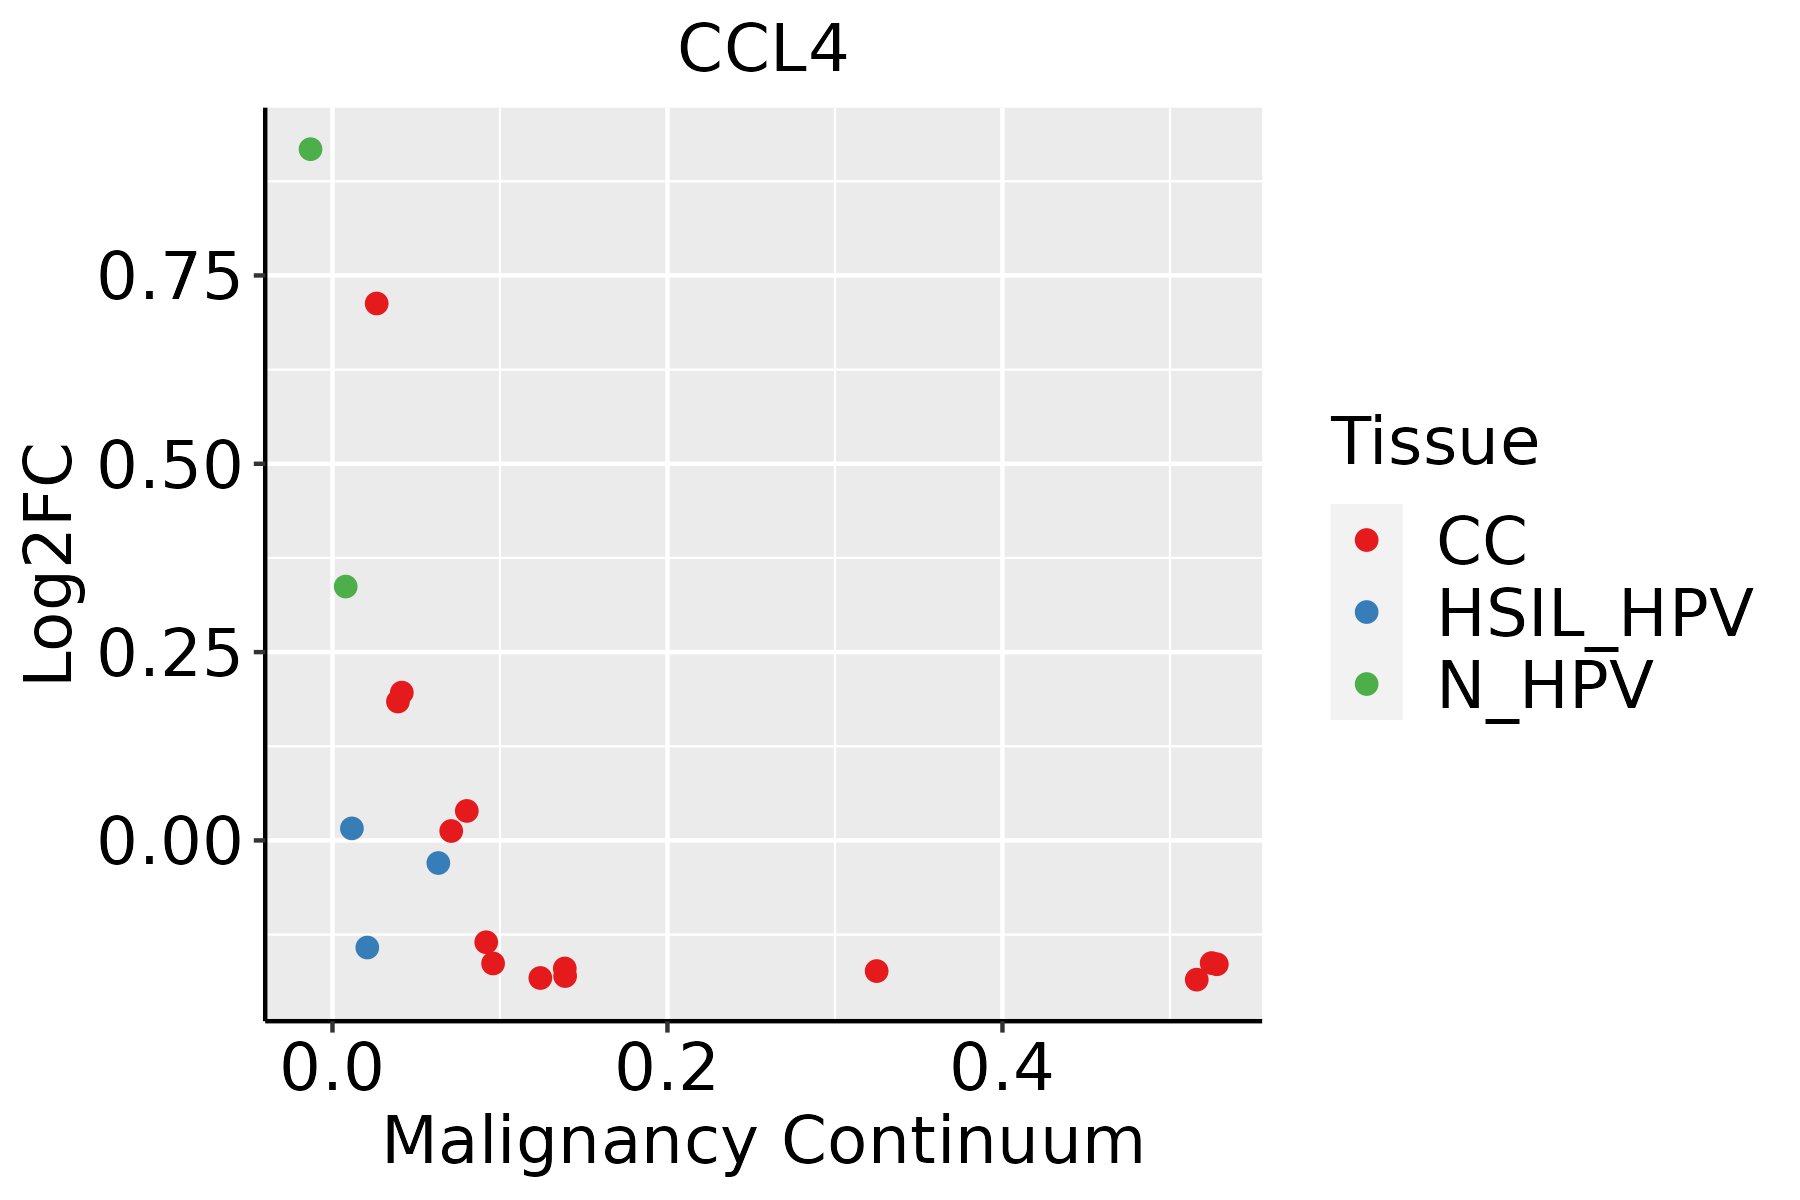 | CC: Cervix cancer |
| HSIL_HPV: HPV-infected high-grade squamous intraepithelial lesions | ||
| N_HPV: HPV-infected normal cervix | ||
| Endometrium | 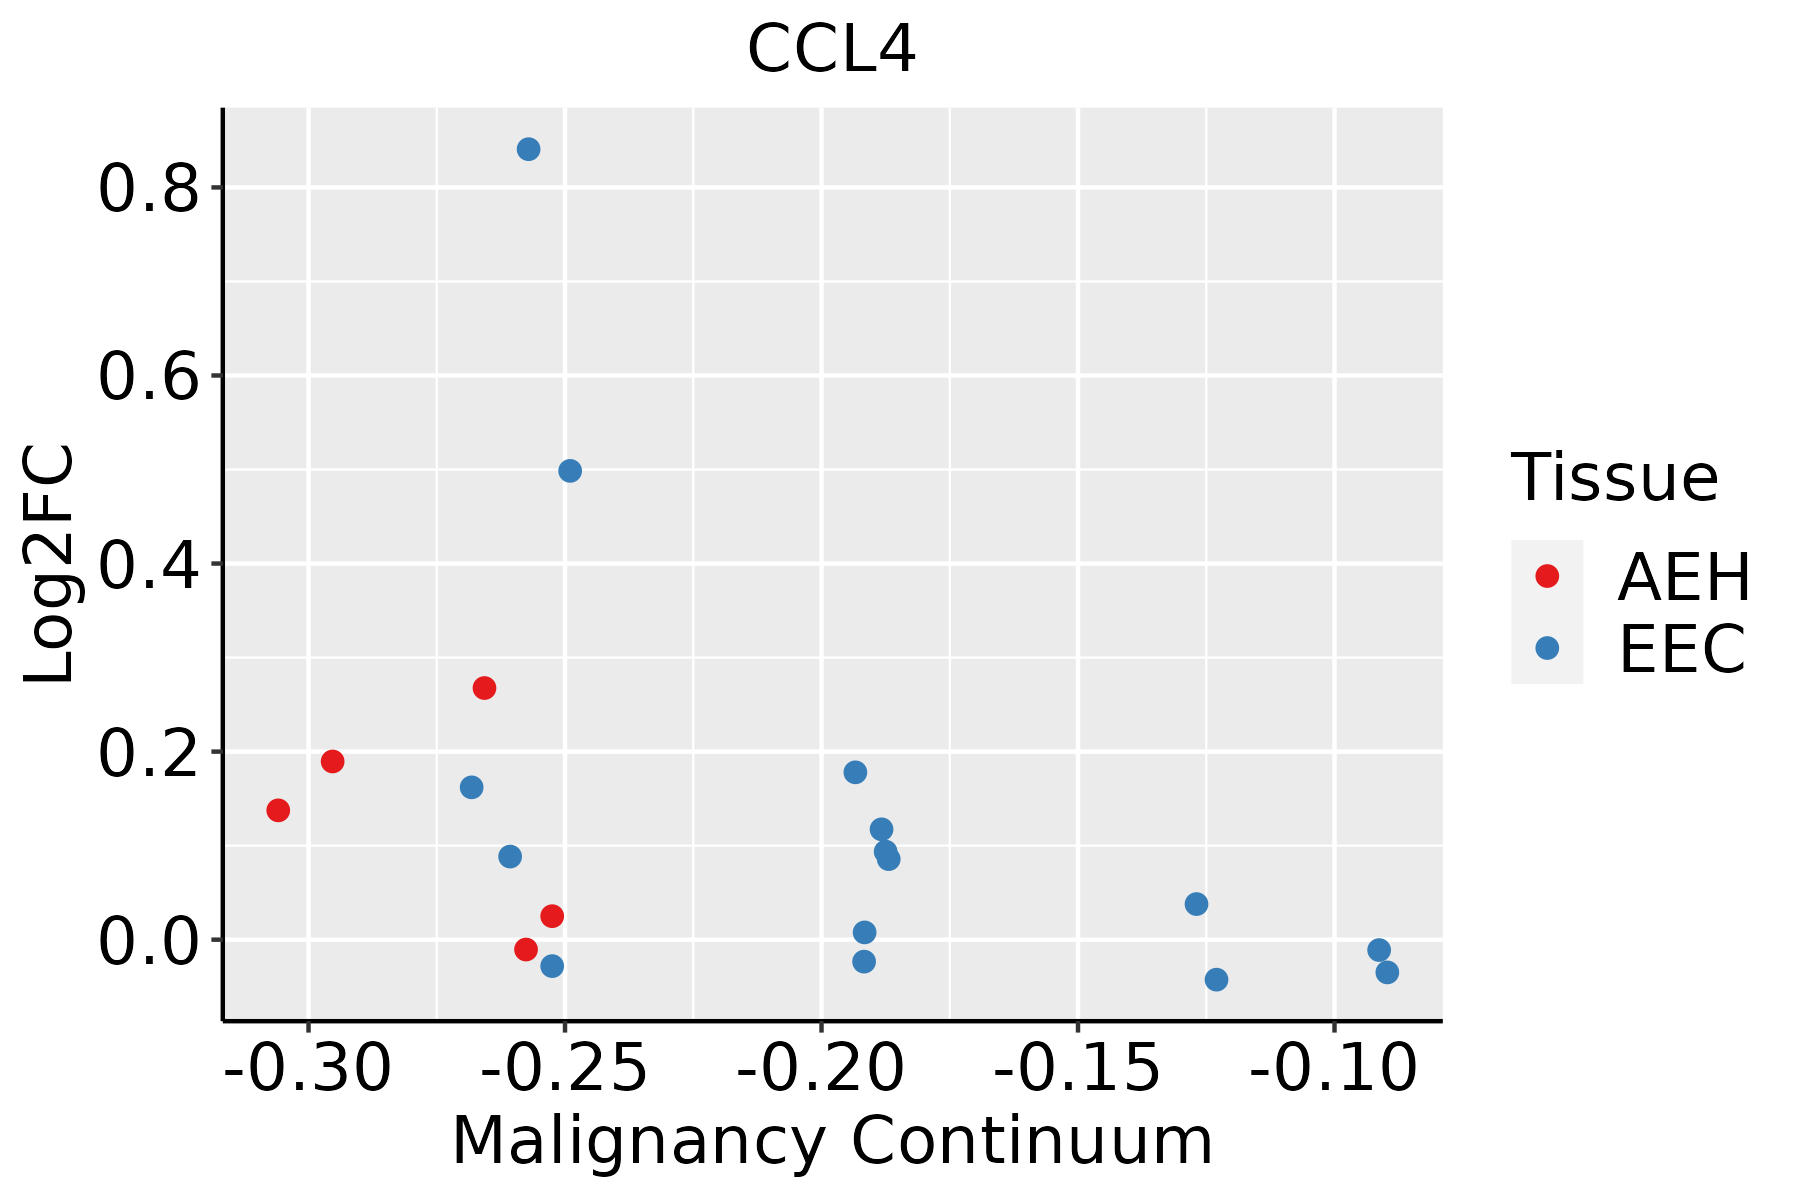 | AEH: Atypical endometrial hyperplasia |
| EEC: Endometrioid Cancer | ||
| Esophagus |  | ESCC: Esophageal squamous cell carcinoma |
| HGIN: High-grade intraepithelial neoplasias | ||
| LGIN: Low-grade intraepithelial neoplasias | ||
| Liver |  | HCC: Hepatocellular carcinoma |
| NAFLD: Non-alcoholic fatty liver disease | ||
| Oral Cavity | 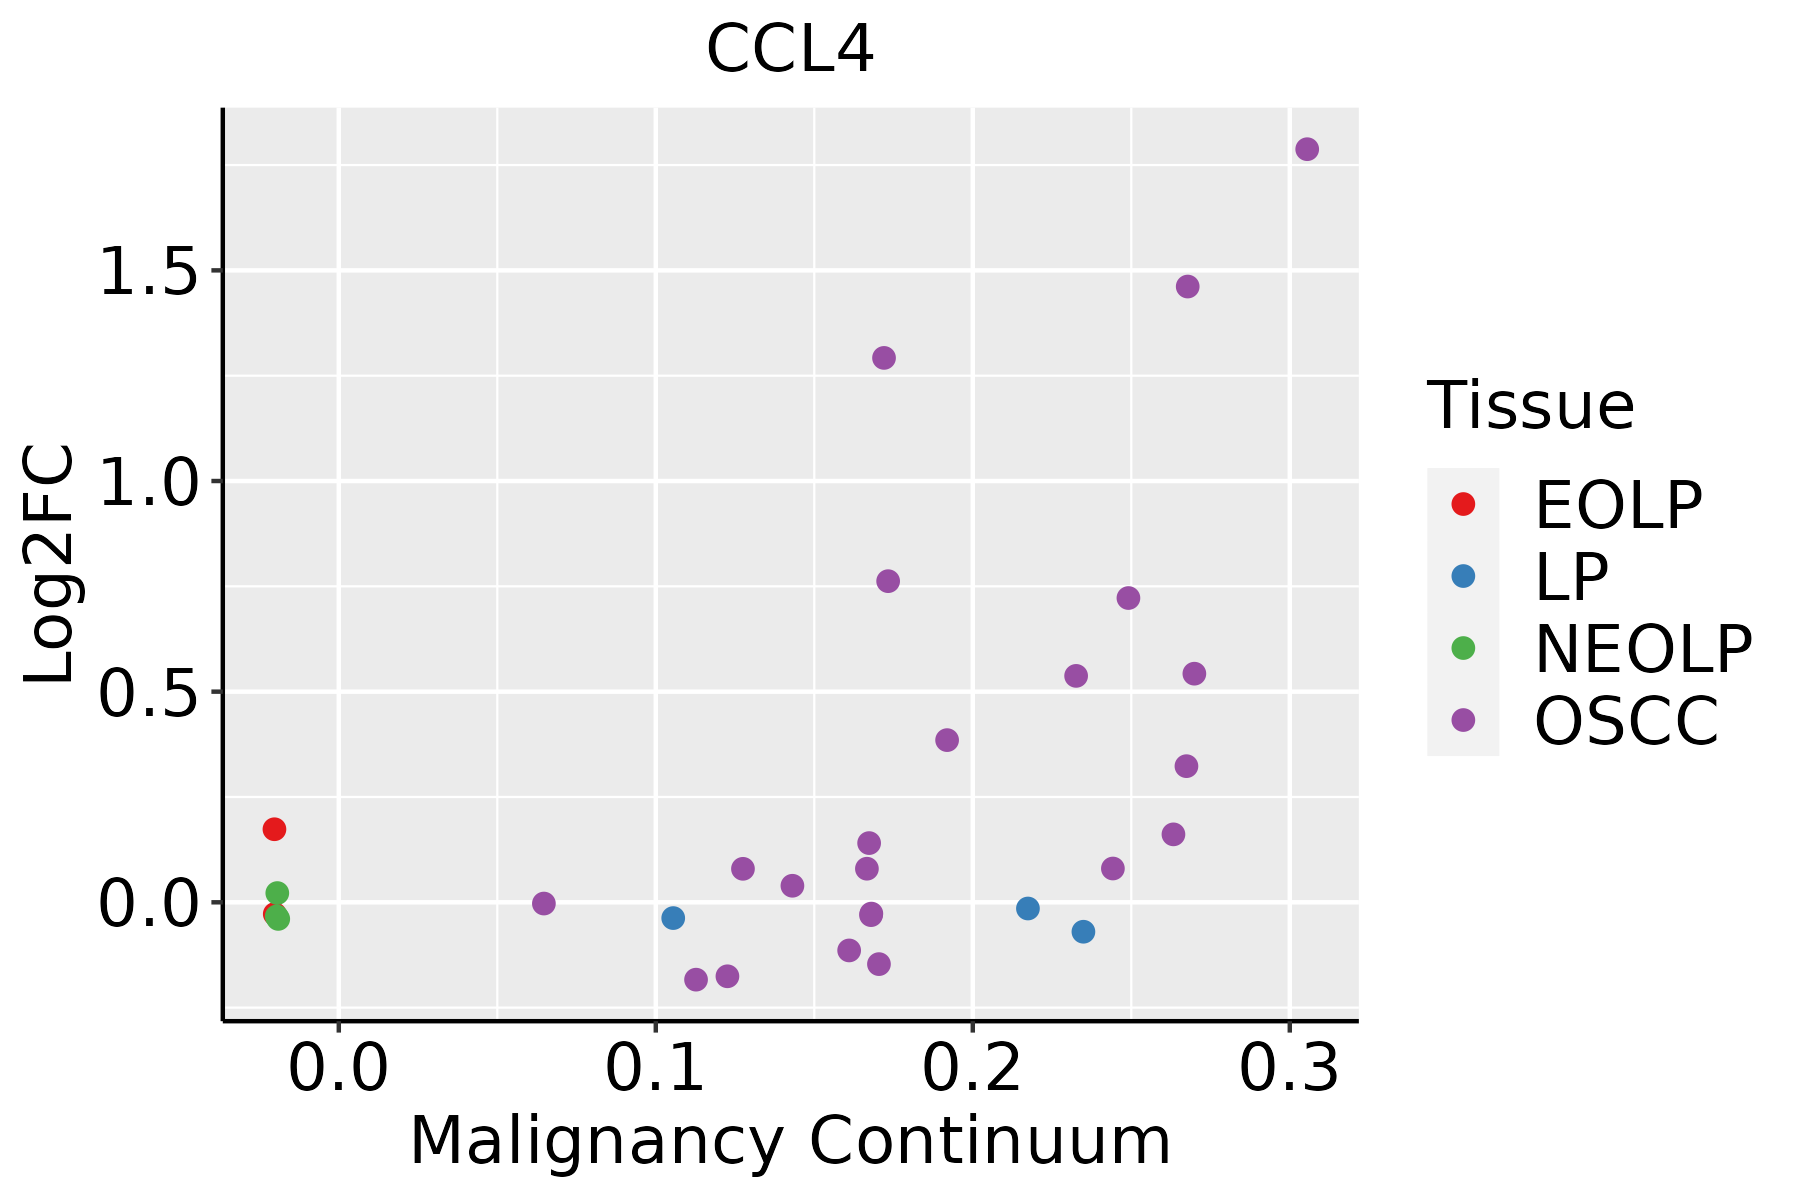 | EOLP: Erosive Oral lichen planus |
| LP: leukoplakia | ||
| NEOLP: Non-erosive oral lichen planus | ||
| OSCC: Oral squamous cell carcinoma | ||
| Thyroid | 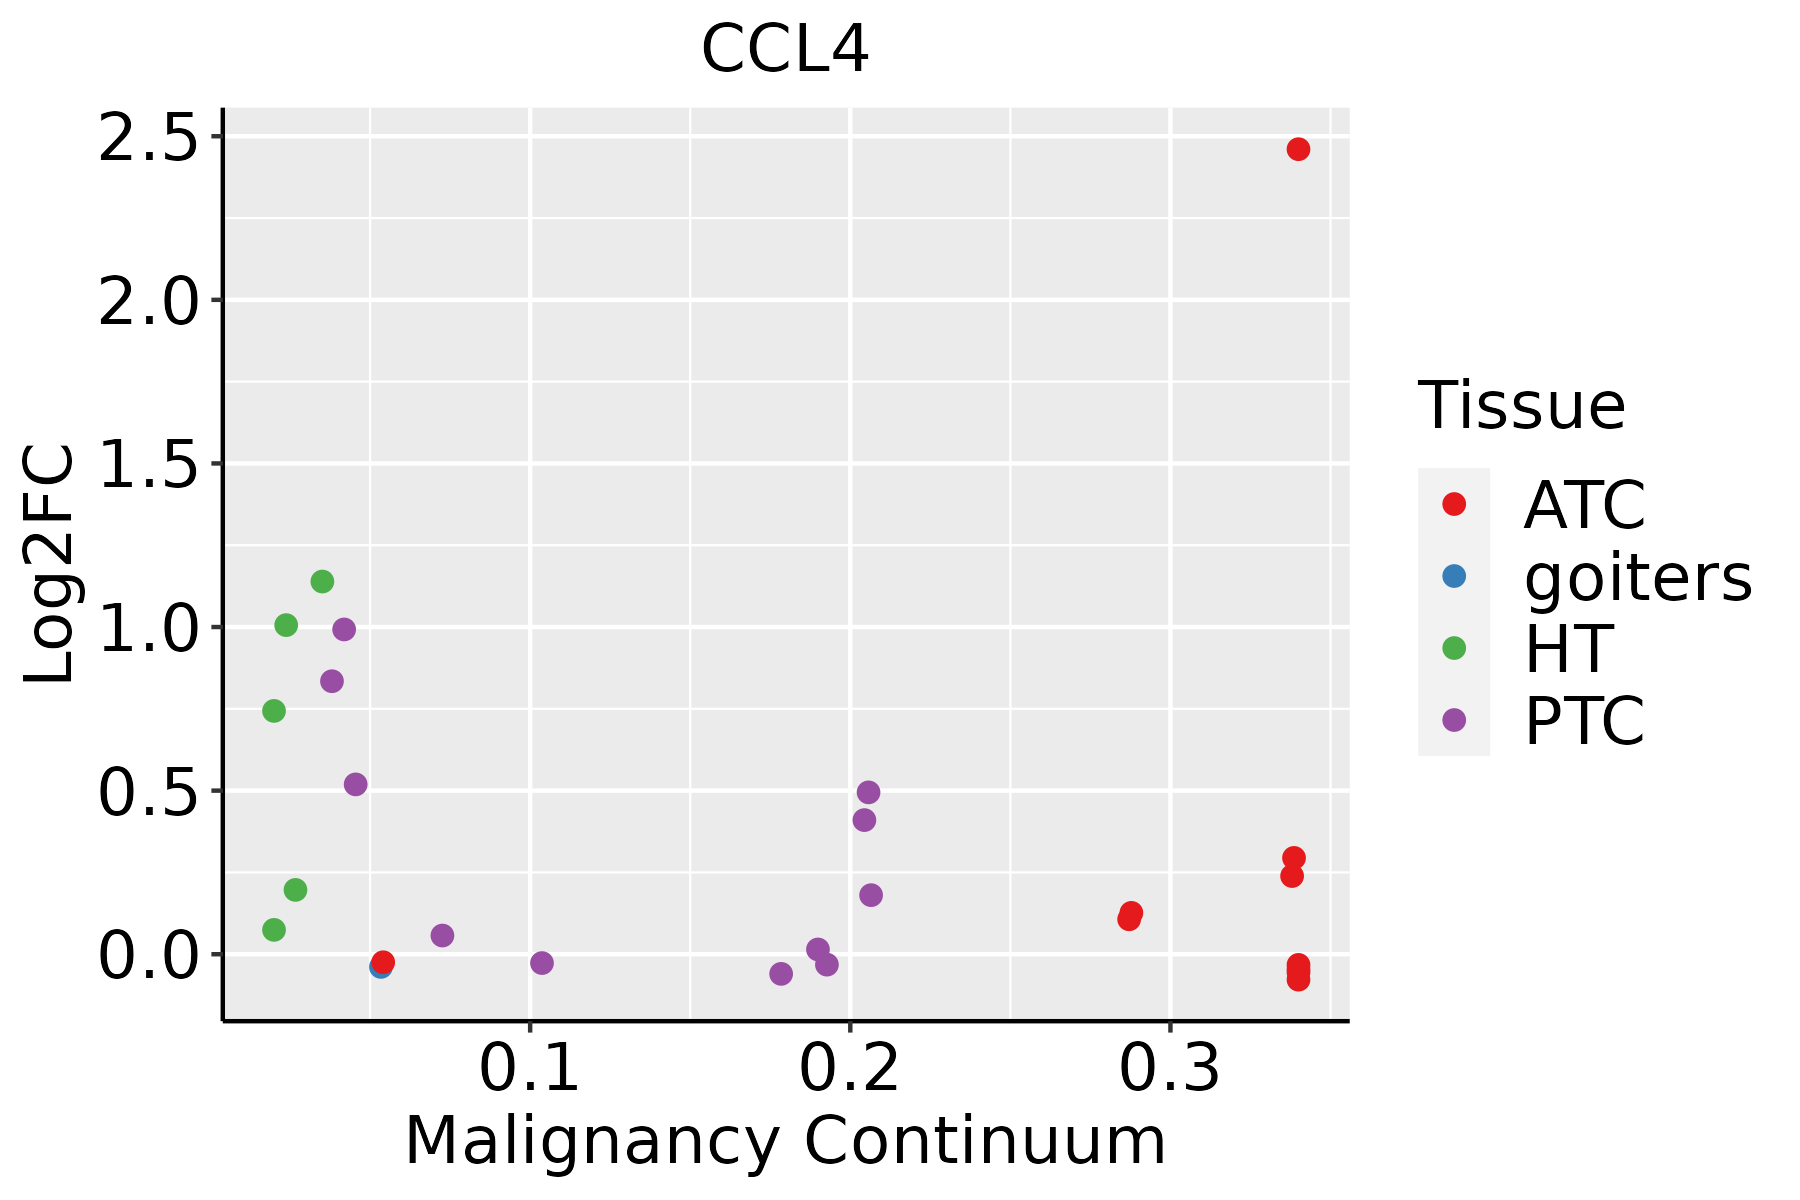 | ATC: Anaplastic thyroid cancer |
| HT: Hashimoto's thyroiditis | ||
| PTC: Papillary thyroid cancer |
| ∗log2FC in expression of this searched gene in stem-like cells from each diseased tissue sample relative to stem-like cells in normal samples in each tissue plotted against the malignancy continuum. Samples are colored based on if they are from different disease stage. |
Top |
Malignant transformation related pathway analysis |
| Find out the enriched GO biological processes and KEGG pathways involved in transition from healthy to precancer to cancer |
| Tissue | Disease Stage | Enriched GO biological Processes |
| Colorectum | AD |  |
| Colorectum | SER |  |
| Colorectum | MSS |  |
| Colorectum | MSI-H |  |
| Colorectum | FAP |  |
| ∗Top 15 enriched GO BP terms are showed in the bar plot of each disease state in each tissue. Each row represents a significant GO biological process which is colored according to the -log10(p.adjust). |
| Page: 1 2 3 4 5 6 7 8 9 |
| GO ID | Tissue | Disease Stage | Description | Gene Ratio | Bg Ratio | pvalue | p.adjust | Count |
| GO:001603214 | Breast | IDC | viral process | 75/1434 | 415/18723 | 1.98e-12 | 4.02e-10 | 75 |
| GO:004440314 | Breast | IDC | biological process involved in symbiotic interaction | 52/1434 | 290/18723 | 6.55e-09 | 5.03e-07 | 52 |
| GO:000963613 | Breast | IDC | response to toxic substance | 44/1434 | 262/18723 | 6.33e-07 | 3.00e-05 | 44 |
| GO:007162111 | Breast | IDC | granulocyte chemotaxis | 26/1434 | 125/18723 | 2.36e-06 | 9.30e-05 | 26 |
| GO:005090011 | Breast | IDC | leukocyte migration | 54/1434 | 369/18723 | 3.10e-06 | 1.15e-04 | 54 |
| GO:009752911 | Breast | IDC | myeloid leukocyte migration | 37/1434 | 220/18723 | 4.65e-06 | 1.62e-04 | 37 |
| GO:003059511 | Breast | IDC | leukocyte chemotaxis | 38/1434 | 230/18723 | 5.36e-06 | 1.76e-04 | 38 |
| GO:003059311 | Breast | IDC | neutrophil chemotaxis | 22/1434 | 103/18723 | 8.82e-06 | 2.50e-04 | 22 |
| GO:006032611 | Breast | IDC | cell chemotaxis | 46/1434 | 310/18723 | 1.13e-05 | 3.08e-04 | 46 |
| GO:009753011 | Breast | IDC | granulocyte migration | 27/1434 | 148/18723 | 1.98e-05 | 4.88e-04 | 27 |
| GO:199026611 | Breast | IDC | neutrophil migration | 23/1434 | 122/18723 | 4.67e-05 | 1.04e-03 | 23 |
| GO:000268511 | Breast | IDC | regulation of leukocyte migration | 33/1434 | 210/18723 | 6.10e-05 | 1.27e-03 | 33 |
| GO:007135613 | Breast | IDC | cellular response to tumor necrosis factor | 35/1434 | 229/18723 | 6.64e-05 | 1.35e-03 | 35 |
| GO:001095913 | Breast | IDC | regulation of metal ion transport | 52/1434 | 406/18723 | 1.76e-04 | 2.97e-03 | 52 |
| GO:003210311 | Breast | IDC | positive regulation of response to external stimulus | 54/1434 | 427/18723 | 1.85e-04 | 3.07e-03 | 54 |
| GO:003461213 | Breast | IDC | response to tumor necrosis factor | 36/1434 | 253/18723 | 2.29e-04 | 3.64e-03 | 36 |
| GO:00517025 | Breast | IDC | biological process involved in interaction with symbiont | 18/1434 | 94/18723 | 2.46e-04 | 3.85e-03 | 18 |
| GO:000716314 | Breast | IDC | establishment or maintenance of cell polarity | 32/1434 | 218/18723 | 2.84e-04 | 4.33e-03 | 32 |
| GO:007167711 | Breast | IDC | positive regulation of mononuclear cell migration | 14/1434 | 65/18723 | 3.35e-04 | 4.98e-03 | 14 |
| GO:00096157 | Breast | IDC | response to virus | 47/1434 | 367/18723 | 3.53e-04 | 5.16e-03 | 47 |
| Page: 1 2 3 4 5 6 7 8 9 10 11 12 13 14 15 16 17 18 19 |
| Pathway ID | Tissue | Disease Stage | Description | Gene Ratio | Bg Ratio | pvalue | p.adjust | qvalue | Count |
| hsa0516324 | Breast | IDC | Human cytomegalovirus infection | 39/867 | 225/8465 | 6.66e-04 | 5.41e-03 | 4.05e-03 | 39 |
| hsa0516334 | Breast | IDC | Human cytomegalovirus infection | 39/867 | 225/8465 | 6.66e-04 | 5.41e-03 | 4.05e-03 | 39 |
| hsa0516344 | Breast | DCIS | Human cytomegalovirus infection | 38/846 | 225/8465 | 8.11e-04 | 5.95e-03 | 4.38e-03 | 38 |
| hsa0516354 | Breast | DCIS | Human cytomegalovirus infection | 38/846 | 225/8465 | 8.11e-04 | 5.95e-03 | 4.38e-03 | 38 |
| hsa0516318 | Cervix | CC | Human cytomegalovirus infection | 65/1267 | 225/8465 | 4.59e-08 | 6.47e-07 | 3.83e-07 | 65 |
| hsa04062 | Cervix | CC | Chemokine signaling pathway | 43/1267 | 192/8465 | 3.60e-03 | 1.34e-02 | 7.91e-03 | 43 |
| hsa0516319 | Cervix | CC | Human cytomegalovirus infection | 65/1267 | 225/8465 | 4.59e-08 | 6.47e-07 | 3.83e-07 | 65 |
| hsa040621 | Cervix | CC | Chemokine signaling pathway | 43/1267 | 192/8465 | 3.60e-03 | 1.34e-02 | 7.91e-03 | 43 |
| hsa0516325 | Endometrium | EEC | Human cytomegalovirus infection | 47/1237 | 225/8465 | 6.17e-03 | 3.12e-02 | 2.33e-02 | 47 |
| hsa0516335 | Endometrium | EEC | Human cytomegalovirus infection | 47/1237 | 225/8465 | 6.17e-03 | 3.12e-02 | 2.33e-02 | 47 |
| hsa05163210 | Esophagus | ESCC | Human cytomegalovirus infection | 148/4205 | 225/8465 | 5.73e-07 | 4.00e-06 | 2.05e-06 | 148 |
| hsa040645 | Esophagus | ESCC | NF-kappa B signaling pathway | 67/4205 | 104/8465 | 1.62e-03 | 4.89e-03 | 2.50e-03 | 67 |
| hsa046234 | Esophagus | ESCC | Cytosolic DNA-sensing pathway | 49/4205 | 75/8465 | 4.35e-03 | 1.12e-02 | 5.74e-03 | 49 |
| hsa0516338 | Esophagus | ESCC | Human cytomegalovirus infection | 148/4205 | 225/8465 | 5.73e-07 | 4.00e-06 | 2.05e-06 | 148 |
| hsa0406412 | Esophagus | ESCC | NF-kappa B signaling pathway | 67/4205 | 104/8465 | 1.62e-03 | 4.89e-03 | 2.50e-03 | 67 |
| hsa0462311 | Esophagus | ESCC | Cytosolic DNA-sensing pathway | 49/4205 | 75/8465 | 4.35e-03 | 1.12e-02 | 5.74e-03 | 49 |
| hsa0516312 | Liver | Cirrhotic | Human cytomegalovirus infection | 87/2530 | 225/8465 | 2.67e-03 | 1.10e-02 | 6.76e-03 | 87 |
| hsa0516313 | Liver | Cirrhotic | Human cytomegalovirus infection | 87/2530 | 225/8465 | 2.67e-03 | 1.10e-02 | 6.76e-03 | 87 |
| hsa0516322 | Liver | HCC | Human cytomegalovirus infection | 131/4020 | 225/8465 | 6.86e-04 | 2.77e-03 | 1.54e-03 | 131 |
| hsa0516332 | Liver | HCC | Human cytomegalovirus infection | 131/4020 | 225/8465 | 6.86e-04 | 2.77e-03 | 1.54e-03 | 131 |
| Page: 1 2 |
Top |
Cell-cell communication analysis |
| Identification of potential cell-cell interactions between two cell types and their ligand-receptor pairs for different disease states |
| Ligand | Receptor | LRpair | Pathway | Tissue | Disease Stage |
| CCL4 | CCR5 | CCL4_CCR5 | CCL | Breast | ADJ |
| CCL4 | CCR5 | CCL4_CCR5 | CCL | Cervix | ADJ |
| CCL4 | CCR5 | CCL4_CCR5 | CCL | CRC | SER |
| CCL4 | CCR5 | CCL4_CCR5 | CCL | Endometrium | AEH |
| CCL4 | CCR5 | CCL4_CCR5 | CCL | HNSCC | ADJ |
| CCL4 | ACKR2 | CCL4_ACKR2 | CCL | HNSCC | OSCC |
| CCL4 | ACKR2 | CCL4_ACKR2 | CCL | HNSCC | Precancer |
| CCL4 | CCR5 | CCL4_CCR5 | CCL | Prostate | ADJ |
| CCL4 | CCR5 | CCL4_CCR5 | CCL | Prostate | Tumor |
| CCL4 | CCR5 | CCL4_CCR5 | CCL | THCA | ADJ |
| CCL4 | CCR5 | CCL4_CCR5 | CCL | THCA | Precancer |
| CCL4 | ACKR2 | CCL4_ACKR2 | CCL | THCA | Precancer |
| CCL4 | CCR5 | CCL4_CCR5 | CCL | THCA | PTC |
| Page: 1 |
Top |
Single-cell gene regulatory network inference analysis |
| Find out the significant the regulons (TFs) and the target genes of each regulon across cell types for different disease states |
| TF | Cell Type | Tissue | Disease Stage | Target Gene | RSS | Regulon Activity |
| ∗The dot plots of a searched regulon are shown for all cell subpopulations in each disease state of each tissue based on the regulon specific score inferred using pySCENIC and by calculating the average expression. |
| Page: 1 |
Top |
Somatic mutation of malignant transformation related genes |
| Annotation of somatic variants for genes involved in malignant transformation |
| Hugo Symbol | Variant Class | Variant Classification | dbSNP RS | HGVSc | HGVSp | HGVSp Short | SWISSPROT | BIOTYPE | SIFT | PolyPhen | Tumor Sample Barcode | Tissue | Histology | Sex | Age | Stage | Therapy Types | Drugs | Outcome |
| CCL4 | SNV | Missense_Mutation | novel | c.191N>G | p.Val64Gly | p.V64G | P13236 | protein_coding | deleterious(0.03) | probably_damaging(0.997) | TCGA-AA-3713-01 | Colorectum | colon adenocarcinoma | Male | >=65 | III/IV | Chemotherapy | 5-fluorouracil | PR |
| CCL4 | SNV | Missense_Mutation | rs751043350 | c.97G>A | p.Ala33Thr | p.A33T | P13236 | protein_coding | tolerated(0.08) | benign(0.202) | TCGA-AZ-4313-01 | Colorectum | colon adenocarcinoma | Female | <65 | I/II | Unknown | Unknown | SD |
| CCL4 | SNV | Missense_Mutation | novel | c.97N>T | p.Ala33Ser | p.A33S | P13236 | protein_coding | tolerated(0.62) | benign(0.013) | TCGA-CI-6624-01 | Colorectum | rectum adenocarcinoma | Female | <65 | I/II | Unknown | Unknown | SD |
| CCL4 | SNV | Missense_Mutation | rs751043350 | c.97N>A | p.Ala33Thr | p.A33T | P13236 | protein_coding | tolerated(0.08) | benign(0.202) | TCGA-AX-A1CE-01 | Endometrium | uterine corpus endometrioid carcinoma | Female | <65 | I/II | Unspecific | Paclitaxel | SD |
| CCL4 | SNV | Missense_Mutation | novel | c.230C>A | p.Pro77His | p.P77H | P13236 | protein_coding | deleterious(0) | probably_damaging(0.999) | TCGA-B5-A0JY-01 | Endometrium | uterine corpus endometrioid carcinoma | Female | <65 | III/IV | Chemotherapy | doxorubicin | SD |
| CCL4 | SNV | Missense_Mutation | novel | c.43G>A | p.Ala15Thr | p.A15T | P13236 | protein_coding | tolerated(0.22) | probably_damaging(0.984) | TCGA-B5-A1MX-01 | Endometrium | uterine corpus endometrioid carcinoma | Female | <65 | I/II | Hormone Therapy | megace | SD |
| CCL4 | SNV | Missense_Mutation | novel | c.101G>T | p.Cys34Phe | p.C34F | P13236 | protein_coding | deleterious(0.02) | probably_damaging(0.996) | TCGA-D1-A163-01 | Endometrium | uterine corpus endometrioid carcinoma | Female | <65 | III/IV | Chemotherapy | taxol | SD |
| CCL4 | SNV | Missense_Mutation | novel | c.163A>G | p.Ser55Gly | p.S55G | P13236 | protein_coding | deleterious(0.02) | probably_damaging(0.982) | TCGA-D1-A17Q-01 | Endometrium | uterine corpus endometrioid carcinoma | Female | <65 | I/II | Unknown | Unknown | SD |
| CCL4 | SNV | Missense_Mutation | novel | c.107N>C | p.Phe36Ser | p.F36S | P13236 | protein_coding | deleterious(0) | probably_damaging(0.995) | TCGA-DI-A1BU-01 | Endometrium | uterine corpus endometrioid carcinoma | Female | <65 | I/II | Chemotherapy | paclitaxel | SD |
| CCL4 | SNV | Missense_Mutation | novel | c.252G>T | p.Glu84Asp | p.E84D | P13236 | protein_coding | tolerated(0.11) | benign(0.007) | TCGA-44-6774-01 | Lung | lung adenocarcinoma | Female | <65 | III/IV | Chemotherapy | alimta | SD |
| Page: 1 2 |
Top |
Related drugs of malignant transformation related genes |
| Identification of chemicals and drugs interact with genes involved in malignant transfromation |
| (DGIdb 4.0) |
| Entrez ID | Symbol | Category | Interaction Types | Drug Claim Name | Drug Name | PMIDs |
| 6351 | CCL4 | DRUGGABLE GENOME | EPO | EPOETIN ALFA | 17119331 | |
| 6351 | CCL4 | DRUGGABLE GENOME | CLODRONATE | CLODRONIC ACID | 12388372 | |
| 6351 | CCL4 | DRUGGABLE GENOME | CYCLOSPORIN A | 15153516 |
| Page: 1 |

Copyright 2023-Present -The University of Texas Health Science Center at Houston |