
|
|||||
|
 | |
| |
| |
| |
| |
| |
|
Gene: CCL3L3 |
Gene summary for CCL3L3 |
| Gene information | Species | Human | Gene symbol | CCL3L3 | Gene ID | 414062 |
| Gene name | C-C motif chemokine ligand 3 like 3 | |
| Gene Alias | 464.2 | |
| Cytomap | 17q12 | |
| Gene Type | protein-coding | GO ID | GO:0000165 | UniProtAcc | P16619 |
Top |
Malignant transformation analysis |
| Identification of the aberrant gene expression in precancerous and cancerous lesions by comparing the gene expression of stem-like cells in diseased tissues with normal stem cells |
| Entrez ID | Symbol | Replicates | Species | Organ | Tissue | Adj P-value | Log2FC | Malignancy |
| 414062 | CCL3L3 | C21 | Human | Oral cavity | OSCC | 3.93e-43 | 1.02e+00 | 0.2678 |
| 414062 | CCL3L3 | C30 | Human | Oral cavity | OSCC | 3.69e-47 | 1.49e+00 | 0.3055 |
| 414062 | CCL3L3 | C38 | Human | Oral cavity | OSCC | 1.31e-03 | 3.41e-01 | 0.172 |
| 414062 | CCL3L3 | C46 | Human | Oral cavity | OSCC | 4.32e-06 | 1.90e-01 | 0.1673 |
| 414062 | CCL3L3 | C06 | Human | Oral cavity | OSCC | 1.03e-04 | 6.18e-01 | 0.2699 |
| 414062 | CCL3L3 | C07 | Human | Oral cavity | OSCC | 1.27e-03 | 5.04e-01 | 0.2491 |
| 414062 | CCL3L3 | C08 | Human | Oral cavity | OSCC | 4.33e-08 | 1.77e-01 | 0.1919 |
| 414062 | CCL3L3 | C09 | Human | Oral cavity | OSCC | 3.59e-06 | 2.22e-01 | 0.1431 |
| 414062 | CCL3L3 | LN22 | Human | Oral cavity | OSCC | 1.21e-05 | 6.53e-01 | 0.1733 |
| 414062 | CCL3L3 | LN46 | Human | Oral cavity | OSCC | 2.37e-05 | 2.33e-01 | 0.1666 |
| 414062 | CCL3L3 | SYSMH6 | Human | Oral cavity | OSCC | 4.12e-05 | 1.50e-01 | 0.1275 |
| 414062 | CCL3L3 | PTCwithHT_1 | Human | Thyroid | HT | 1.45e-15 | 1.19e+00 | 0.0238 |
| 414062 | CCL3L3 | PTCwithHT_6 | Human | Thyroid | HT | 2.61e-10 | 4.84e-01 | 0.02 |
| 414062 | CCL3L3 | PTCwithHT_8 | Human | Thyroid | HT | 1.13e-41 | 1.28e+00 | 0.0351 |
| 414062 | CCL3L3 | PTCwithoutHT_2 | Human | Thyroid | PTC | 1.19e-10 | 5.66e-01 | 0.0419 |
| 414062 | CCL3L3 | PTCwithoutHT_7 | Human | Thyroid | PTC | 3.70e-17 | 1.24e+00 | 0.0381 |
| Page: 1 |
| Tissue | Expression Dynamics | Abbreviation |
| Oral Cavity | 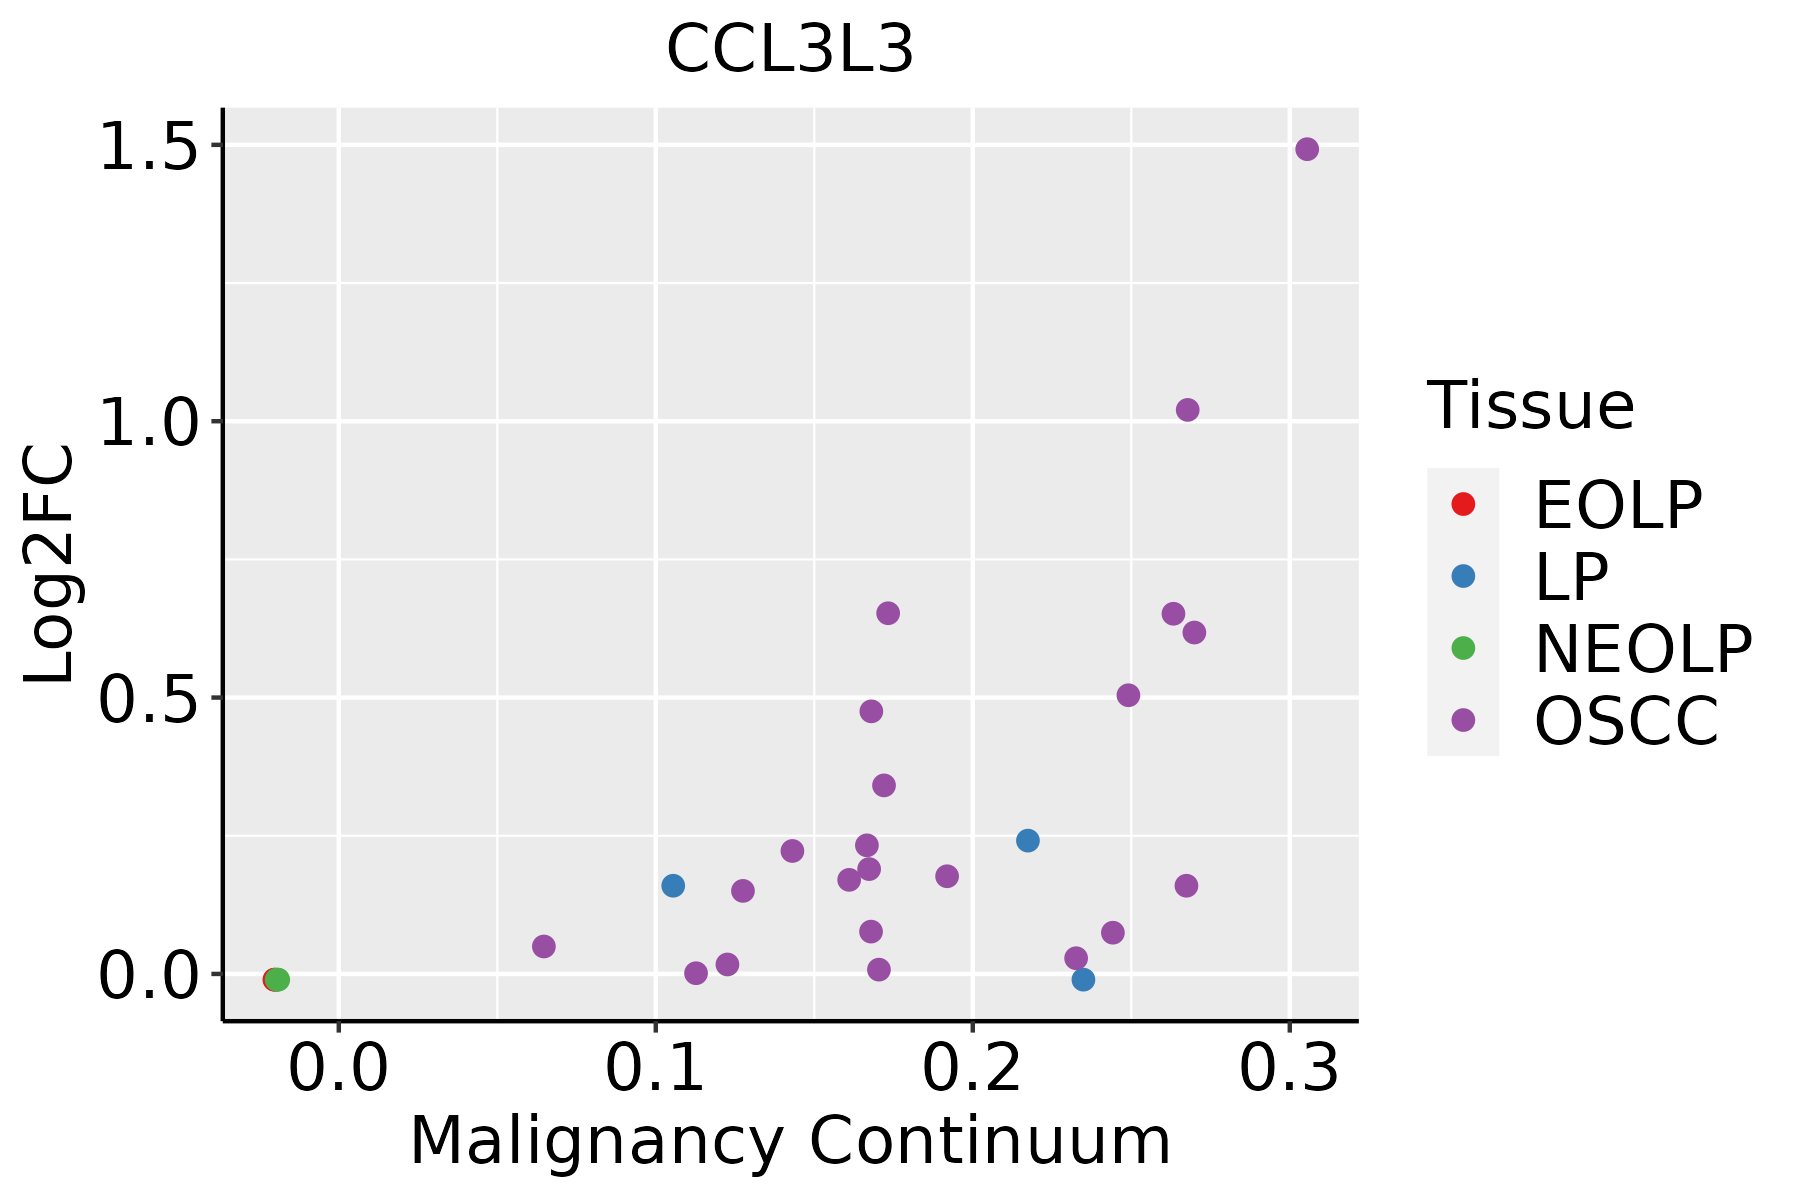 | EOLP: Erosive Oral lichen planus |
| LP: leukoplakia | ||
| NEOLP: Non-erosive oral lichen planus | ||
| OSCC: Oral squamous cell carcinoma | ||
| Thyroid | 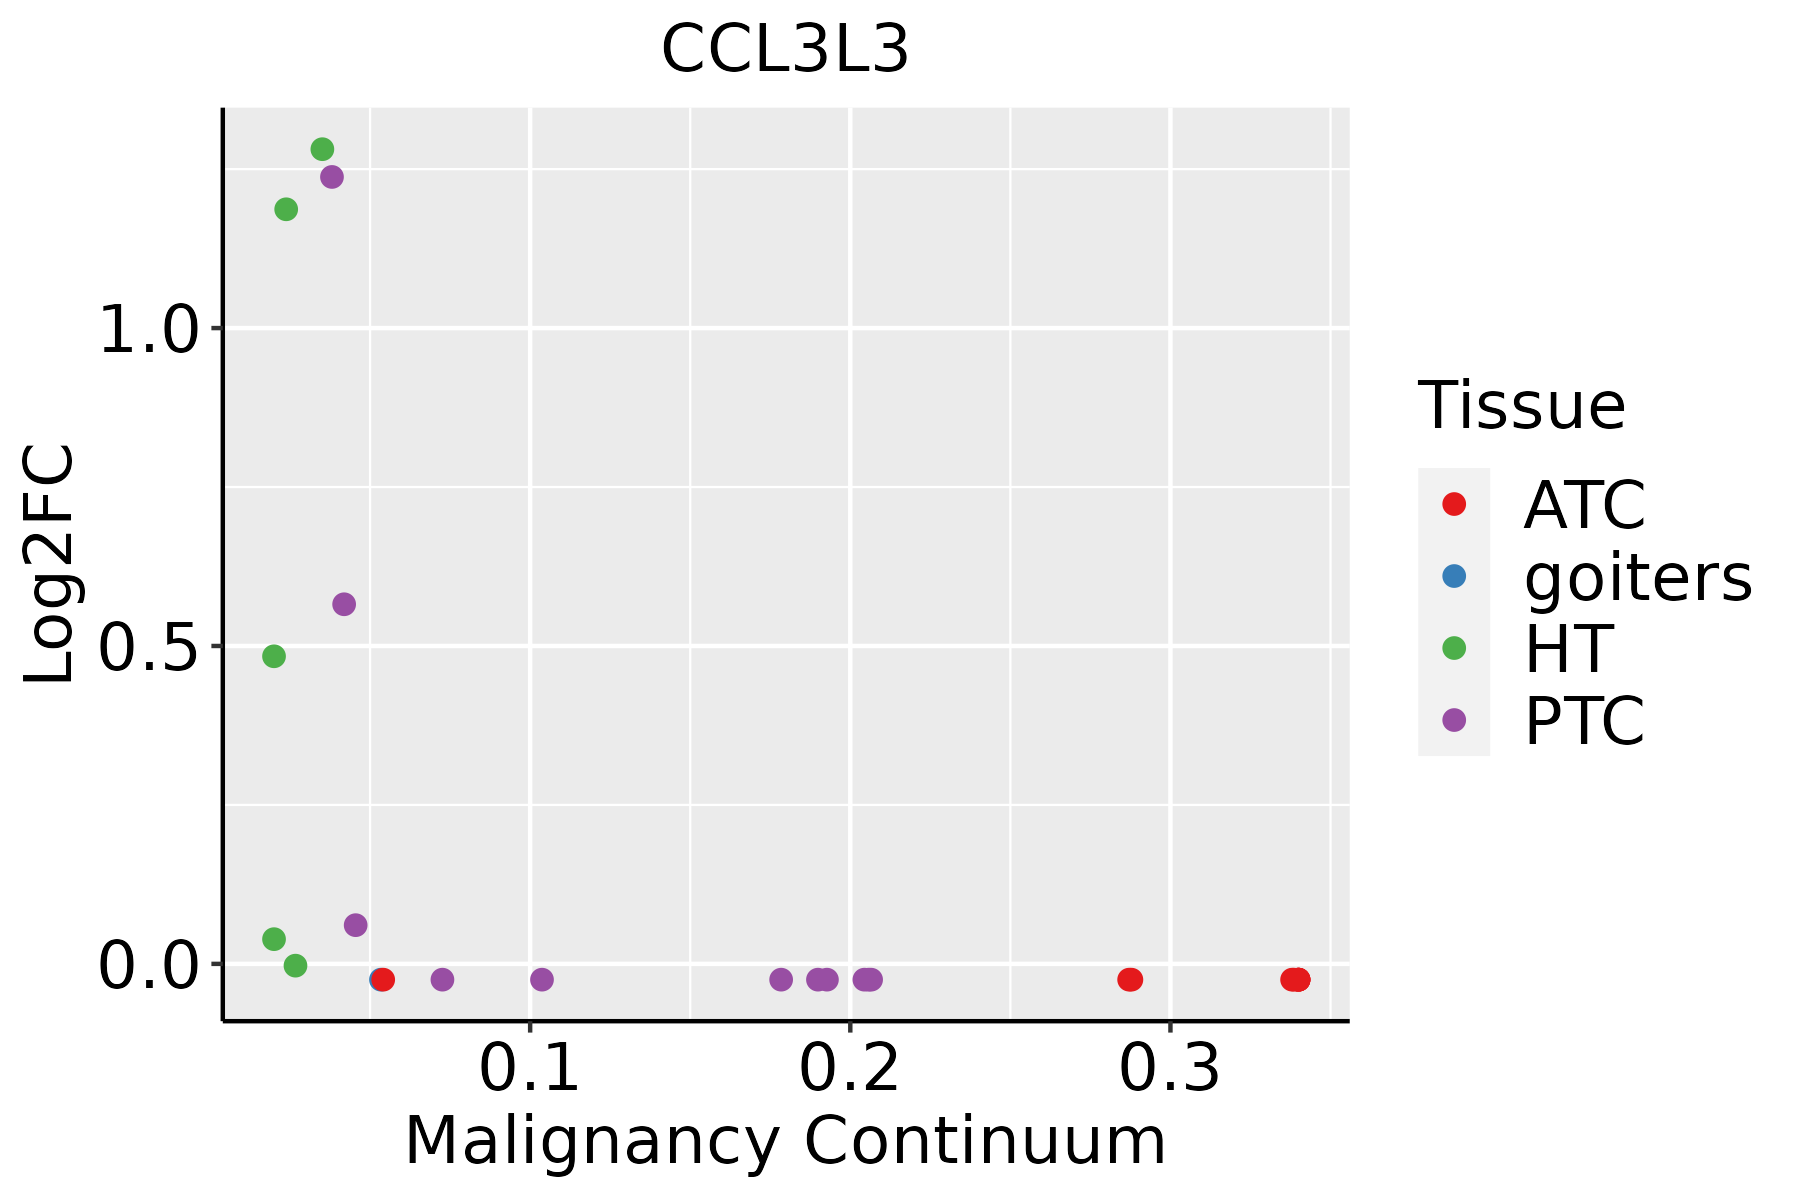 | ATC: Anaplastic thyroid cancer |
| HT: Hashimoto's thyroiditis | ||
| PTC: Papillary thyroid cancer |
| ∗log2FC in expression of this searched gene in stem-like cells from each diseased tissue sample relative to stem-like cells in normal samples in each tissue plotted against the malignancy continuum. Samples are colored based on if they are from different disease stage. |
Top |
Malignant transformation related pathway analysis |
| Find out the enriched GO biological processes and KEGG pathways involved in transition from healthy to precancer to cancer |
| Tissue | Disease Stage | Enriched GO biological Processes |
| Colorectum | AD |  |
| Colorectum | SER |  |
| Colorectum | MSS |  |
| Colorectum | MSI-H |  |
| Colorectum | FAP |  |
| ∗Top 15 enriched GO BP terms are showed in the bar plot of each disease state in each tissue. Each row represents a significant GO biological process which is colored according to the -log10(p.adjust). |
| Page: 1 2 3 4 5 6 7 8 9 |
| GO ID | Tissue | Disease Stage | Description | Gene Ratio | Bg Ratio | pvalue | p.adjust | Count |
| GO:003461218 | Oral cavity | OSCC | response to tumor necrosis factor | 143/7305 | 253/18723 | 1.09e-08 | 2.23e-07 | 143 |
| GO:007135618 | Oral cavity | OSCC | cellular response to tumor necrosis factor | 128/7305 | 229/18723 | 1.49e-07 | 2.49e-06 | 128 |
| GO:00343417 | Oral cavity | OSCC | response to interferon-gamma | 81/7305 | 141/18723 | 6.77e-06 | 7.43e-05 | 81 |
| GO:00192214 | Oral cavity | OSCC | cytokine-mediated signaling pathway | 222/7305 | 472/18723 | 2.02e-04 | 1.35e-03 | 222 |
| GO:00713465 | Oral cavity | OSCC | cellular response to interferon-gamma | 65/7305 | 118/18723 | 2.83e-04 | 1.79e-03 | 65 |
| GO:005090010 | Oral cavity | OSCC | leukocyte migration | 176/7305 | 369/18723 | 3.80e-04 | 2.31e-03 | 176 |
| GO:004308710 | Oral cavity | OSCC | regulation of GTPase activity | 165/7305 | 348/18723 | 7.94e-04 | 4.27e-03 | 165 |
| GO:00603269 | Oral cavity | OSCC | cell chemotaxis | 146/7305 | 310/18723 | 2.13e-03 | 9.80e-03 | 146 |
| GO:00705556 | Oral cavity | OSCC | response to interleukin-1 | 73/7305 | 143/18723 | 2.23e-03 | 1.00e-02 | 73 |
| GO:00305959 | Oral cavity | OSCC | leukocyte chemotaxis | 110/7305 | 230/18723 | 3.86e-03 | 1.58e-02 | 110 |
| GO:00713473 | Oral cavity | OSCC | cellular response to interleukin-1 | 58/7305 | 113/18723 | 5.14e-03 | 2.01e-02 | 58 |
| GO:00434107 | Oral cavity | OSCC | positive regulation of MAPK cascade | 213/7305 | 480/18723 | 8.71e-03 | 3.16e-02 | 213 |
| GO:00703716 | Oral cavity | OSCC | ERK1 and ERK2 cascade | 150/7305 | 330/18723 | 9.47e-03 | 3.38e-02 | 150 |
| GO:007162110 | Oral cavity | OSCC | granulocyte chemotaxis | 62/7305 | 125/18723 | 1.02e-02 | 3.52e-02 | 62 |
| GO:00703724 | Oral cavity | OSCC | regulation of ERK1 and ERK2 cascade | 140/7305 | 309/18723 | 1.34e-02 | 4.46e-02 | 140 |
| GO:006032616 | Thyroid | HT | cell chemotaxis | 40/1272 | 310/18723 | 6.97e-05 | 1.27e-03 | 40 |
| GO:00434109 | Thyroid | HT | positive regulation of MAPK cascade | 54/1272 | 480/18723 | 1.81e-04 | 2.68e-03 | 54 |
| GO:003059516 | Thyroid | HT | leukocyte chemotaxis | 30/1272 | 230/18723 | 4.46e-04 | 5.45e-03 | 30 |
| GO:00703718 | Thyroid | HT | ERK1 and ERK2 cascade | 39/1272 | 330/18723 | 5.27e-04 | 6.31e-03 | 39 |
| GO:003059315 | Thyroid | HT | neutrophil chemotaxis | 17/1272 | 103/18723 | 5.50e-04 | 6.52e-03 | 17 |
| Page: 1 2 |
| Pathway ID | Tissue | Disease Stage | Description | Gene Ratio | Bg Ratio | pvalue | p.adjust | qvalue | Count |
| hsa0516328 | Oral cavity | OSCC | Human cytomegalovirus infection | 139/3704 | 225/8465 | 2.77e-08 | 2.38e-07 | 1.21e-07 | 139 |
| hsa0541730 | Oral cavity | OSCC | Lipid and atherosclerosis | 131/3704 | 215/8465 | 2.20e-07 | 1.45e-06 | 7.37e-07 | 131 |
| hsa051424 | Oral cavity | OSCC | Chagas disease | 64/3704 | 102/8465 | 8.00e-05 | 2.95e-04 | 1.50e-04 | 64 |
| hsa0532318 | Oral cavity | OSCC | Rheumatoid arthritis | 56/3704 | 93/8465 | 9.72e-04 | 2.76e-03 | 1.40e-03 | 56 |
| hsa04620 | Oral cavity | OSCC | Toll-like receptor signaling pathway | 58/3704 | 104/8465 | 8.77e-03 | 1.98e-02 | 1.01e-02 | 58 |
| hsa05163112 | Oral cavity | OSCC | Human cytomegalovirus infection | 139/3704 | 225/8465 | 2.77e-08 | 2.38e-07 | 1.21e-07 | 139 |
| hsa05417113 | Oral cavity | OSCC | Lipid and atherosclerosis | 131/3704 | 215/8465 | 2.20e-07 | 1.45e-06 | 7.37e-07 | 131 |
| hsa0514212 | Oral cavity | OSCC | Chagas disease | 64/3704 | 102/8465 | 8.00e-05 | 2.95e-04 | 1.50e-04 | 64 |
| hsa0532319 | Oral cavity | OSCC | Rheumatoid arthritis | 56/3704 | 93/8465 | 9.72e-04 | 2.76e-03 | 1.40e-03 | 56 |
| hsa046201 | Oral cavity | OSCC | Toll-like receptor signaling pathway | 58/3704 | 104/8465 | 8.77e-03 | 1.98e-02 | 1.01e-02 | 58 |
| Page: 1 |
Top |
Cell-cell communication analysis |
| Identification of potential cell-cell interactions between two cell types and their ligand-receptor pairs for different disease states |
| Ligand | Receptor | LRpair | Pathway | Tissue | Disease Stage |
| CCL3L3 | CCR1 | CCL3L3_CCR1 | CCL | Cervix | Healthy |
| CCL3L3 | CCR1 | CCL3L3_CCR1 | CCL | Endometrium | Healthy |
| CCL3L3 | CCR1 | CCL3L3_CCR1 | CCL | HNSCC | OSCC |
| CCL3L3 | CCR1 | CCL3L3_CCR1 | CCL | Liver | Healthy |
| CCL3L3 | CCR1 | CCL3L3_CCR1 | CCL | Liver | Precancer |
| CCL3L3 | CCR1 | CCL3L3_CCR1 | CCL | Lung | ADJ |
| CCL3L3 | CCR1 | CCL3L3_CCR1 | CCL | Lung | IAC |
| Page: 1 |
Top |
Single-cell gene regulatory network inference analysis |
| Find out the significant the regulons (TFs) and the target genes of each regulon across cell types for different disease states |
| TF | Cell Type | Tissue | Disease Stage | Target Gene | RSS | Regulon Activity |
| ∗The dot plots of a searched regulon are shown for all cell subpopulations in each disease state of each tissue based on the regulon specific score inferred using pySCENIC and by calculating the average expression. |
| Page: 1 |
Top |
Somatic mutation of malignant transformation related genes |
| Annotation of somatic variants for genes involved in malignant transformation |
| Hugo Symbol | Variant Class | Variant Classification | dbSNP RS | HGVSc | HGVSp | HGVSp Short | SWISSPROT | BIOTYPE | SIFT | PolyPhen | Tumor Sample Barcode | Tissue | Histology | Sex | Age | Stage | Therapy Types | Drugs | Outcome |
| CCL3L3 | SNV | Missense_Mutation | novel | c.256N>A | p.Val86Ile | p.V86I | P16619 | protein_coding | tolerated(1) | benign(0.005) | TCGA-BH-A1FR-01 | Breast | breast invasive carcinoma | Female | >=65 | III/IV | Unknown | Unknown | PD |
| CCL3L3 | SNV | Missense_Mutation | novel | c.97N>A | p.Ala33Thr | p.A33T | P16619 | protein_coding | tolerated(0.07) | benign(0.21) | TCGA-A5-A0G1-01 | Endometrium | uterine corpus endometrioid carcinoma | Female | >=65 | I/II | Unknown | Unknown | SD |
| CCL3L3 | SNV | Missense_Mutation | novel | c.251N>C | p.Lys84Thr | p.K84T | P16619 | protein_coding | deleterious(0.03) | benign(0.026) | TCGA-A5-A0G2-01 | Endometrium | uterine corpus endometrioid carcinoma | Female | <65 | III/IV | Unknown | Unknown | SD |
| CCL3L3 | SNV | Missense_Mutation | novel | c.232N>G | p.Ser78Gly | p.S78G | P16619 | protein_coding | tolerated(0.05) | benign(0.049) | TCGA-AJ-A3EL-01 | Endometrium | uterine corpus endometrioid carcinoma | Female | <65 | I/II | Unknown | Unknown | SD |
| CCL3L3 | SNV | Missense_Mutation | novel | c.16N>T | p.Ala6Ser | p.A6S | P16619 | protein_coding | tolerated(0.07) | benign(0.153) | TCGA-AP-A1DK-01 | Endometrium | uterine corpus endometrioid carcinoma | Female | <65 | I/II | Unknown | Unknown | SD |
| CCL3L3 | SNV | Missense_Mutation | novel | c.275G>T | p.Ser92Ile | p.S92I | P16619 | protein_coding | deleterious(0.01) | benign(0.022) | TCGA-B5-A3FC-01 | Endometrium | uterine corpus endometrioid carcinoma | Female | <65 | I/II | Unknown | Unknown | SD |
| CCL3L3 | SNV | Missense_Mutation | novel | c.161C>T | p.Thr54Met | p.T54M | P16619 | protein_coding | deleterious(0) | probably_damaging(1) | TCGA-BS-A0UV-01 | Endometrium | uterine corpus endometrioid carcinoma | Female | <65 | III/IV | Unknown | Unknown | SD |
| CCL3L3 | SNV | Missense_Mutation | novel | c.256N>A | p.Val86Ile | p.V86I | P16619 | protein_coding | tolerated(1) | benign(0.005) | TCGA-E6-A1LX-01 | Endometrium | uterine corpus endometrioid carcinoma | Female | <65 | I/II | Unknown | Unknown | SD |
| CCL3L3 | SNV | Missense_Mutation | novel | c.10N>C | p.Ser4Pro | p.S4P | P16619 | protein_coding | tolerated(0.59) | benign(0.007) | TCGA-EO-A22R-01 | Endometrium | uterine corpus endometrioid carcinoma | Female | <65 | I/II | Unknown | Unknown | SD |
| CCL3L3 | SNV | Missense_Mutation | novel | c.97N>A | p.Ala33Thr | p.A33T | P16619 | protein_coding | tolerated(0.07) | benign(0.21) | TCGA-EY-A549-01 | Endometrium | uterine corpus endometrioid carcinoma | Female | >=65 | I/II | Unknown | Unknown | SD |
| Page: 1 2 |
Top |
Related drugs of malignant transformation related genes |
| Identification of chemicals and drugs interact with genes involved in malignant transfromation |
| (DGIdb 4.0) |
| Entrez ID | Symbol | Category | Interaction Types | Drug Claim Name | Drug Name | PMIDs |
| Page: 1 |

Copyright 2023-Present -The University of Texas Health Science Center at Houston |