
|
|||||
|
 | |
| |
| |
| |
| |
| |
|
Gene: CCL27 |
Gene summary for CCL27 |
| Gene information | Species | Human | Gene symbol | CCL27 | Gene ID | 10850 |
| Gene name | C-C motif chemokine ligand 27 | |
| Gene Alias | ALP | |
| Cytomap | 9p13.3 | |
| Gene Type | protein-coding | GO ID | GO:0002376 | UniProtAcc | Q5VZ77 |
Top |
Malignant transformation analysis |
| Identification of the aberrant gene expression in precancerous and cancerous lesions by comparing the gene expression of stem-like cells in diseased tissues with normal stem cells |
| Entrez ID | Symbol | Replicates | Species | Organ | Tissue | Adj P-value | Log2FC | Malignancy |
| 10850 | CCL27 | P1_S1_AK | Human | Skin | AK | 2.57e-12 | -5.11e-01 | -0.3399 |
| 10850 | CCL27 | P2_S3_AK | Human | Skin | AK | 2.60e-14 | -5.82e-01 | -0.3287 |
| 10850 | CCL27 | P2_S4_SCCIS | Human | Skin | SCCIS | 8.38e-09 | -4.46e-01 | -0.3043 |
| 10850 | CCL27 | P3_S6_AK | Human | Skin | AK | 5.00e-02 | -4.02e-01 | -0.3256 |
| 10850 | CCL27 | P4_S8_cSCC | Human | Skin | cSCC | 3.64e-04 | 4.13e-01 | -0.3095 |
| 10850 | CCL27 | P5_S10_cSCC | Human | Skin | cSCC | 5.40e-24 | -6.11e-01 | -0.299 |
| 10850 | CCL27 | P10_cSCC | Human | Skin | cSCC | 5.49e-04 | -1.32e-01 | 0.1017 |
| 10850 | CCL27 | cSCC_p1 | Human | Skin | cSCC | 2.14e-52 | 1.05e+00 | -0.1916 |
| 10850 | CCL27 | cSCC_p11 | Human | Skin | cSCC | 3.85e-38 | 9.00e-01 | -0.2102 |
| 10850 | CCL27 | cSCC_p3 | Human | Skin | cSCC | 7.20e-23 | -6.18e-01 | -0.2085 |
| 10850 | CCL27 | cSCC_p4 | Human | Skin | cSCC | 8.59e-21 | 7.68e-01 | -0.2022 |
| 10850 | CCL27 | cSCC_p7 | Human | Skin | cSCC | 3.69e-21 | 8.08e-01 | -0.2332 |
| 10850 | CCL27 | cSCC_p8 | Human | Skin | cSCC | 1.52e-12 | 4.89e-01 | -0.1971 |
| 10850 | CCL27 | cSCC_p9 | Human | Skin | cSCC | 5.98e-21 | 5.86e-01 | -0.1991 |
| Page: 1 |
| Tissue | Expression Dynamics | Abbreviation |
| Skin | 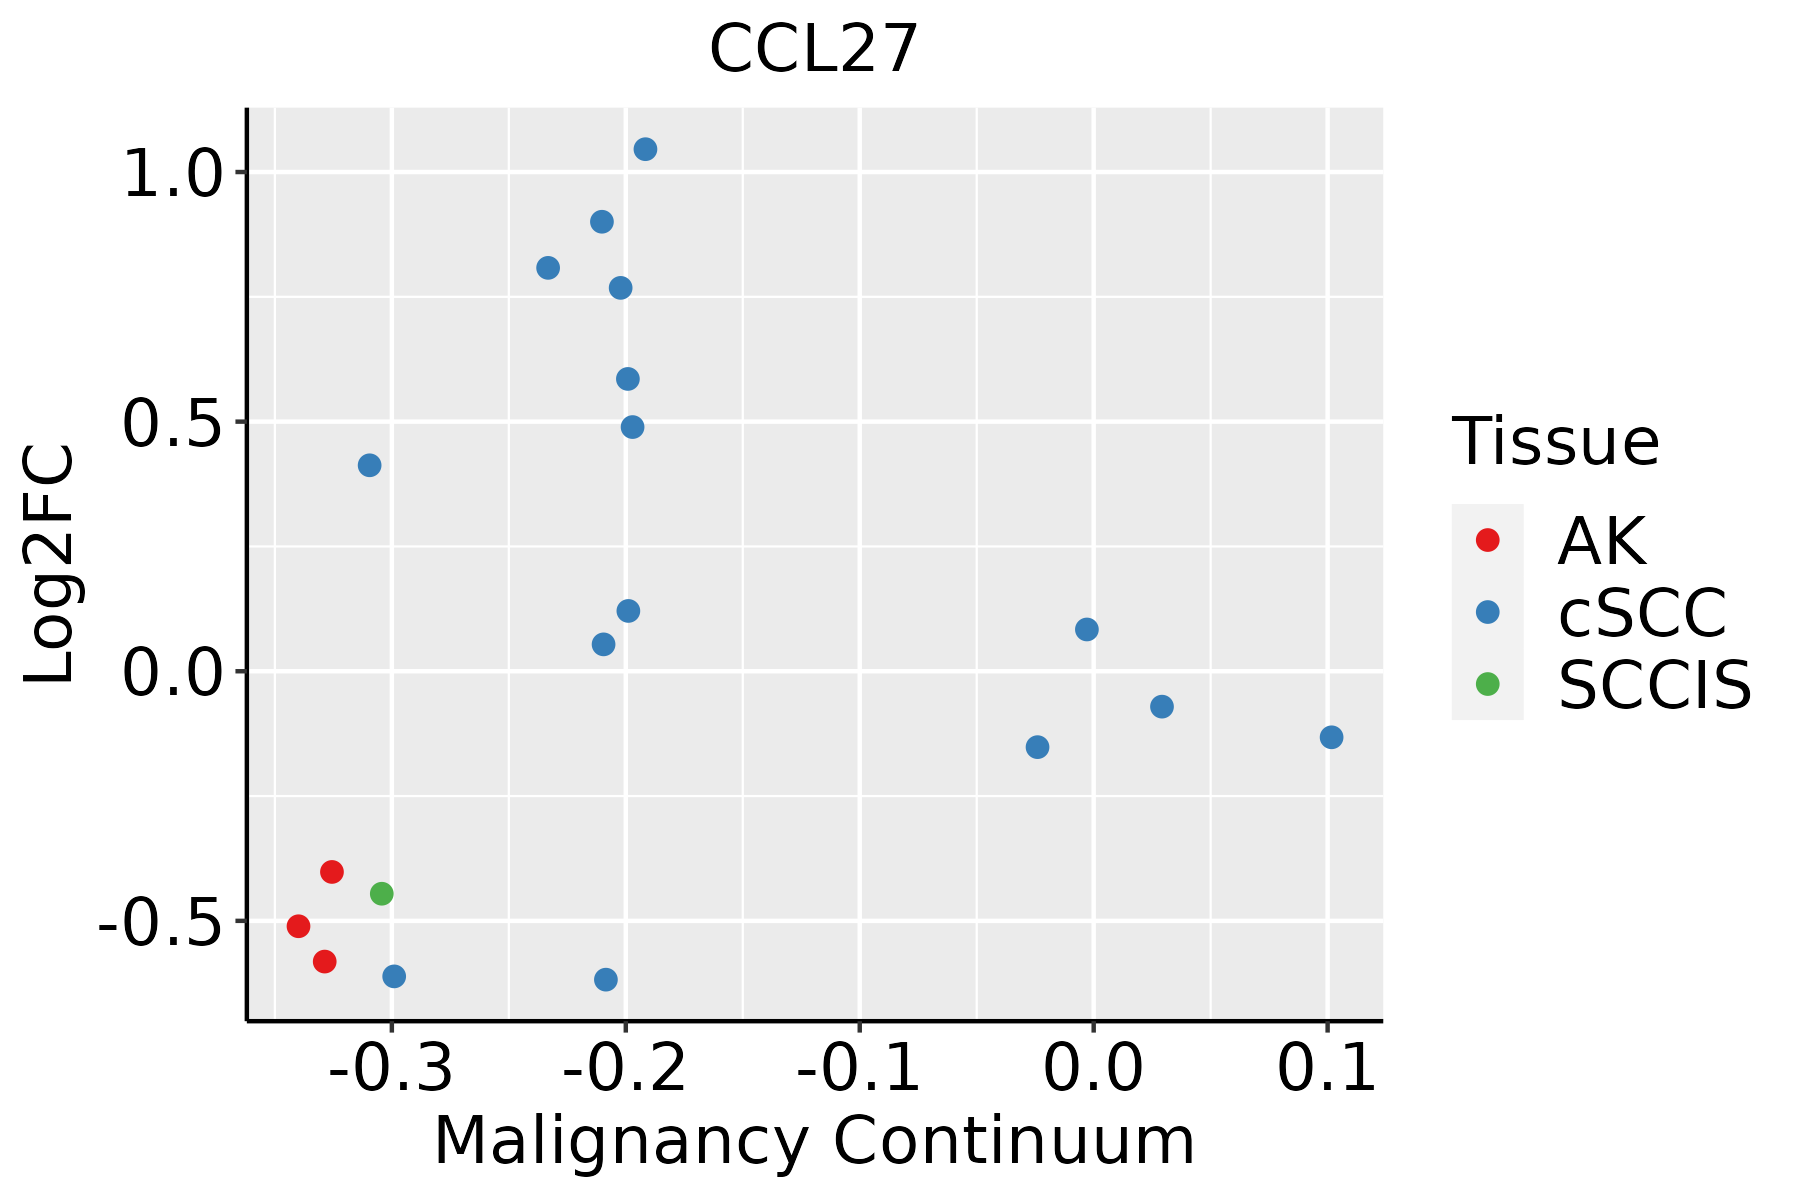 | AK: Actinic keratosis |
| cSCC: Cutaneous squamous cell carcinoma | ||
| SCCIS:squamous cell carcinoma in situ |
| ∗log2FC in expression of this searched gene in stem-like cells from each diseased tissue sample relative to stem-like cells in normal samples in each tissue plotted against the malignancy continuum. Samples are colored based on if they are from different disease stage. |
Top |
Malignant transformation related pathway analysis |
| Find out the enriched GO biological processes and KEGG pathways involved in transition from healthy to precancer to cancer |
| Tissue | Disease Stage | Enriched GO biological Processes |
| Colorectum | AD |  |
| Colorectum | SER |  |
| Colorectum | MSS |  |
| Colorectum | MSI-H |  |
| Colorectum | FAP |  |
| ∗Top 15 enriched GO BP terms are showed in the bar plot of each disease state in each tissue. Each row represents a significant GO biological process which is colored according to the -log10(p.adjust). |
| Page: 1 2 3 4 5 6 7 8 9 |
| GO ID | Tissue | Disease Stage | Description | Gene Ratio | Bg Ratio | pvalue | p.adjust | Count |
| GO:003297028 | Skin | AK | regulation of actin filament-based process | 76/1910 | 397/18723 | 4.61e-08 | 2.37e-06 | 76 |
| GO:003295628 | Skin | AK | regulation of actin cytoskeleton organization | 66/1910 | 358/18723 | 1.40e-06 | 4.26e-05 | 66 |
| GO:00509205 | Skin | AK | regulation of chemotaxis | 46/1910 | 223/18723 | 2.56e-06 | 6.91e-05 | 46 |
| GO:00321038 | Skin | AK | positive regulation of response to external stimulus | 74/1910 | 427/18723 | 3.63e-06 | 9.07e-05 | 74 |
| GO:00509217 | Skin | AK | positive regulation of chemotaxis | 31/1910 | 141/18723 | 2.92e-05 | 5.02e-04 | 31 |
| GO:005090015 | Skin | AK | leukocyte migration | 63/1910 | 369/18723 | 3.00e-05 | 5.15e-04 | 63 |
| GO:00726784 | Skin | AK | T cell migration | 18/1910 | 66/18723 | 7.51e-05 | 1.06e-03 | 18 |
| GO:000268516 | Skin | AK | regulation of leukocyte migration | 40/1910 | 210/18723 | 7.55e-05 | 1.06e-03 | 40 |
| GO:00716759 | Skin | AK | regulation of mononuclear cell migration | 26/1910 | 115/18723 | 7.60e-05 | 1.07e-03 | 26 |
| GO:000268716 | Skin | AK | positive regulation of leukocyte migration | 29/1910 | 135/18723 | 8.10e-05 | 1.11e-03 | 29 |
| GO:000268815 | Skin | AK | regulation of leukocyte chemotaxis | 27/1910 | 122/18723 | 8.24e-05 | 1.13e-03 | 27 |
| GO:005149525 | Skin | AK | positive regulation of cytoskeleton organization | 42/1910 | 226/18723 | 9.07e-05 | 1.23e-03 | 42 |
| GO:006032610 | Skin | AK | cell chemotaxis | 53/1910 | 310/18723 | 1.20e-04 | 1.50e-03 | 53 |
| GO:003059510 | Skin | AK | leukocyte chemotaxis | 42/1910 | 230/18723 | 1.36e-04 | 1.68e-03 | 42 |
| GO:00026909 | Skin | AK | positive regulation of leukocyte chemotaxis | 22/1910 | 94/18723 | 1.55e-04 | 1.84e-03 | 22 |
| GO:01401312 | Skin | AK | positive regulation of lymphocyte chemotaxis | 8/1910 | 19/18723 | 3.11e-04 | 3.19e-03 | 8 |
| GO:0010820 | Skin | AK | positive regulation of T cell chemotaxis | 7/1910 | 15/18723 | 3.49e-04 | 3.48e-03 | 7 |
| GO:20004064 | Skin | AK | positive regulation of T cell migration | 10/1910 | 29/18723 | 3.86e-04 | 3.70e-03 | 10 |
| GO:003153219 | Skin | AK | actin cytoskeleton reorganization | 23/1910 | 107/18723 | 4.20e-04 | 4.00e-03 | 23 |
| GO:20004034 | Skin | AK | positive regulation of lymphocyte migration | 11/1910 | 35/18723 | 4.96e-04 | 4.58e-03 | 11 |
| Page: 1 2 3 4 |
| Pathway ID | Tissue | Disease Stage | Description | Gene Ratio | Bg Ratio | pvalue | p.adjust | qvalue | Count |
| Page: 1 |
Top |
Cell-cell communication analysis |
| Identification of potential cell-cell interactions between two cell types and their ligand-receptor pairs for different disease states |
| Ligand | Receptor | LRpair | Pathway | Tissue | Disease Stage |
| Page: 1 |
Top |
Single-cell gene regulatory network inference analysis |
| Find out the significant the regulons (TFs) and the target genes of each regulon across cell types for different disease states |
| TF | Cell Type | Tissue | Disease Stage | Target Gene | RSS | Regulon Activity |
| ∗The dot plots of a searched regulon are shown for all cell subpopulations in each disease state of each tissue based on the regulon specific score inferred using pySCENIC and by calculating the average expression. |
| Page: 1 |
Top |
Somatic mutation of malignant transformation related genes |
| Annotation of somatic variants for genes involved in malignant transformation |
| Hugo Symbol | Variant Class | Variant Classification | dbSNP RS | HGVSc | HGVSp | HGVSp Short | SWISSPROT | BIOTYPE | SIFT | PolyPhen | Tumor Sample Barcode | Tissue | Histology | Sex | Age | Stage | Therapy Types | Drugs | Outcome |
| CCL27 | SNV | Missense_Mutation | novel | c.243N>T | p.Gln81His | p.Q81H | Q9Y4X3 | protein_coding | tolerated(0.7) | probably_damaging(0.969) | TCGA-AN-A046-01 | Breast | breast invasive carcinoma | Female | >=65 | I/II | Unknown | Unknown | SD |
| CCL27 | SNV | Missense_Mutation | rs754147532 | c.220C>T | p.Arg74Cys | p.R74C | Q9Y4X3 | protein_coding | deleterious(0) | probably_damaging(0.968) | TCGA-A6-2686-01 | Colorectum | colon adenocarcinoma | Female | >=65 | I/II | Unknown | Unknown | SD |
| CCL27 | SNV | Missense_Mutation | c.301N>A | p.Pro101Thr | p.P101T | Q9Y4X3 | protein_coding | tolerated_low_confidence(0.08) | benign(0.217) | TCGA-AA-3977-01 | Colorectum | colon adenocarcinoma | Male | >=65 | I/II | Unknown | Unknown | SD | |
| CCL27 | SNV | Missense_Mutation | rs777698595 | c.116N>A | p.Arg39Gln | p.R39Q | Q9Y4X3 | protein_coding | tolerated(0.15) | benign(0.082) | TCGA-EI-6917-01 | Colorectum | rectum adenocarcinoma | Male | <65 | III/IV | Chemotherapy | 5fluorouracil+oxaciplatina+l-folinian | SD |
| CCL27 | SNV | Missense_Mutation | novel | c.266N>C | p.Phe89Ser | p.F89S | Q9Y4X3 | protein_coding | deleterious(0.03) | possibly_damaging(0.856) | TCGA-B5-A1MR-01 | Endometrium | uterine corpus endometrioid carcinoma | Female | >=65 | III/IV | Unknown | Unknown | SD |
| CCL27 | SNV | Missense_Mutation | rs777698595 | c.116N>A | p.Arg39Gln | p.R39Q | Q9Y4X3 | protein_coding | tolerated(0.15) | benign(0.082) | TCGA-56-A5DR-01 | Lung | lung squamous cell carcinoma | Male | >=65 | I/II | Unknown | Unknown | SD |
| CCL27 | SNV | Missense_Mutation | c.95N>T | p.Ala32Val | p.A32V | Q9Y4X3 | protein_coding | deleterious(0) | benign(0.098) | TCGA-BR-8680-01 | Stomach | stomach adenocarcinoma | Male | <65 | III/IV | Chemotherapy | oxaliplatin | CR |
| Page: 1 |
Top |
Related drugs of malignant transformation related genes |
| Identification of chemicals and drugs interact with genes involved in malignant transfromation |
| (DGIdb 4.0) |
| Entrez ID | Symbol | Category | Interaction Types | Drug Claim Name | Drug Name | PMIDs |
| Page: 1 |

Copyright 2023-Present -The University of Texas Health Science Center at Houston |