
|
|||||
|
 | |
| |
| |
| |
| |
| |
|
Gene: CCL20 |
Gene summary for CCL20 |
| Gene information | Species | Human | Gene symbol | CCL20 | Gene ID | 6364 |
| Gene name | C-C motif chemokine ligand 20 | |
| Gene Alias | CKb4 | |
| Cytomap | 2q36.3 | |
| Gene Type | protein-coding | GO ID | GO:0000165 | UniProtAcc | P78556 |
Top |
Malignant transformation analysis |
| Identification of the aberrant gene expression in precancerous and cancerous lesions by comparing the gene expression of stem-like cells in diseased tissues with normal stem cells |
| Entrez ID | Symbol | Replicates | Species | Organ | Tissue | Adj P-value | Log2FC | Malignancy |
| 6364 | CCL20 | AEH-subject1 | Human | Endometrium | AEH | 4.37e-21 | 6.00e-01 | -0.3059 |
| 6364 | CCL20 | AEH-subject2 | Human | Endometrium | AEH | 1.83e-09 | 4.40e-01 | -0.2525 |
| 6364 | CCL20 | AEH-subject3 | Human | Endometrium | AEH | 4.27e-05 | 2.22e-01 | -0.2576 |
| 6364 | CCL20 | AEH-subject4 | Human | Endometrium | AEH | 1.68e-28 | 9.46e-01 | -0.2657 |
| 6364 | CCL20 | AEH-subject5 | Human | Endometrium | AEH | 2.81e-19 | 5.03e-01 | -0.2953 |
| 6364 | CCL20 | EEC-subject2 | Human | Endometrium | EEC | 3.82e-33 | 6.97e-01 | -0.2607 |
| 6364 | CCL20 | EEC-subject3 | Human | Endometrium | EEC | 3.00e-11 | 4.09e-01 | -0.2525 |
| 6364 | CCL20 | EEC-subject4 | Human | Endometrium | EEC | 7.02e-06 | 2.38e-01 | -0.2571 |
| 6364 | CCL20 | GSM5276934 | Human | Endometrium | EEC | 1.28e-02 | 1.52e-01 | -0.0913 |
| 6364 | CCL20 | GSM6177623_NYU_UCEC3_Vis | Human | Endometrium | EEC | 4.10e-02 | 1.92e-01 | -0.1269 |
| 6364 | CCL20 | LZE8T | Human | Esophagus | ESCC | 5.52e-11 | 2.00e+00 | 0.067 |
| 6364 | CCL20 | LZE20T | Human | Esophagus | ESCC | 1.61e-02 | 7.61e-01 | 0.0662 |
| 6364 | CCL20 | LZE21T | Human | Esophagus | ESCC | 8.51e-06 | 1.98e+00 | 0.0655 |
| 6364 | CCL20 | LZE6T | Human | Esophagus | ESCC | 9.69e-05 | 1.47e+00 | 0.0845 |
| 6364 | CCL20 | P1T-E | Human | Esophagus | ESCC | 7.21e-08 | 2.34e+00 | 0.0875 |
| 6364 | CCL20 | P5T-E | Human | Esophagus | ESCC | 2.41e-04 | 9.59e-01 | 0.1327 |
| 6364 | CCL20 | P8T-E | Human | Esophagus | ESCC | 3.81e-08 | 1.32e+00 | 0.0889 |
| 6364 | CCL20 | P20T-E | Human | Esophagus | ESCC | 8.45e-04 | 1.59e+00 | 0.1124 |
| 6364 | CCL20 | P21T-E | Human | Esophagus | ESCC | 3.28e-06 | 1.57e+00 | 0.1617 |
| 6364 | CCL20 | P23T-E | Human | Esophagus | ESCC | 4.19e-30 | 4.24e+00 | 0.108 |
| Page: 1 2 3 4 5 |
| Tissue | Expression Dynamics | Abbreviation |
| Endometrium |  | AEH: Atypical endometrial hyperplasia |
| EEC: Endometrioid Cancer | ||
| Esophagus | 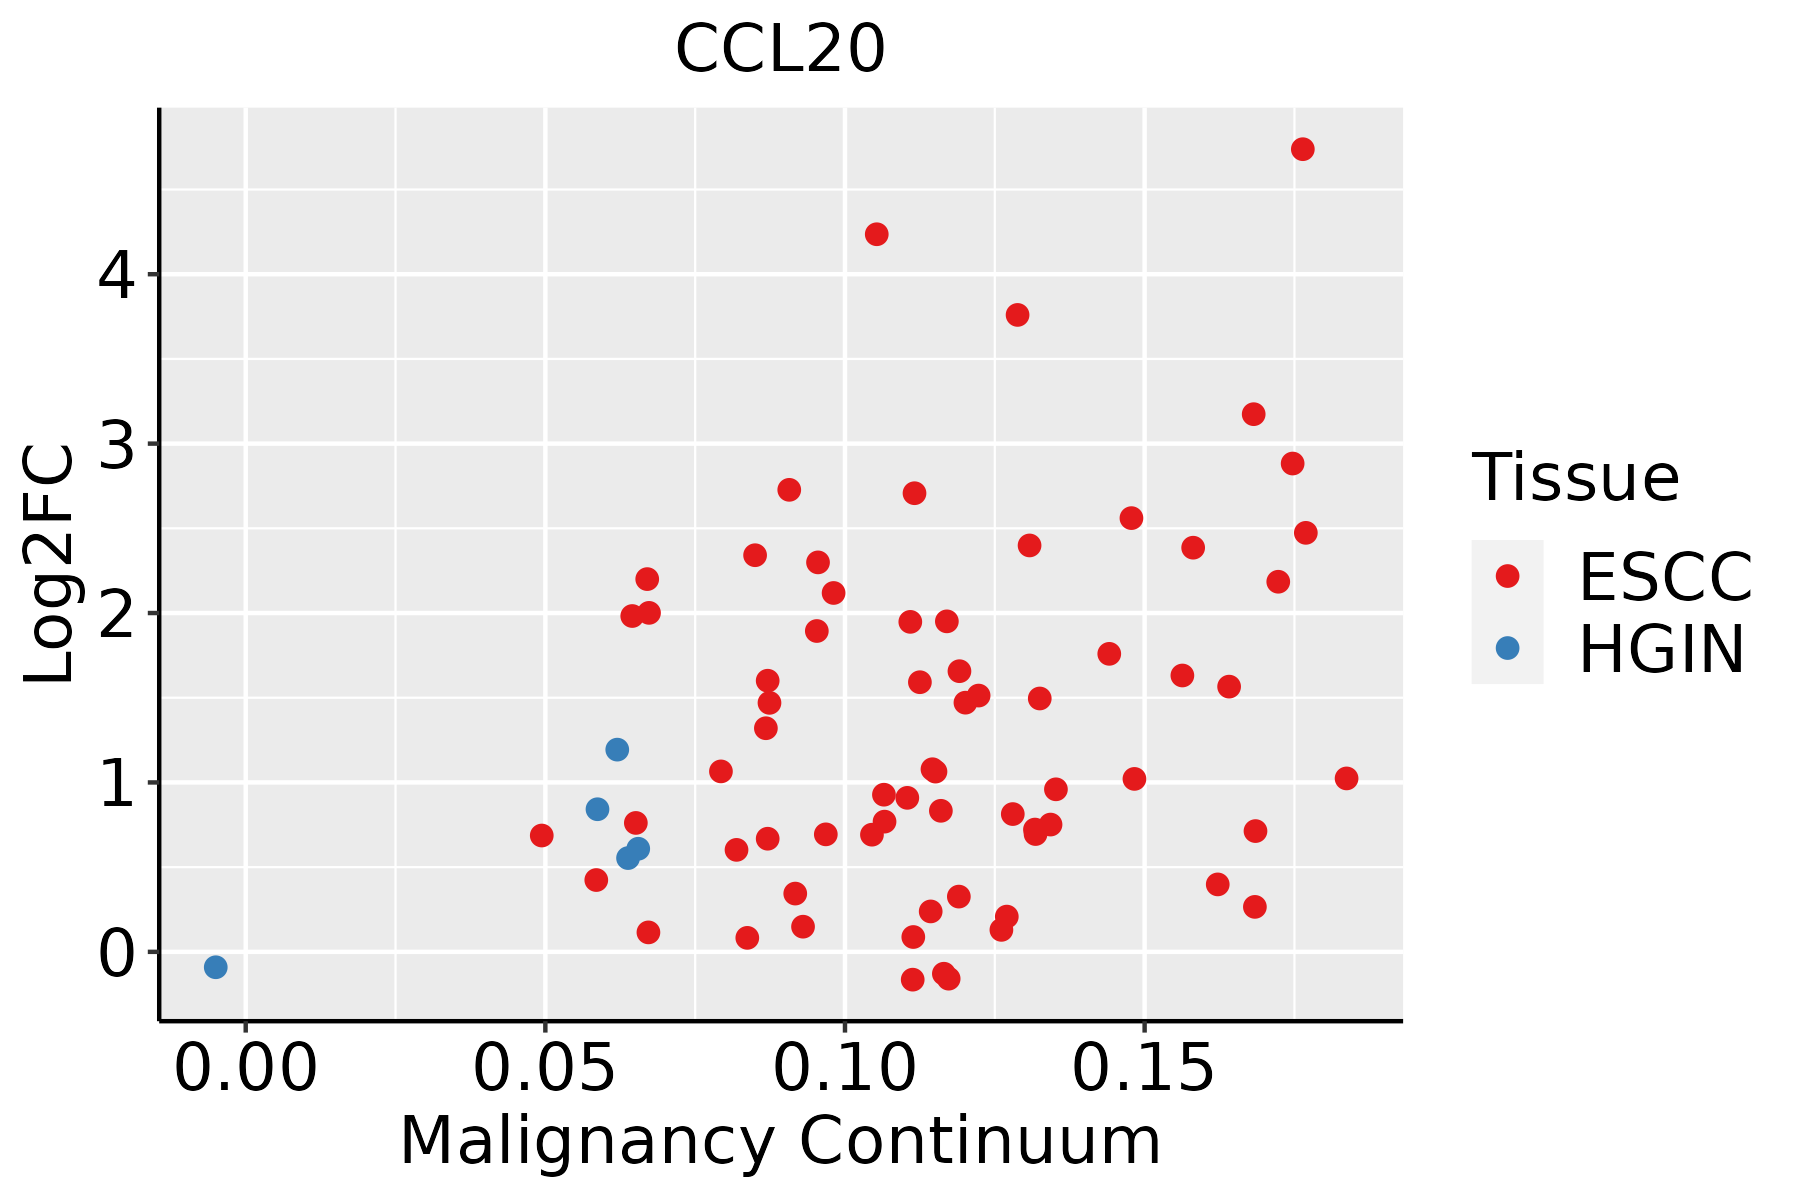 | ESCC: Esophageal squamous cell carcinoma |
| HGIN: High-grade intraepithelial neoplasias | ||
| LGIN: Low-grade intraepithelial neoplasias | ||
| GC |  | CAG: Chronic atrophic gastritis |
| CAG with IM: Chronic atrophic gastritis with intestinal metaplasia | ||
| CSG: Chronic superficial gastritis | ||
| GC: Gastric cancer | ||
| SIM: Severe intestinal metaplasia | ||
| WIM: Wild intestinal metaplasia | ||
| Liver |  | HCC: Hepatocellular carcinoma |
| NAFLD: Non-alcoholic fatty liver disease | ||
| Oral Cavity | 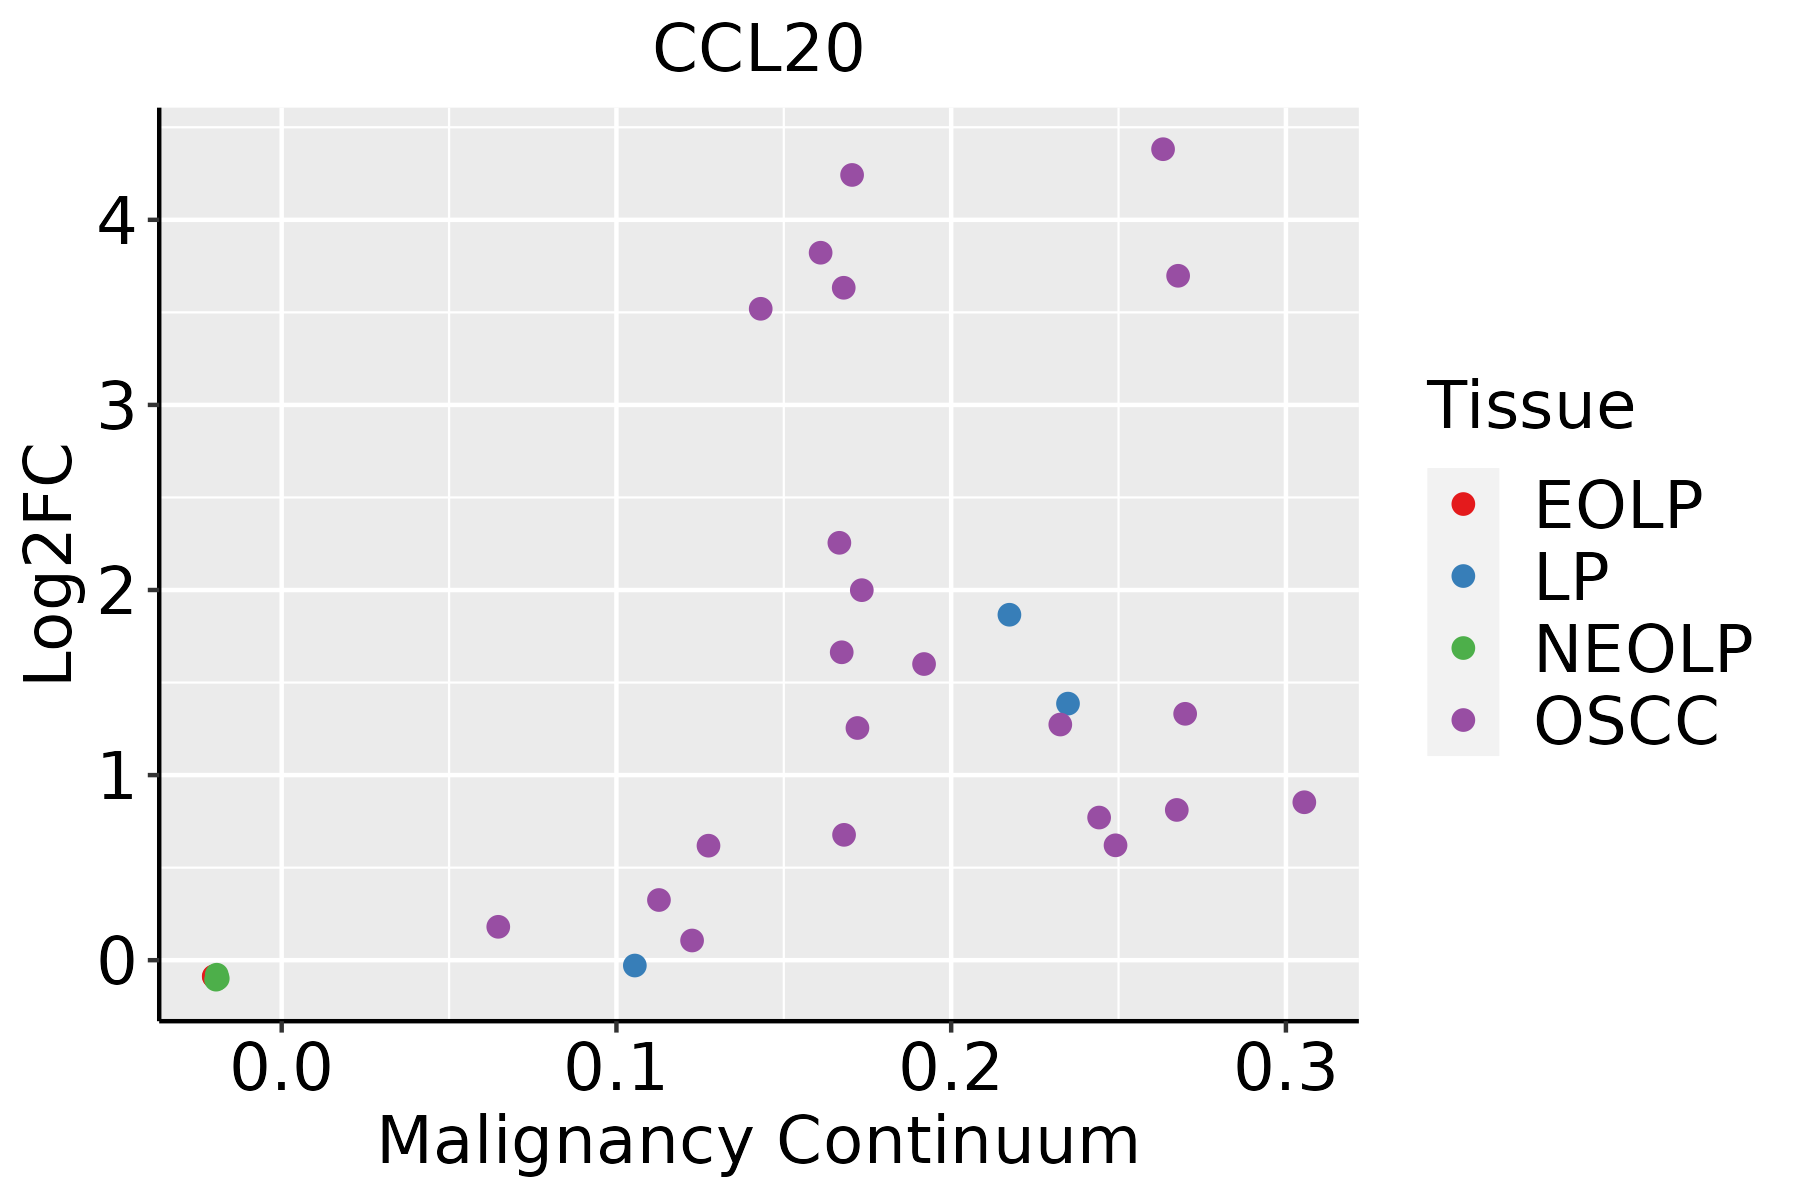 | EOLP: Erosive Oral lichen planus |
| LP: leukoplakia | ||
| NEOLP: Non-erosive oral lichen planus | ||
| OSCC: Oral squamous cell carcinoma | ||
| Skin | 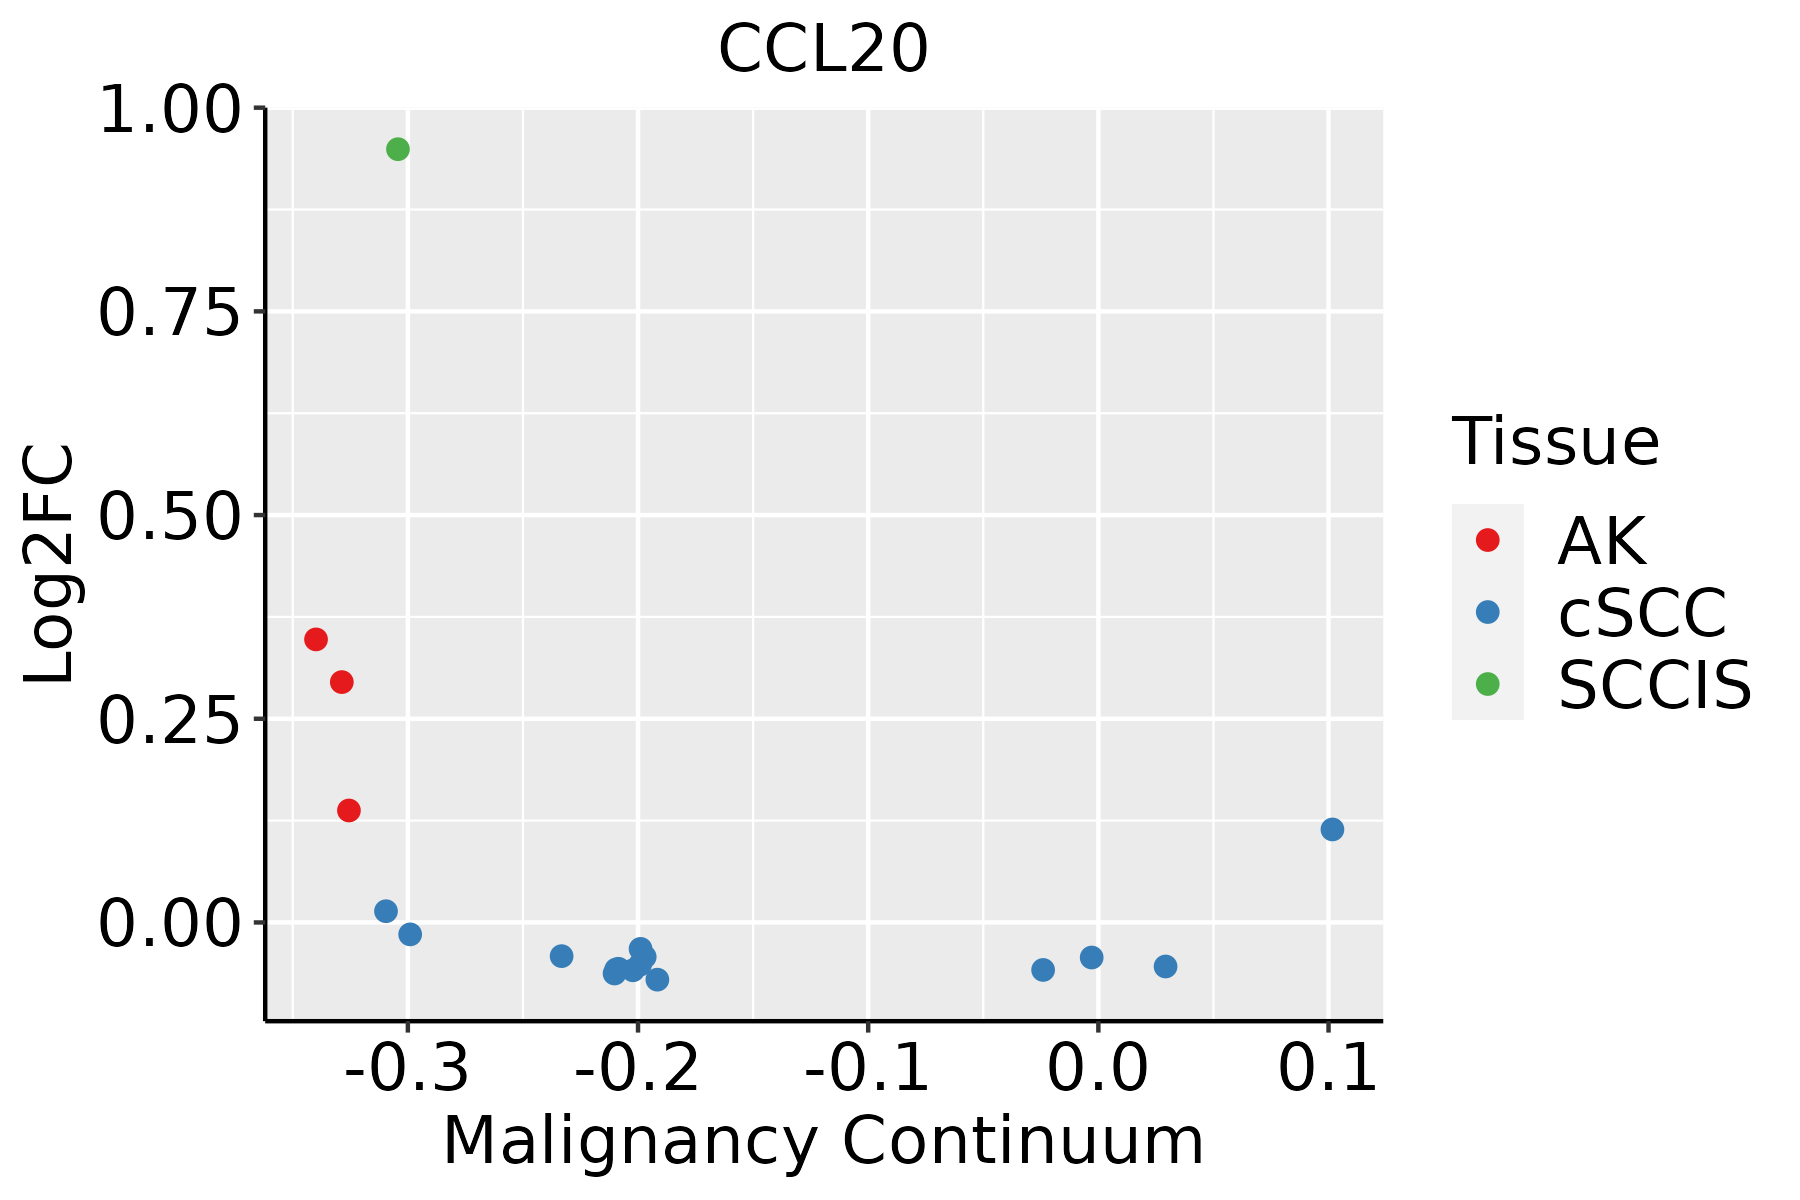 | AK: Actinic keratosis |
| cSCC: Cutaneous squamous cell carcinoma | ||
| SCCIS:squamous cell carcinoma in situ | ||
| Thyroid |  | ATC: Anaplastic thyroid cancer |
| HT: Hashimoto's thyroiditis | ||
| PTC: Papillary thyroid cancer |
| ∗log2FC in expression of this searched gene in stem-like cells from each diseased tissue sample relative to stem-like cells in normal samples in each tissue plotted against the malignancy continuum. Samples are colored based on if they are from different disease stage. |
Top |
Malignant transformation related pathway analysis |
| Find out the enriched GO biological processes and KEGG pathways involved in transition from healthy to precancer to cancer |
| Tissue | Disease Stage | Enriched GO biological Processes |
| Colorectum | AD |  |
| Colorectum | SER |  |
| Colorectum | MSS |  |
| Colorectum | MSI-H |  |
| Colorectum | FAP |  |
| ∗Top 15 enriched GO BP terms are showed in the bar plot of each disease state in each tissue. Each row represents a significant GO biological process which is colored according to the -log10(p.adjust). |
| Page: 1 2 3 4 5 6 7 8 9 |
| GO ID | Tissue | Disease Stage | Description | Gene Ratio | Bg Ratio | pvalue | p.adjust | Count |
| GO:00430878 | Endometrium | AEH | regulation of GTPase activity | 66/2100 | 348/18723 | 1.26e-05 | 2.77e-04 | 66 |
| GO:00434105 | Endometrium | AEH | positive regulation of MAPK cascade | 84/2100 | 480/18723 | 2.19e-05 | 4.25e-04 | 84 |
| GO:00435477 | Endometrium | AEH | positive regulation of GTPase activity | 48/2100 | 255/18723 | 2.18e-04 | 2.67e-03 | 48 |
| GO:00509008 | Endometrium | AEH | leukocyte migration | 64/2100 | 369/18723 | 2.57e-04 | 3.04e-03 | 64 |
| GO:00026858 | Endometrium | AEH | regulation of leukocyte migration | 39/2100 | 210/18723 | 1.06e-03 | 9.33e-03 | 39 |
| GO:00603268 | Endometrium | AEH | cell chemotaxis | 53/2100 | 310/18723 | 1.16e-03 | 1.01e-02 | 53 |
| GO:007135610 | Endometrium | AEH | cellular response to tumor necrosis factor | 41/2100 | 229/18723 | 1.66e-03 | 1.36e-02 | 41 |
| GO:00305958 | Endometrium | AEH | leukocyte chemotaxis | 41/2100 | 230/18723 | 1.81e-03 | 1.44e-02 | 41 |
| GO:003461210 | Endometrium | AEH | response to tumor necrosis factor | 44/2100 | 253/18723 | 2.08e-03 | 1.61e-02 | 44 |
| GO:00975299 | Endometrium | AEH | myeloid leukocyte migration | 39/2100 | 220/18723 | 2.55e-03 | 1.88e-02 | 39 |
| GO:00026879 | Endometrium | AEH | positive regulation of leukocyte migration | 26/2100 | 135/18723 | 4.06e-03 | 2.70e-02 | 26 |
| GO:00716756 | Endometrium | AEH | regulation of mononuclear cell migration | 22/2100 | 115/18723 | 8.42e-03 | 4.60e-02 | 22 |
| GO:00705555 | Endometrium | AEH | response to interleukin-1 | 26/2100 | 143/18723 | 8.78e-03 | 4.78e-02 | 26 |
| GO:004341011 | Endometrium | EEC | positive regulation of MAPK cascade | 89/2168 | 480/18723 | 4.21e-06 | 1.08e-04 | 89 |
| GO:004308712 | Endometrium | EEC | regulation of GTPase activity | 67/2168 | 348/18723 | 1.84e-05 | 3.43e-04 | 67 |
| GO:005090013 | Endometrium | EEC | leukocyte migration | 67/2168 | 369/18723 | 1.19e-04 | 1.59e-03 | 67 |
| GO:004354712 | Endometrium | EEC | positive regulation of GTPase activity | 50/2168 | 255/18723 | 1.26e-04 | 1.66e-03 | 50 |
| GO:007135615 | Endometrium | EEC | cellular response to tumor necrosis factor | 45/2168 | 229/18723 | 2.54e-04 | 2.94e-03 | 45 |
| GO:003461215 | Endometrium | EEC | response to tumor necrosis factor | 48/2168 | 253/18723 | 3.77e-04 | 4.03e-03 | 48 |
| GO:000268513 | Endometrium | EEC | regulation of leukocyte migration | 41/2168 | 210/18723 | 5.35e-04 | 5.38e-03 | 41 |
| Page: 1 2 3 4 5 6 7 8 9 10 |
| Pathway ID | Tissue | Disease Stage | Description | Gene Ratio | Bg Ratio | pvalue | p.adjust | qvalue | Count |
| hsa0532316 | Endometrium | AEH | Rheumatoid arthritis | 23/1197 | 93/8465 | 4.43e-03 | 2.46e-02 | 1.80e-02 | 23 |
| hsa0532317 | Endometrium | AEH | Rheumatoid arthritis | 23/1197 | 93/8465 | 4.43e-03 | 2.46e-02 | 1.80e-02 | 23 |
| hsa0532323 | Endometrium | EEC | Rheumatoid arthritis | 24/1237 | 93/8465 | 3.14e-03 | 1.78e-02 | 1.33e-02 | 24 |
| hsa046687 | Endometrium | EEC | TNF signaling pathway | 27/1237 | 114/8465 | 6.47e-03 | 3.22e-02 | 2.40e-02 | 27 |
| hsa0465720 | Endometrium | EEC | IL-17 signaling pathway | 23/1237 | 94/8465 | 7.61e-03 | 3.63e-02 | 2.71e-02 | 23 |
| hsa0532333 | Endometrium | EEC | Rheumatoid arthritis | 24/1237 | 93/8465 | 3.14e-03 | 1.78e-02 | 1.33e-02 | 24 |
| hsa0466814 | Endometrium | EEC | TNF signaling pathway | 27/1237 | 114/8465 | 6.47e-03 | 3.22e-02 | 2.40e-02 | 27 |
| hsa04657110 | Endometrium | EEC | IL-17 signaling pathway | 23/1237 | 94/8465 | 7.61e-03 | 3.63e-02 | 2.71e-02 | 23 |
| hsa0466810 | Esophagus | ESCC | TNF signaling pathway | 89/4205 | 114/8465 | 3.36e-10 | 4.01e-09 | 2.06e-09 | 89 |
| hsa0465727 | Esophagus | ESCC | IL-17 signaling pathway | 66/4205 | 94/8465 | 3.93e-05 | 1.75e-04 | 8.99e-05 | 66 |
| hsa0532320 | Esophagus | ESCC | Rheumatoid arthritis | 59/4205 | 93/8465 | 4.98e-03 | 1.27e-02 | 6.52e-03 | 59 |
| hsa0466817 | Esophagus | ESCC | TNF signaling pathway | 89/4205 | 114/8465 | 3.36e-10 | 4.01e-09 | 2.06e-09 | 89 |
| hsa0465734 | Esophagus | ESCC | IL-17 signaling pathway | 66/4205 | 94/8465 | 3.93e-05 | 1.75e-04 | 8.99e-05 | 66 |
| hsa05323110 | Esophagus | ESCC | Rheumatoid arthritis | 59/4205 | 93/8465 | 4.98e-03 | 1.27e-02 | 6.52e-03 | 59 |
| hsa046684 | Liver | HCC | TNF signaling pathway | 73/4020 | 114/8465 | 2.53e-04 | 1.19e-03 | 6.63e-04 | 73 |
| hsa0466811 | Liver | HCC | TNF signaling pathway | 73/4020 | 114/8465 | 2.53e-04 | 1.19e-03 | 6.63e-04 | 73 |
| hsa0465712 | Liver | Cyst | IL-17 signaling pathway | 11/339 | 94/8465 | 1.27e-03 | 1.36e-02 | 1.12e-02 | 11 |
| hsa046682 | Liver | Cyst | TNF signaling pathway | 12/339 | 114/8465 | 1.96e-03 | 1.88e-02 | 1.56e-02 | 12 |
| hsa0465713 | Liver | Cyst | IL-17 signaling pathway | 11/339 | 94/8465 | 1.27e-03 | 1.36e-02 | 1.12e-02 | 11 |
| hsa046683 | Liver | Cyst | TNF signaling pathway | 12/339 | 114/8465 | 1.96e-03 | 1.88e-02 | 1.56e-02 | 12 |
| Page: 1 2 |
Top |
Cell-cell communication analysis |
| Identification of potential cell-cell interactions between two cell types and their ligand-receptor pairs for different disease states |
| Ligand | Receptor | LRpair | Pathway | Tissue | Disease Stage |
| CCL20 | CCR6 | CCL20_CCR6 | CCL | Breast | ADJ |
| CCL20 | CCR6 | CCL20_CCR6 | CCL | Breast | Healthy |
| CCL20 | CCR6 | CCL20_CCR6 | CCL | Cervix | ADJ |
| CCL20 | CCR6 | CCL20_CCR6 | CCL | Cervix | Healthy |
| CCL20 | CCR6 | CCL20_CCR6 | CCL | Cervix | Precancer |
| CCL20 | CCR6 | CCL20_CCR6 | CCL | Endometrium | ADJ |
| CCL20 | CCR6 | CCL20_CCR6 | CCL | Endometrium | AEH |
| CCL20 | CCR6 | CCL20_CCR6 | CCL | Endometrium | EEC |
| CCL20 | CCR6 | CCL20_CCR6 | CCL | GC | ADJ |
| CCL20 | CCR6 | CCL20_CCR6 | CCL | GC | GC |
| CCL20 | CCR6 | CCL20_CCR6 | CCL | HNSCC | ADJ |
| CCL20 | CCR6 | CCL20_CCR6 | CCL | HNSCC | OSCC |
| CCL20 | CCR6 | CCL20_CCR6 | CCL | HNSCC | Precancer |
| CCL20 | CCR6 | CCL20_CCR6 | CCL | Lung | AAH |
| CCL20 | CCR6 | CCL20_CCR6 | CCL | Lung | MIAC |
| CCL20 | CCR6 | CCL20_CCR6 | CCL | Lung | Precancer |
| CCL20 | CCR6 | CCL20_CCR6 | CCL | Prostate | BPH |
| CCL20 | CCR6 | CCL20_CCR6 | CCL | Skin | cSCC |
| CCL20 | CCR6 | CCL20_CCR6 | CCL | Skin | SCCIS |
| Page: 1 |
Top |
Single-cell gene regulatory network inference analysis |
| Find out the significant the regulons (TFs) and the target genes of each regulon across cell types for different disease states |
| TF | Cell Type | Tissue | Disease Stage | Target Gene | RSS | Regulon Activity |
| ∗The dot plots of a searched regulon are shown for all cell subpopulations in each disease state of each tissue based on the regulon specific score inferred using pySCENIC and by calculating the average expression. |
| Page: 1 |
Top |
Somatic mutation of malignant transformation related genes |
| Annotation of somatic variants for genes involved in malignant transformation |
| Hugo Symbol | Variant Class | Variant Classification | dbSNP RS | HGVSc | HGVSp | HGVSp Short | SWISSPROT | BIOTYPE | SIFT | PolyPhen | Tumor Sample Barcode | Tissue | Histology | Sex | Age | Stage | Therapy Types | Drugs | Outcome |
| CCL20 | SNV | Missense_Mutation | novel | c.149C>A | p.Thr50Lys | p.T50K | P78556 | protein_coding | deleterious(0) | possibly_damaging(0.626) | TCGA-A8-A08R-01 | Breast | breast invasive carcinoma | Female | <65 | I/II | Unknown | Unknown | SD |
| CCL20 | SNV | Missense_Mutation | novel | c.180N>G | p.Ile60Met | p.I60M | P78556 | protein_coding | deleterious(0) | probably_damaging(0.998) | TCGA-C8-A8HQ-01 | Breast | breast invasive carcinoma | Female | <65 | I/II | Unknown | Unknown | SD |
| CCL20 | SNV | Missense_Mutation | novel | c.100C>T | p.Leu34Phe | p.L34F | P78556 | protein_coding | deleterious(0) | probably_damaging(0.942) | TCGA-E9-A248-01 | Breast | breast invasive carcinoma | Female | <65 | I/II | Chemotherapy | cyclophosphamide | SD |
| CCL20 | SNV | Missense_Mutation | c.73N>C | p.Glu25Gln | p.E25Q | P78556 | protein_coding | tolerated(0.15) | benign(0.1) | TCGA-BI-A0VR-01 | Cervix | cervical & endocervical cancer | Female | <65 | III/IV | Unknown | Unknown | SD | |
| CCL20 | SNV | Missense_Mutation | rs750593133 | c.116N>A | p.Arg39His | p.R39H | P78556 | protein_coding | tolerated(0.5) | benign(0.005) | TCGA-A5-A0G2-01 | Endometrium | uterine corpus endometrioid carcinoma | Female | <65 | III/IV | Unknown | Unknown | SD |
| CCL20 | SNV | Missense_Mutation | c.260N>T | p.Arg87Leu | p.R87L | P78556 | protein_coding | tolerated(0.58) | benign(0.003) | TCGA-A5-A2K4-01 | Endometrium | uterine corpus endometrioid carcinoma | Female | >=65 | III/IV | Chemotherapy | carboplatin | PD | |
| CCL20 | SNV | Missense_Mutation | novel | c.146N>C | p.Phe49Ser | p.F49S | P78556 | protein_coding | deleterious(0) | probably_damaging(0.985) | TCGA-AJ-A3NE-01 | Endometrium | uterine corpus endometrioid carcinoma | Female | <65 | I/II | Unknown | Unknown | SD |
| CCL20 | SNV | Missense_Mutation | novel | c.15N>T | p.Lys5Asn | p.K5N | P78556 | protein_coding | deleterious(0) | possibly_damaging(0.656) | TCGA-AP-A056-01 | Endometrium | uterine corpus endometrioid carcinoma | Female | <65 | I/II | Unknown | Unknown | SD |
| CCL20 | SNV | Missense_Mutation | rs534991528 | c.223N>A | p.Ala75Thr | p.A75T | P78556 | protein_coding | tolerated(0.11) | possibly_damaging(0.878) | TCGA-AP-A1DV-01 | Endometrium | uterine corpus endometrioid carcinoma | Female | <65 | I/II | Unknown | Unknown | SD |
| CCL20 | SNV | Missense_Mutation | novel | c.112N>T | p.Asp38Tyr | p.D38Y | P78556 | protein_coding | deleterious(0.01) | possibly_damaging(0.574) | TCGA-BK-A6W3-01 | Endometrium | uterine corpus endometrioid carcinoma | Female | <65 | I/II | Unknown | Unknown | SD |
| Page: 1 2 |
Top |
Related drugs of malignant transformation related genes |
| Identification of chemicals and drugs interact with genes involved in malignant transfromation |
| (DGIdb 4.0) |
| Entrez ID | Symbol | Category | Interaction Types | Drug Claim Name | Drug Name | PMIDs |
| 6364 | CCL20 | DRUGGABLE GENOME | GSK3050002 | GSK-3050002 |
| Page: 1 |

Copyright 2023-Present -The University of Texas Health Science Center at Houston |