
|
|||||
|
 | |
| |
| |
| |
| |
| |
|
Gene: CCDC93 |
Gene summary for CCDC93 |
| Gene information | Species | Human | Gene symbol | CCDC93 | Gene ID | 54520 |
| Gene name | coiled-coil domain containing 93 | |
| Gene Alias | CCDC93 | |
| Cytomap | 2q14.1 | |
| Gene Type | protein-coding | GO ID | GO:0006810 | UniProtAcc | Q567U6 |
Top |
Malignant transformation analysis |
| Identification of the aberrant gene expression in precancerous and cancerous lesions by comparing the gene expression of stem-like cells in diseased tissues with normal stem cells |
| Entrez ID | Symbol | Replicates | Species | Organ | Tissue | Adj P-value | Log2FC | Malignancy |
| 54520 | CCDC93 | LZE2T | Human | Esophagus | ESCC | 3.41e-05 | 4.33e-01 | 0.082 |
| 54520 | CCDC93 | LZE4T | Human | Esophagus | ESCC | 4.70e-06 | 1.61e-01 | 0.0811 |
| 54520 | CCDC93 | LZE7T | Human | Esophagus | ESCC | 1.24e-05 | 3.49e-01 | 0.0667 |
| 54520 | CCDC93 | LZE8T | Human | Esophagus | ESCC | 4.73e-03 | 7.45e-02 | 0.067 |
| 54520 | CCDC93 | LZE20T | Human | Esophagus | ESCC | 2.20e-02 | 6.07e-02 | 0.0662 |
| 54520 | CCDC93 | LZE24T | Human | Esophagus | ESCC | 2.39e-06 | 1.31e-01 | 0.0596 |
| 54520 | CCDC93 | LZE6T | Human | Esophagus | ESCC | 7.03e-03 | 1.38e-01 | 0.0845 |
| 54520 | CCDC93 | P2T-E | Human | Esophagus | ESCC | 1.49e-17 | 2.61e-01 | 0.1177 |
| 54520 | CCDC93 | P4T-E | Human | Esophagus | ESCC | 7.14e-09 | 2.35e-01 | 0.1323 |
| 54520 | CCDC93 | P5T-E | Human | Esophagus | ESCC | 4.17e-15 | 2.09e-01 | 0.1327 |
| 54520 | CCDC93 | P8T-E | Human | Esophagus | ESCC | 1.65e-06 | 1.26e-01 | 0.0889 |
| 54520 | CCDC93 | P9T-E | Human | Esophagus | ESCC | 3.61e-07 | 1.34e-01 | 0.1131 |
| 54520 | CCDC93 | P10T-E | Human | Esophagus | ESCC | 2.29e-12 | 2.54e-01 | 0.116 |
| 54520 | CCDC93 | P11T-E | Human | Esophagus | ESCC | 1.88e-07 | 3.59e-01 | 0.1426 |
| 54520 | CCDC93 | P12T-E | Human | Esophagus | ESCC | 7.66e-13 | 2.54e-01 | 0.1122 |
| 54520 | CCDC93 | P15T-E | Human | Esophagus | ESCC | 4.04e-14 | 2.65e-01 | 0.1149 |
| 54520 | CCDC93 | P16T-E | Human | Esophagus | ESCC | 4.43e-14 | 2.76e-01 | 0.1153 |
| 54520 | CCDC93 | P17T-E | Human | Esophagus | ESCC | 7.71e-05 | 2.33e-01 | 0.1278 |
| 54520 | CCDC93 | P19T-E | Human | Esophagus | ESCC | 2.94e-03 | 1.69e-01 | 0.1662 |
| 54520 | CCDC93 | P20T-E | Human | Esophagus | ESCC | 1.92e-09 | 1.63e-01 | 0.1124 |
| Page: 1 2 3 4 5 |
| Tissue | Expression Dynamics | Abbreviation |
| Esophagus | 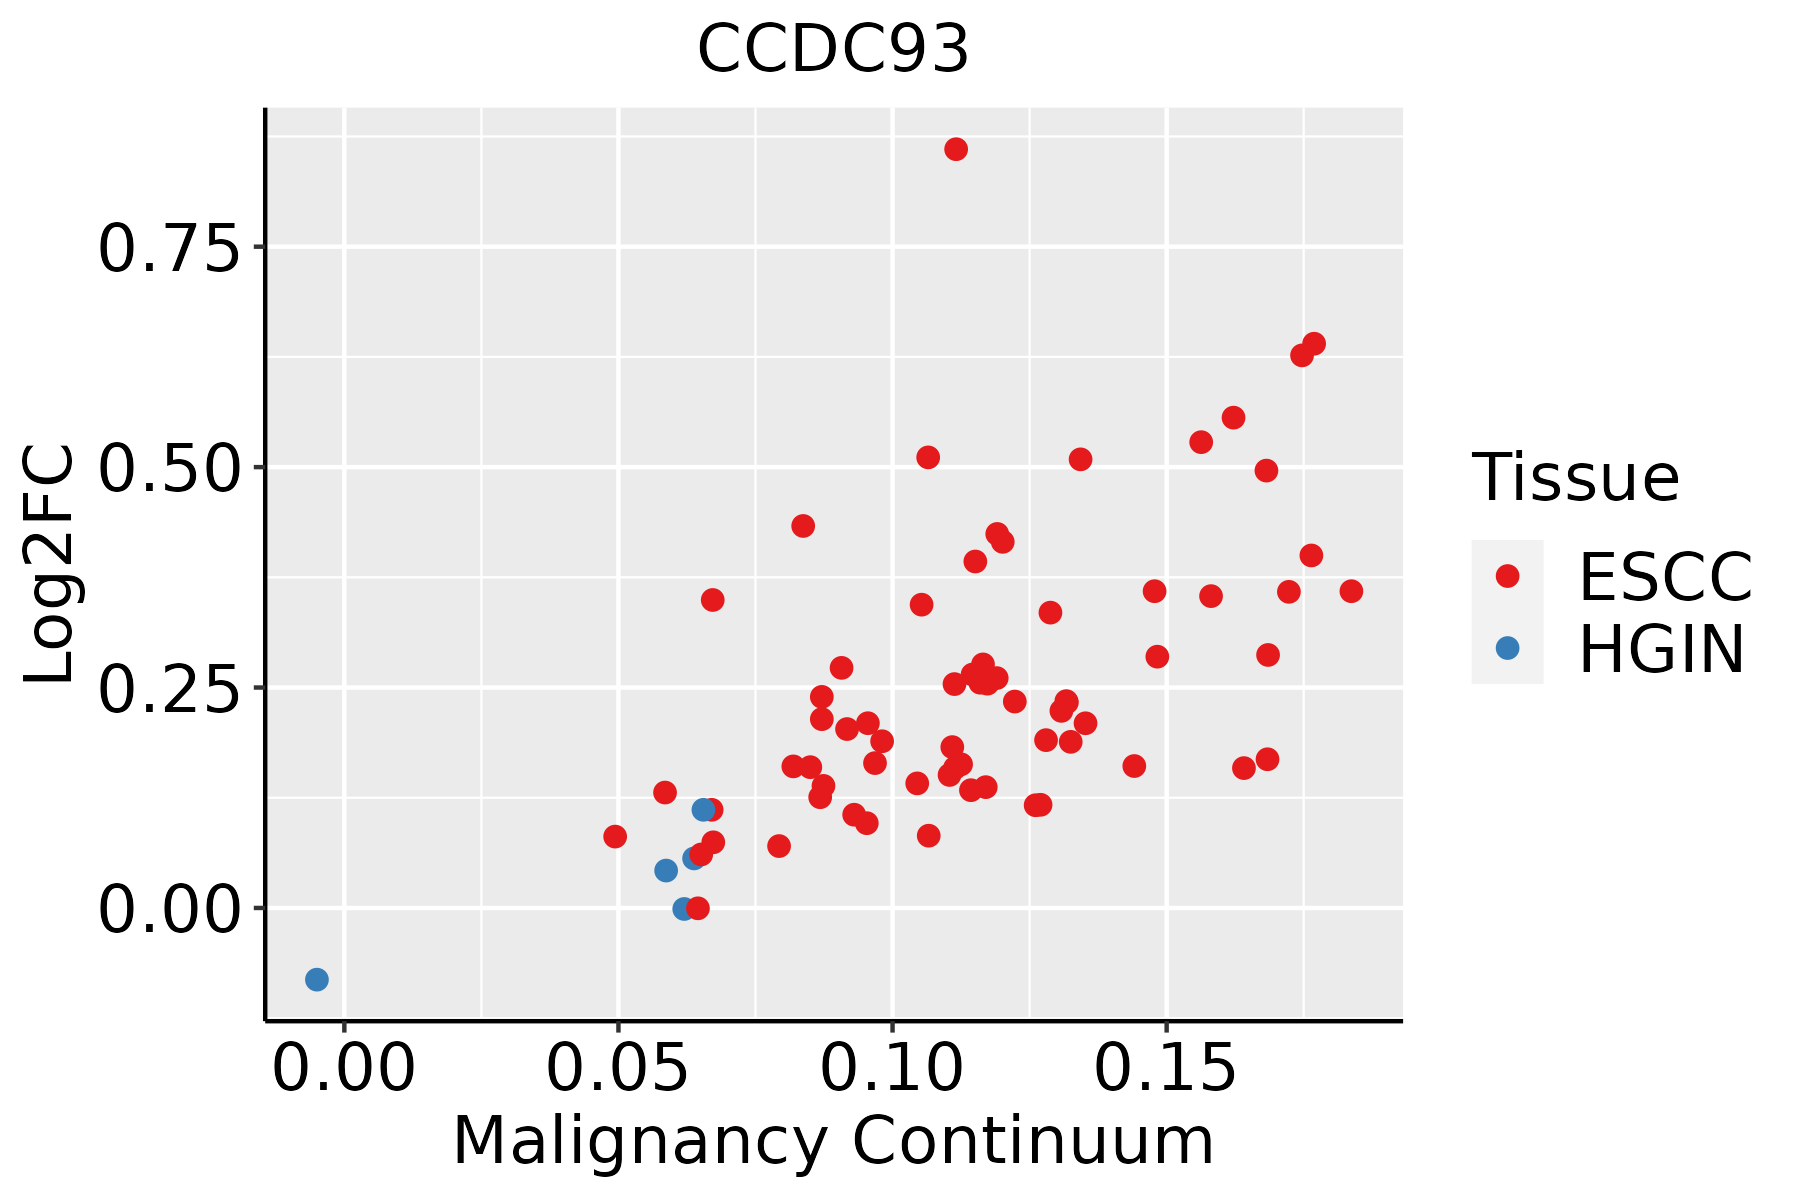 | ESCC: Esophageal squamous cell carcinoma |
| HGIN: High-grade intraepithelial neoplasias | ||
| LGIN: Low-grade intraepithelial neoplasias | ||
| Liver | 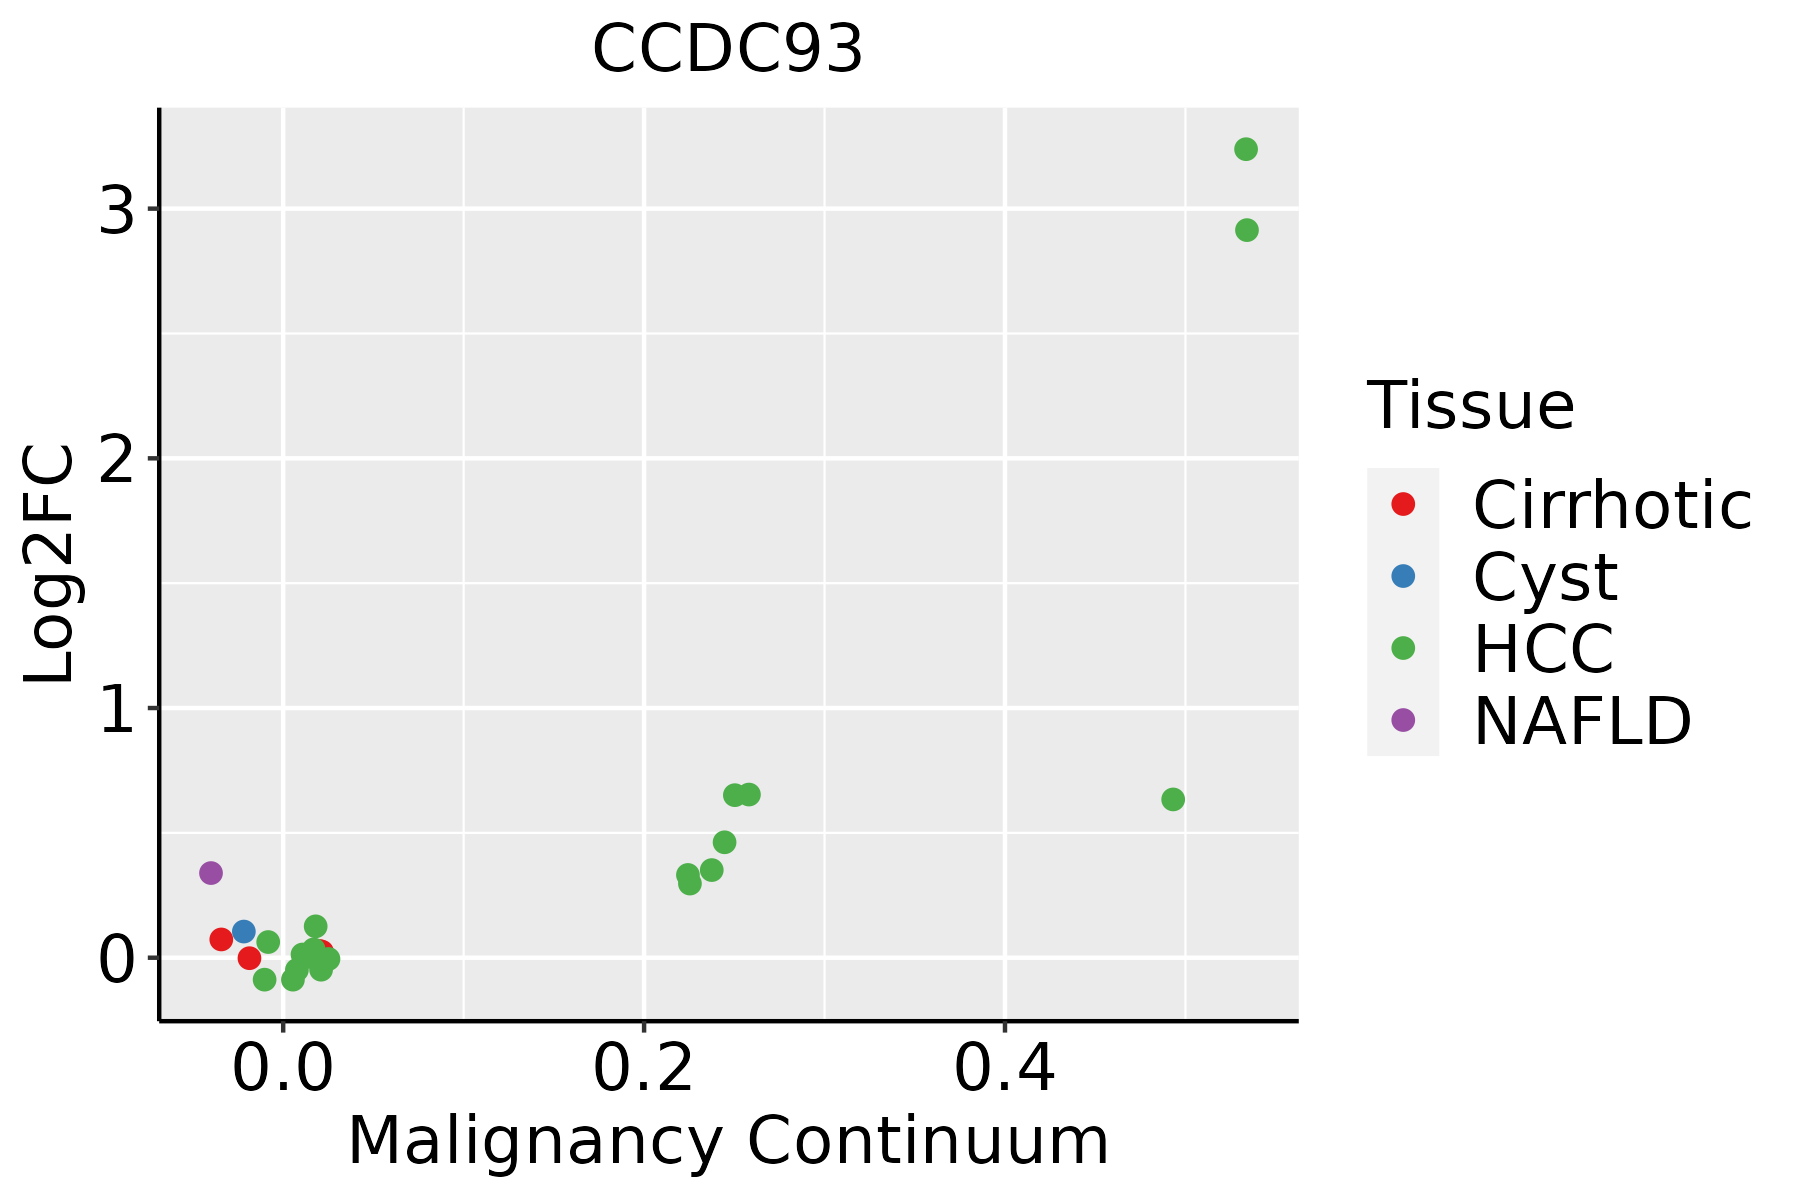 | HCC: Hepatocellular carcinoma |
| NAFLD: Non-alcoholic fatty liver disease | ||
| Thyroid |  | ATC: Anaplastic thyroid cancer |
| HT: Hashimoto's thyroiditis | ||
| PTC: Papillary thyroid cancer |
| ∗log2FC in expression of this searched gene in stem-like cells from each diseased tissue sample relative to stem-like cells in normal samples in each tissue plotted against the malignancy continuum. Samples are colored based on if they are from different disease stage. |
Top |
Malignant transformation related pathway analysis |
| Find out the enriched GO biological processes and KEGG pathways involved in transition from healthy to precancer to cancer |
| Tissue | Disease Stage | Enriched GO biological Processes |
| Colorectum | AD |  |
| Colorectum | SER |  |
| Colorectum | MSS |  |
| Colorectum | MSI-H |  |
| Colorectum | FAP |  |
| ∗Top 15 enriched GO BP terms are showed in the bar plot of each disease state in each tissue. Each row represents a significant GO biological process which is colored according to the -log10(p.adjust). |
| Page: 1 2 3 4 5 6 7 8 9 |
| GO ID | Tissue | Disease Stage | Description | Gene Ratio | Bg Ratio | pvalue | p.adjust | Count |
| GO:004819318 | Esophagus | ESCC | Golgi vesicle transport | 231/8552 | 296/18723 | 1.82e-30 | 9.63e-28 | 231 |
| GO:001619715 | Esophagus | ESCC | endosomal transport | 168/8552 | 230/18723 | 2.28e-17 | 1.93e-15 | 168 |
| GO:000689215 | Esophagus | ESCC | post-Golgi vesicle-mediated transport | 82/8552 | 104/18723 | 4.00e-12 | 1.55e-10 | 82 |
| GO:009887615 | Esophagus | ESCC | vesicle-mediated transport to the plasma membrane | 99/8552 | 136/18723 | 1.13e-10 | 3.39e-09 | 99 |
| GO:000689315 | Esophagus | ESCC | Golgi to plasma membrane transport | 48/8552 | 60/18723 | 5.11e-08 | 9.16e-07 | 48 |
| GO:00324565 | Esophagus | ESCC | endocytic recycling | 51/8552 | 73/18723 | 2.47e-05 | 2.10e-04 | 51 |
| GO:00481936 | Liver | NAFLD | Golgi vesicle transport | 66/1882 | 296/18723 | 3.66e-10 | 9.30e-08 | 66 |
| GO:00068925 | Liver | NAFLD | post-Golgi vesicle-mediated transport | 31/1882 | 104/18723 | 1.70e-08 | 2.03e-06 | 31 |
| GO:00068934 | Liver | NAFLD | Golgi to plasma membrane transport | 19/1882 | 60/18723 | 3.60e-06 | 1.42e-04 | 19 |
| GO:00988765 | Liver | NAFLD | vesicle-mediated transport to the plasma membrane | 30/1882 | 136/18723 | 2.76e-05 | 7.39e-04 | 30 |
| GO:00161975 | Liver | NAFLD | endosomal transport | 41/1882 | 230/18723 | 2.02e-04 | 3.53e-03 | 41 |
| GO:004819321 | Liver | HCC | Golgi vesicle transport | 217/7958 | 296/18723 | 2.58e-27 | 1.02e-24 | 217 |
| GO:001619721 | Liver | HCC | endosomal transport | 154/7958 | 230/18723 | 4.74e-14 | 2.95e-12 | 154 |
| GO:000689221 | Liver | HCC | post-Golgi vesicle-mediated transport | 77/7958 | 104/18723 | 6.14e-11 | 2.24e-09 | 77 |
| GO:009887621 | Liver | HCC | vesicle-mediated transport to the plasma membrane | 92/7958 | 136/18723 | 2.57e-09 | 7.07e-08 | 92 |
| GO:000689321 | Liver | HCC | Golgi to plasma membrane transport | 44/7958 | 60/18723 | 1.24e-06 | 1.81e-05 | 44 |
| GO:00324562 | Liver | HCC | endocytic recycling | 48/7958 | 73/18723 | 5.07e-05 | 4.83e-04 | 48 |
| GO:004819320 | Thyroid | PTC | Golgi vesicle transport | 186/5968 | 296/18723 | 3.09e-28 | 1.22e-25 | 186 |
| GO:001619718 | Thyroid | PTC | endosomal transport | 128/5968 | 230/18723 | 6.26e-14 | 3.52e-12 | 128 |
| GO:000689218 | Thyroid | PTC | post-Golgi vesicle-mediated transport | 66/5968 | 104/18723 | 3.36e-11 | 1.24e-09 | 66 |
| Page: 1 2 |
| Pathway ID | Tissue | Disease Stage | Description | Gene Ratio | Bg Ratio | pvalue | p.adjust | qvalue | Count |
| Page: 1 |
Top |
Cell-cell communication analysis |
| Identification of potential cell-cell interactions between two cell types and their ligand-receptor pairs for different disease states |
| Ligand | Receptor | LRpair | Pathway | Tissue | Disease Stage |
| Page: 1 |
Top |
Single-cell gene regulatory network inference analysis |
| Find out the significant the regulons (TFs) and the target genes of each regulon across cell types for different disease states |
| TF | Cell Type | Tissue | Disease Stage | Target Gene | RSS | Regulon Activity |
| ∗The dot plots of a searched regulon are shown for all cell subpopulations in each disease state of each tissue based on the regulon specific score inferred using pySCENIC and by calculating the average expression. |
| Page: 1 |
Top |
Somatic mutation of malignant transformation related genes |
| Annotation of somatic variants for genes involved in malignant transformation |
| Hugo Symbol | Variant Class | Variant Classification | dbSNP RS | HGVSc | HGVSp | HGVSp Short | SWISSPROT | BIOTYPE | SIFT | PolyPhen | Tumor Sample Barcode | Tissue | Histology | Sex | Age | Stage | Therapy Types | Drugs | Outcome |
| CCDC93 | SNV | Missense_Mutation | rs762882454 | c.899N>A | p.Leu300Gln | p.L300Q | Q567U6 | protein_coding | deleterious(0) | possibly_damaging(0.671) | TCGA-A8-A08C-01 | Breast | breast invasive carcinoma | Female | >=65 | I/II | Chemotherapy | 5-fluorouracil | CR |
| CCDC93 | SNV | Missense_Mutation | rs200247512 | c.949N>T | p.Arg317Trp | p.R317W | Q567U6 | protein_coding | deleterious(0) | probably_damaging(0.993) | TCGA-D8-A1XQ-01 | Breast | breast invasive carcinoma | Female | >=65 | I/II | Unknown | Unknown | SD |
| CCDC93 | insertion | Nonsense_Mutation | novel | c.716_717insGGGATTTTGAGATTATAGTT | p.His240GlyfsTer3 | p.H240Gfs*3 | Q567U6 | protein_coding | TCGA-A2-A0D1-01 | Breast | breast invasive carcinoma | Female | >=65 | I/II | Chemotherapy | taxotere | SD | ||
| CCDC93 | insertion | Nonsense_Mutation | novel | c.714_715insTCTTCCTACACTATCTAGGTAGGAA | p.Ala239SerfsTer6 | p.A239Sfs*6 | Q567U6 | protein_coding | TCGA-A2-A0D1-01 | Breast | breast invasive carcinoma | Female | >=65 | I/II | Chemotherapy | taxotere | SD | ||
| CCDC93 | insertion | In_Frame_Ins | novel | c.696_697insTTC | p.Ser232_Ala233insPhe | p.S232_A233insF | Q567U6 | protein_coding | TCGA-AO-A03O-01 | Breast | breast invasive carcinoma | Female | >=65 | I/II | Chemotherapy | doxorubicin | SD | ||
| CCDC93 | insertion | Nonsense_Mutation | novel | c.695_696insTTTTACTACAAATTAGCTCTGCCCTGACTCTCTGTGACAT | p.Ala233PhefsTer5 | p.A233Ffs*5 | Q567U6 | protein_coding | TCGA-AO-A03O-01 | Breast | breast invasive carcinoma | Female | >=65 | I/II | Chemotherapy | doxorubicin | SD | ||
| CCDC93 | SNV | Missense_Mutation | novel | c.231C>A | p.Asn77Lys | p.N77K | Q567U6 | protein_coding | deleterious(0) | probably_damaging(0.999) | TCGA-2W-A8YY-01 | Cervix | cervical & endocervical cancer | Female | <65 | I/II | Chemotherapy | cisplatin | CR |
| CCDC93 | SNV | Missense_Mutation | rs577755174 | c.1329G>C | p.Leu443Phe | p.L443F | Q567U6 | protein_coding | tolerated(0.09) | benign(0.102) | TCGA-C5-A1MN-01 | Cervix | cervical & endocervical cancer | Female | <65 | III/IV | Chemotherapy | cisplatin | SD |
| CCDC93 | SNV | Missense_Mutation | c.1627N>A | p.His543Asn | p.H543N | Q567U6 | protein_coding | deleterious(0.02) | possibly_damaging(0.706) | TCGA-DG-A2KK-01 | Cervix | cervical & endocervical cancer | Female | <65 | III/IV | Chemotherapy | cisplatin | SD | |
| CCDC93 | SNV | Missense_Mutation | c.335N>T | p.Asp112Val | p.D112V | Q567U6 | protein_coding | deleterious(0) | probably_damaging(0.999) | TCGA-A6-5665-01 | Colorectum | colon adenocarcinoma | Female | >=65 | I/II | Unknown | Unknown | PD |
| Page: 1 2 3 4 5 6 7 8 |
Top |
Related drugs of malignant transformation related genes |
| Identification of chemicals and drugs interact with genes involved in malignant transfromation |
| (DGIdb 4.0) |
| Entrez ID | Symbol | Category | Interaction Types | Drug Claim Name | Drug Name | PMIDs |
| Page: 1 |

Copyright 2023-Present -The University of Texas Health Science Center at Houston |