
|
|||||
|
 | |
| |
| |
| |
| |
| |
|
Gene: CCDC90B |
Gene summary for CCDC90B |
| Gene information | Species | Human | Gene symbol | CCDC90B | Gene ID | 60492 |
| Gene name | coiled-coil domain containing 90B | |
| Gene Alias | MDS011 | |
| Cytomap | 11q14.1 | |
| Gene Type | protein-coding | GO ID | GO:0005575 | UniProtAcc | Q9GZT6 |
Top |
Malignant transformation analysis |
| Identification of the aberrant gene expression in precancerous and cancerous lesions by comparing the gene expression of stem-like cells in diseased tissues with normal stem cells |
| Entrez ID | Symbol | Replicates | Species | Organ | Tissue | Adj P-value | Log2FC | Malignancy |
| 60492 | CCDC90B | LZE4T | Human | Esophagus | ESCC | 4.39e-15 | 3.35e-01 | 0.0811 |
| 60492 | CCDC90B | LZE5T | Human | Esophagus | ESCC | 4.41e-03 | 1.85e-01 | 0.0514 |
| 60492 | CCDC90B | LZE7T | Human | Esophagus | ESCC | 2.58e-05 | 2.60e-01 | 0.0667 |
| 60492 | CCDC90B | LZE8T | Human | Esophagus | ESCC | 2.41e-11 | 3.66e-01 | 0.067 |
| 60492 | CCDC90B | LZE20T | Human | Esophagus | ESCC | 9.21e-08 | 2.58e-01 | 0.0662 |
| 60492 | CCDC90B | LZE22T | Human | Esophagus | ESCC | 2.71e-05 | 2.40e-01 | 0.068 |
| 60492 | CCDC90B | LZE24T | Human | Esophagus | ESCC | 9.12e-25 | 7.37e-01 | 0.0596 |
| 60492 | CCDC90B | LZE6T | Human | Esophagus | ESCC | 5.79e-10 | 2.74e-01 | 0.0845 |
| 60492 | CCDC90B | P1T-E | Human | Esophagus | ESCC | 3.70e-07 | 1.90e-01 | 0.0875 |
| 60492 | CCDC90B | P2T-E | Human | Esophagus | ESCC | 9.97e-24 | 4.19e-01 | 0.1177 |
| 60492 | CCDC90B | P4T-E | Human | Esophagus | ESCC | 4.69e-48 | 1.02e+00 | 0.1323 |
| 60492 | CCDC90B | P5T-E | Human | Esophagus | ESCC | 3.80e-20 | 4.75e-01 | 0.1327 |
| 60492 | CCDC90B | P8T-E | Human | Esophagus | ESCC | 2.96e-13 | 1.80e-01 | 0.0889 |
| 60492 | CCDC90B | P9T-E | Human | Esophagus | ESCC | 1.65e-21 | 4.60e-01 | 0.1131 |
| 60492 | CCDC90B | P10T-E | Human | Esophagus | ESCC | 5.03e-23 | 4.85e-01 | 0.116 |
| 60492 | CCDC90B | P11T-E | Human | Esophagus | ESCC | 4.20e-25 | 8.16e-01 | 0.1426 |
| 60492 | CCDC90B | P12T-E | Human | Esophagus | ESCC | 8.19e-30 | 6.13e-01 | 0.1122 |
| 60492 | CCDC90B | P15T-E | Human | Esophagus | ESCC | 3.04e-20 | 3.40e-01 | 0.1149 |
| 60492 | CCDC90B | P16T-E | Human | Esophagus | ESCC | 2.73e-33 | 7.66e-01 | 0.1153 |
| 60492 | CCDC90B | P17T-E | Human | Esophagus | ESCC | 1.47e-17 | 8.21e-01 | 0.1278 |
| Page: 1 2 3 4 5 6 |
| Tissue | Expression Dynamics | Abbreviation |
| Esophagus | 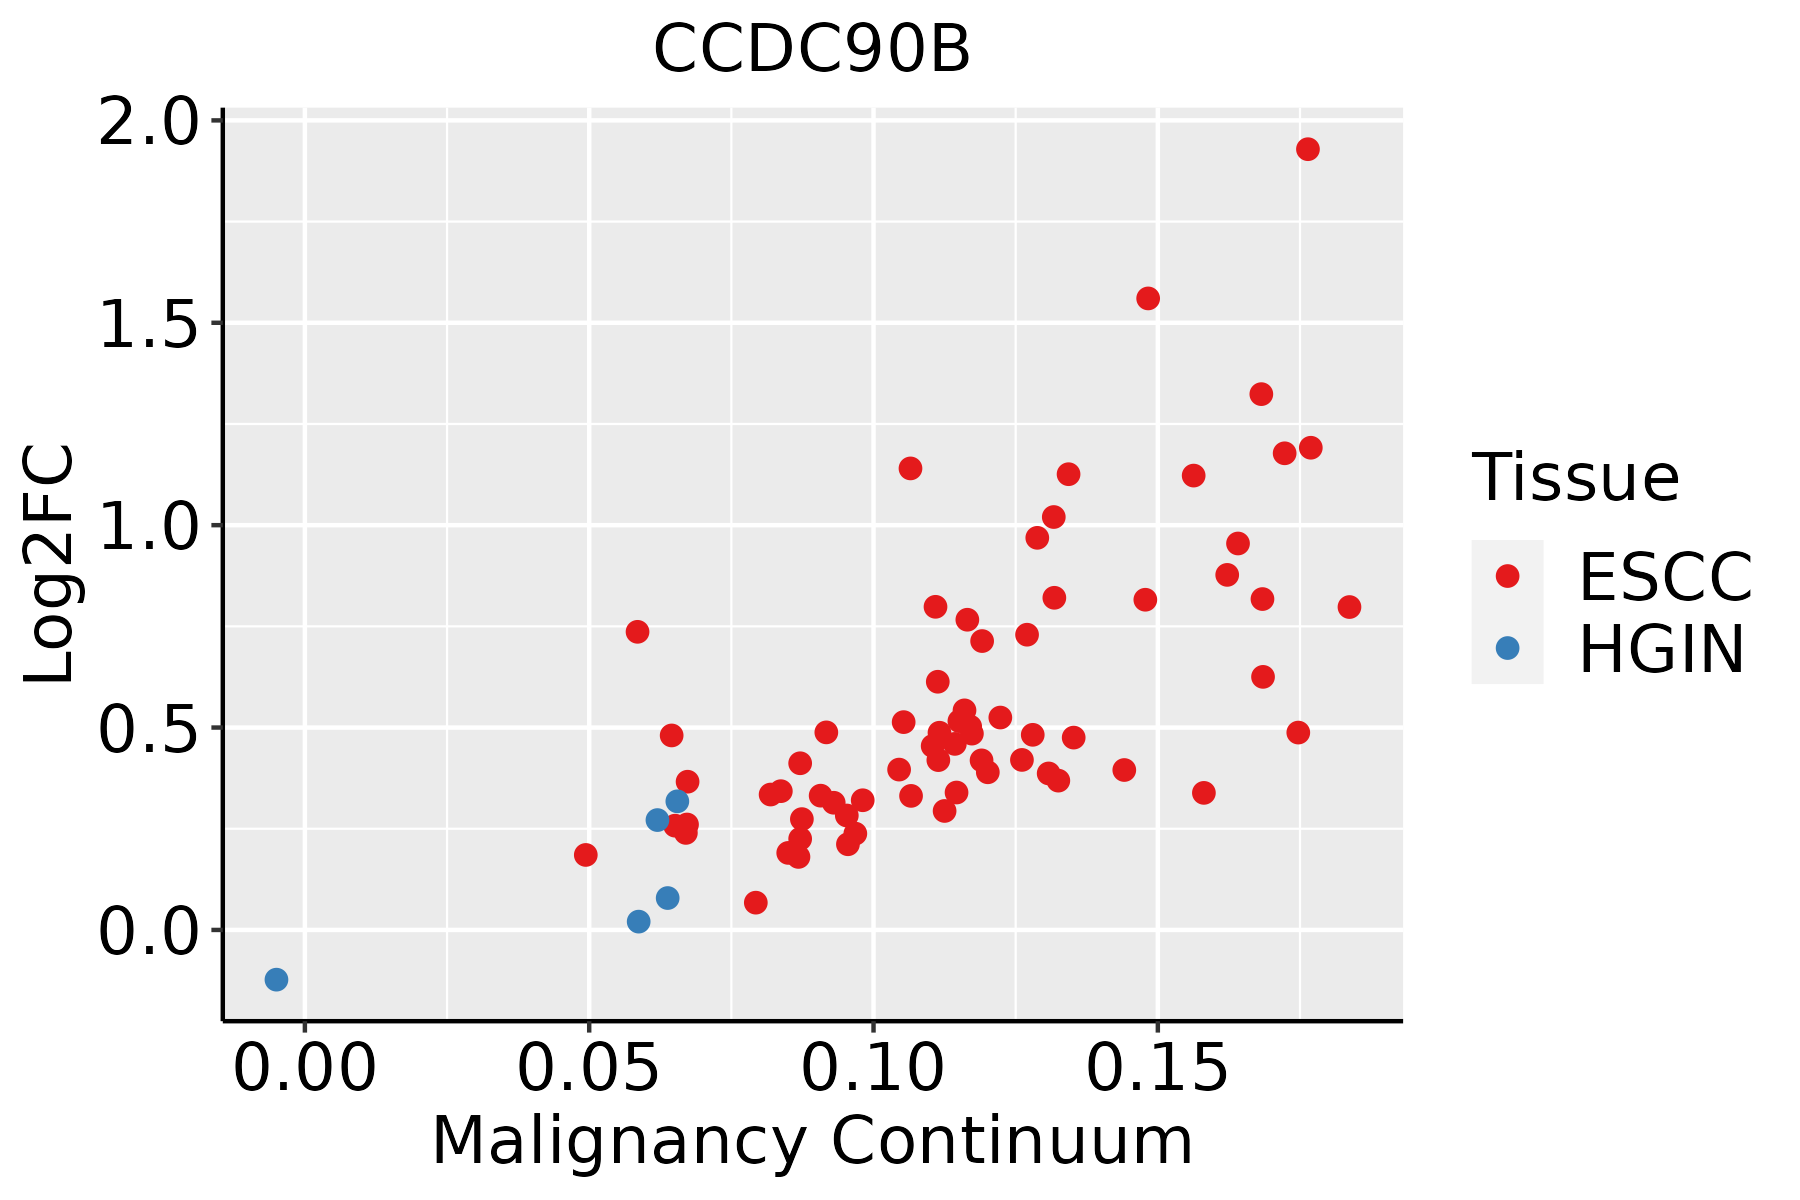 | ESCC: Esophageal squamous cell carcinoma |
| HGIN: High-grade intraepithelial neoplasias | ||
| LGIN: Low-grade intraepithelial neoplasias | ||
| Liver | 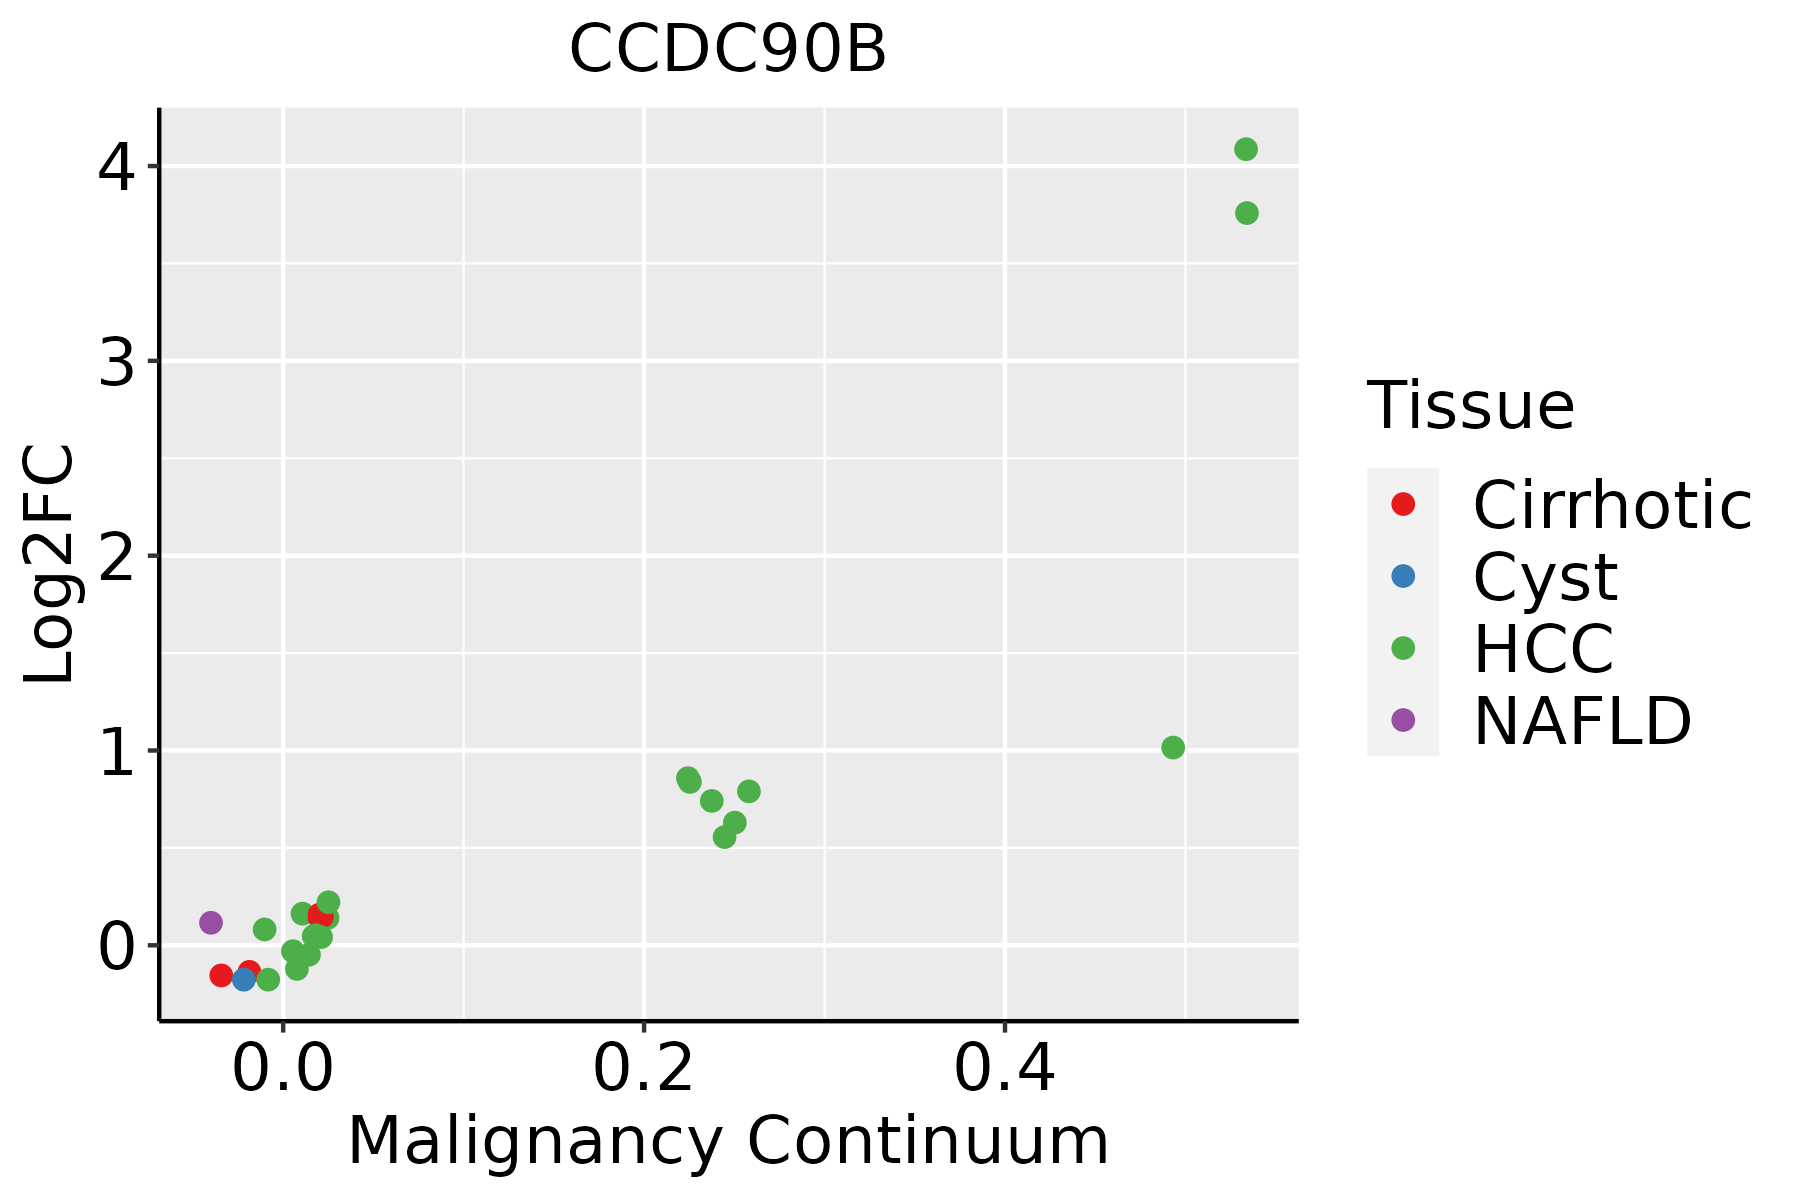 | HCC: Hepatocellular carcinoma |
| NAFLD: Non-alcoholic fatty liver disease | ||
| Oral Cavity | 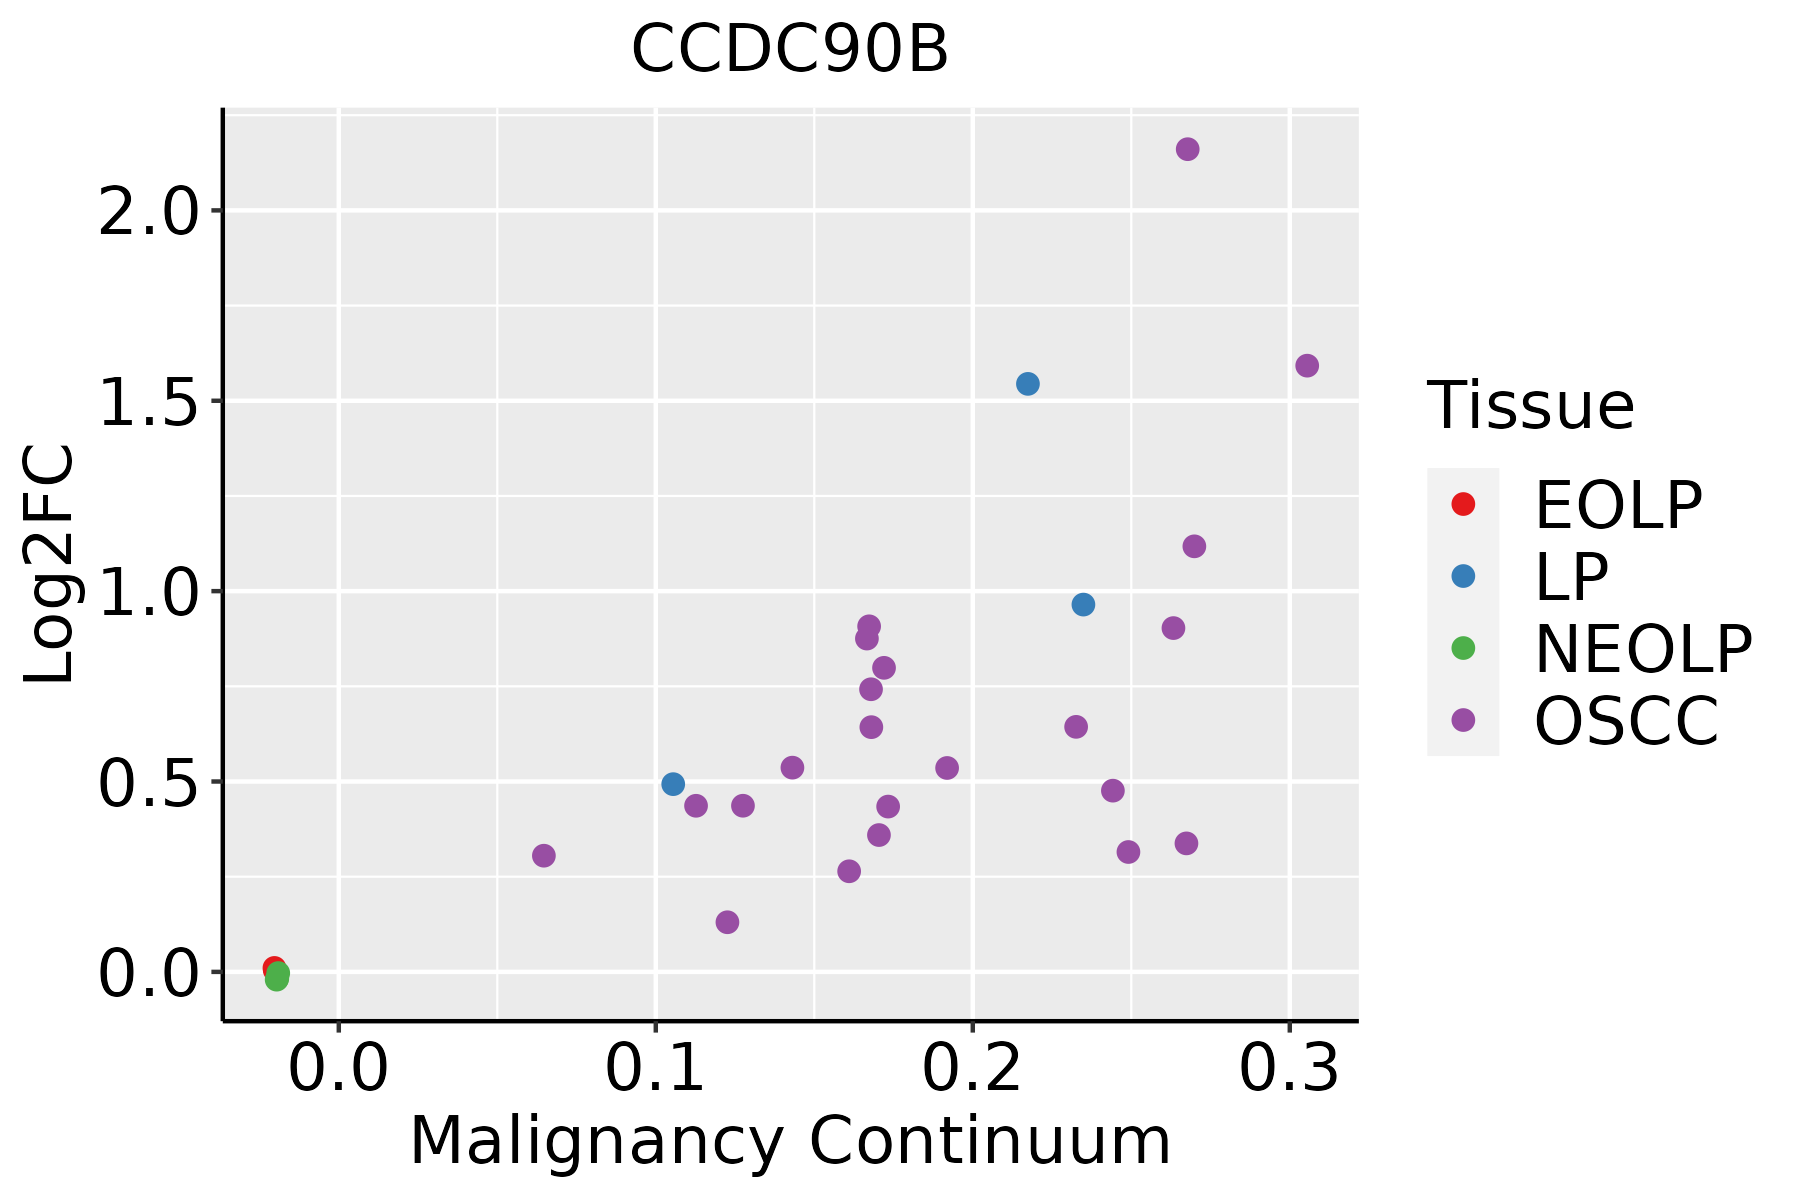 | EOLP: Erosive Oral lichen planus |
| LP: leukoplakia | ||
| NEOLP: Non-erosive oral lichen planus | ||
| OSCC: Oral squamous cell carcinoma | ||
| Prostate |  | BPH: Benign Prostatic Hyperplasia |
| Skin | 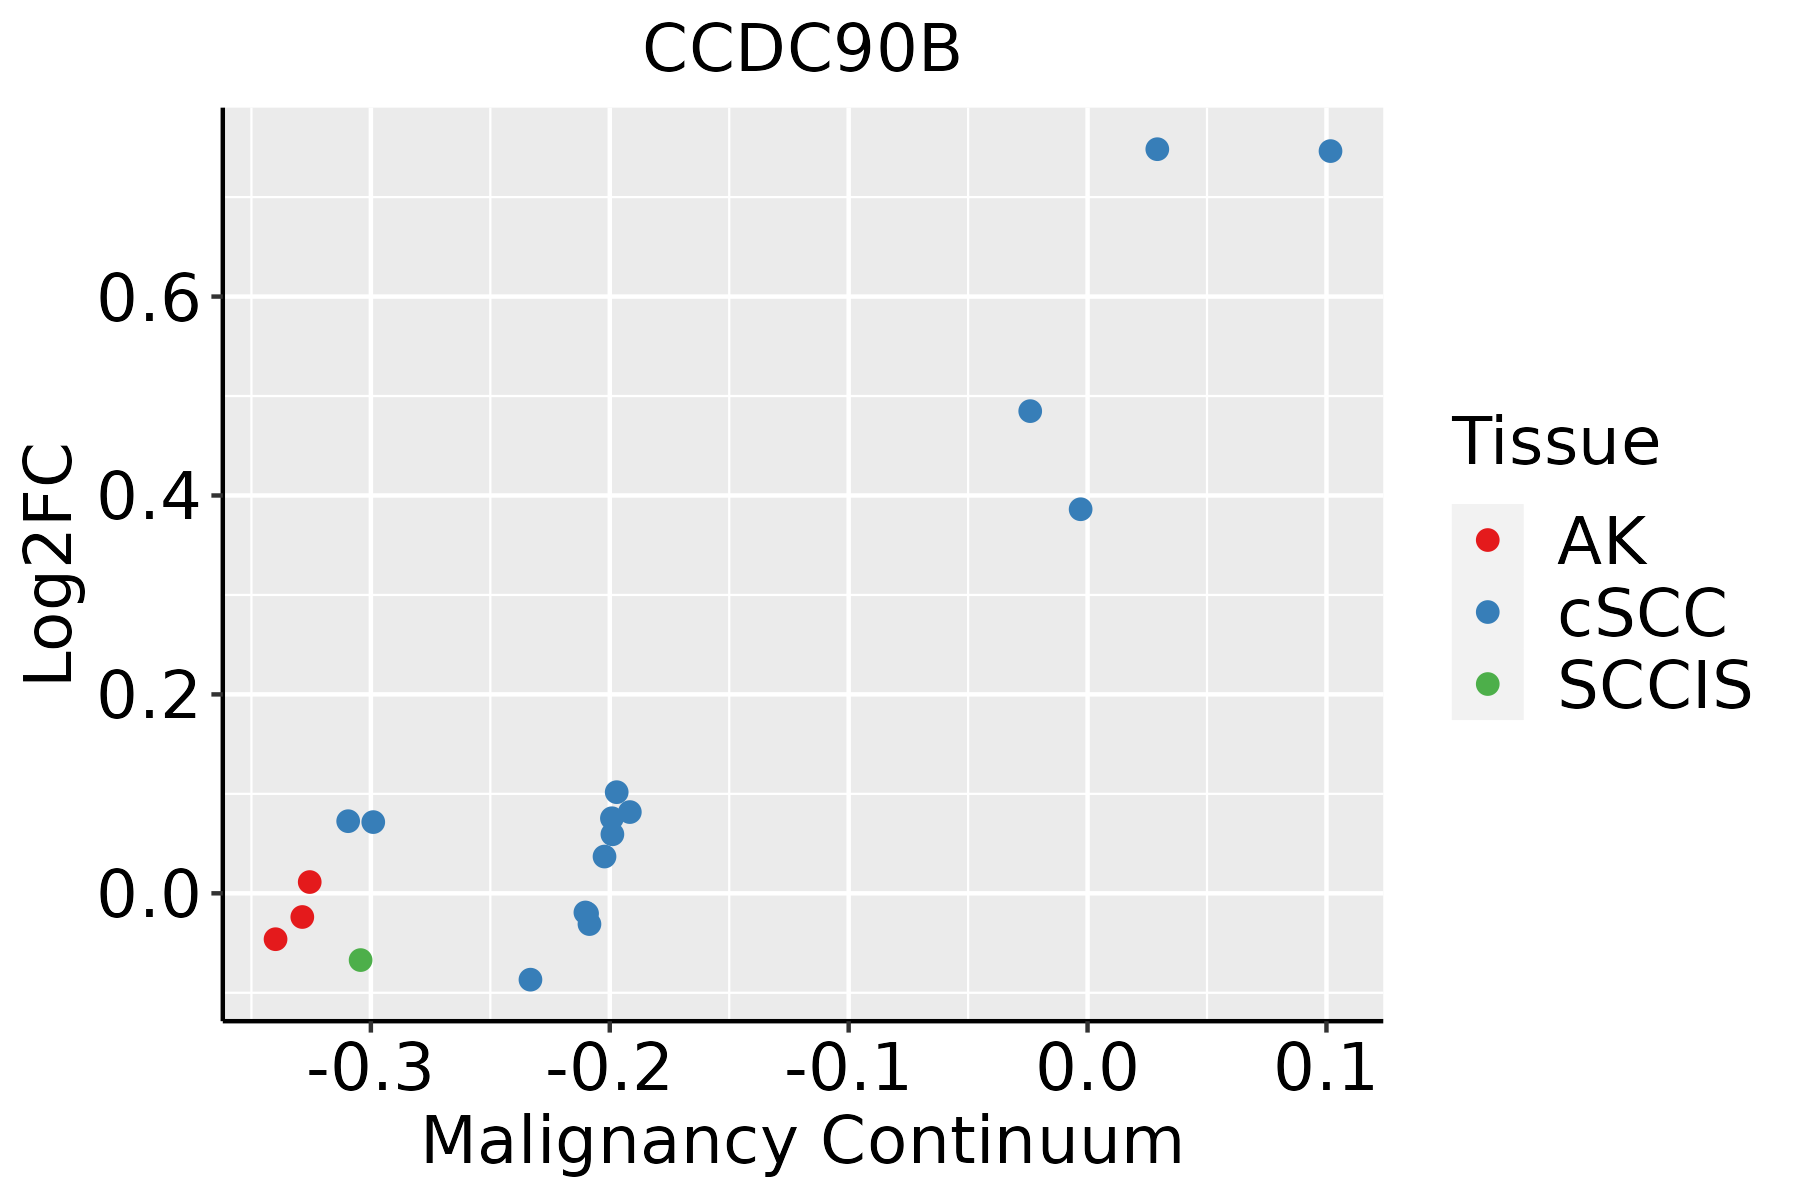 | AK: Actinic keratosis |
| cSCC: Cutaneous squamous cell carcinoma | ||
| SCCIS:squamous cell carcinoma in situ | ||
| Thyroid | 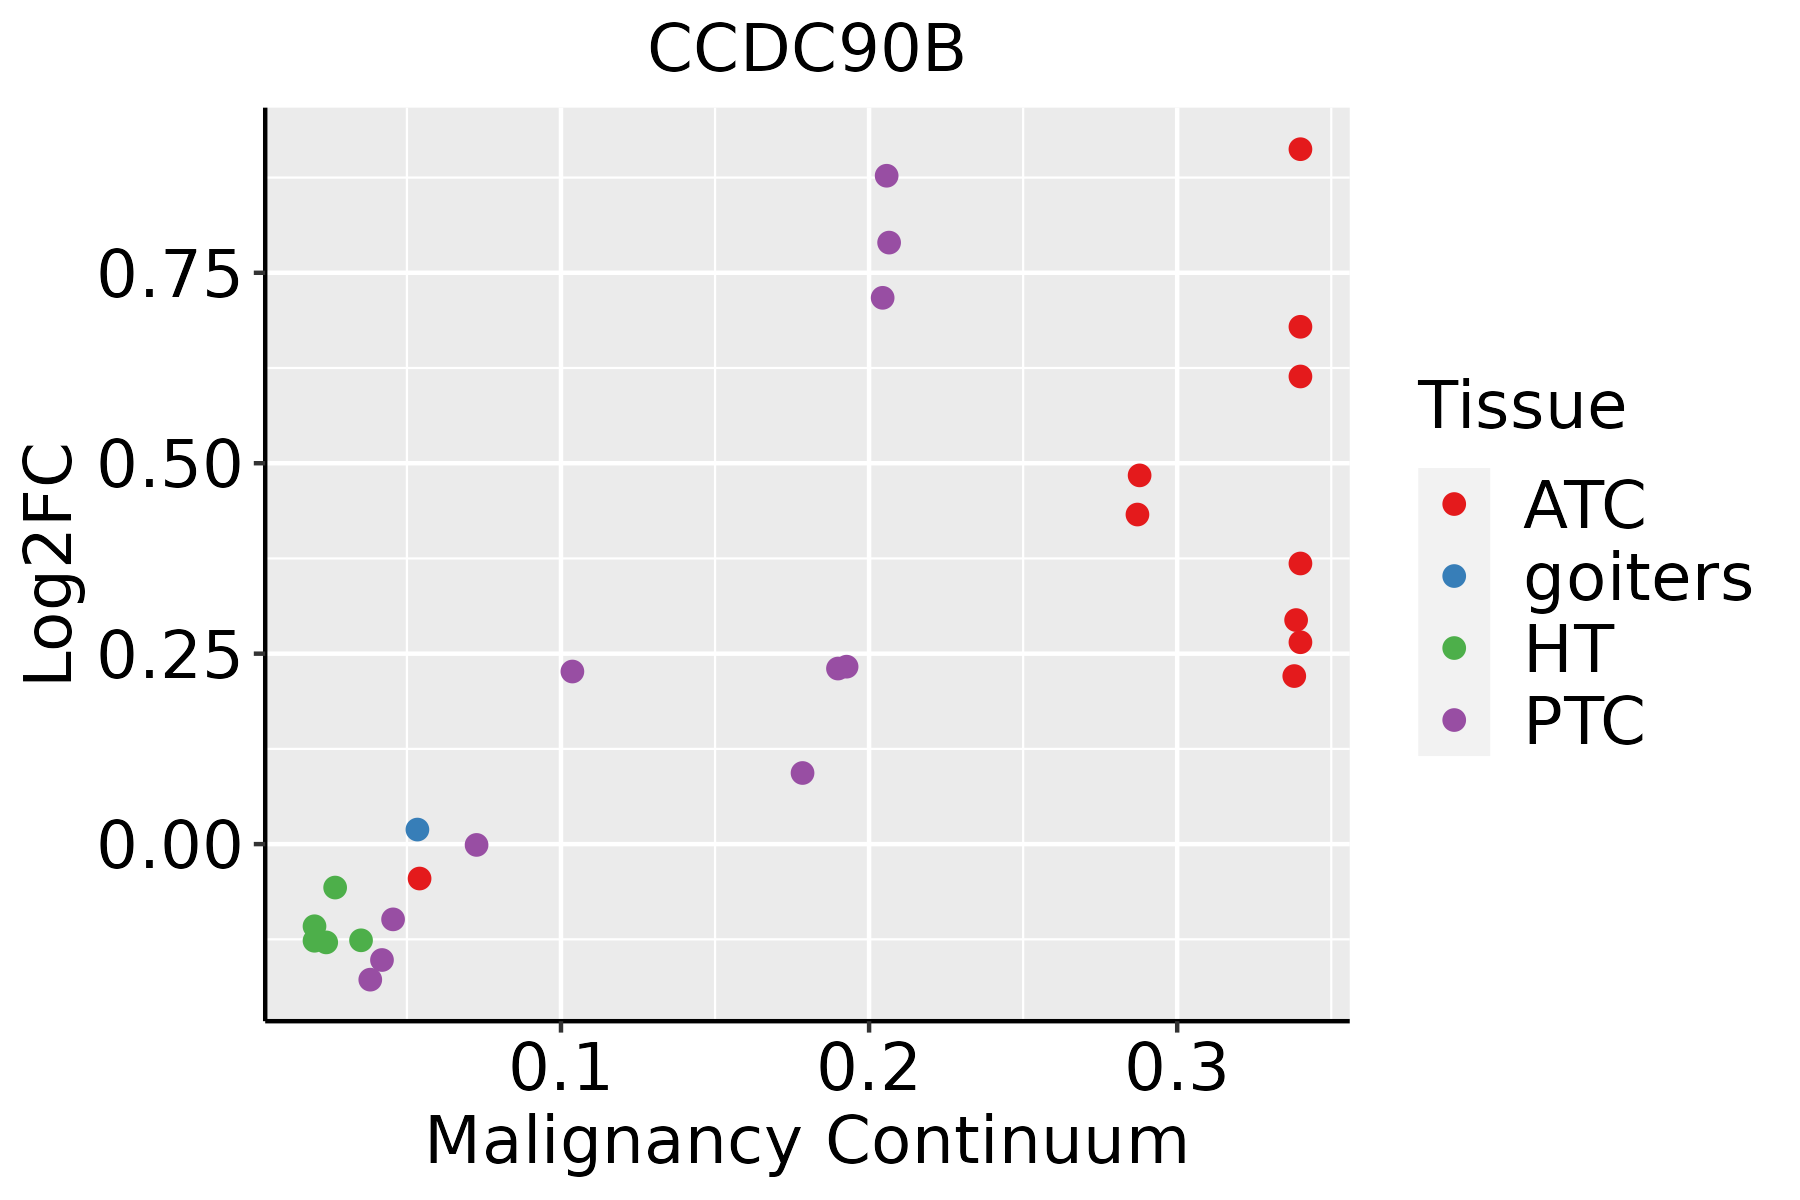 | ATC: Anaplastic thyroid cancer |
| HT: Hashimoto's thyroiditis | ||
| PTC: Papillary thyroid cancer |
| ∗log2FC in expression of this searched gene in stem-like cells from each diseased tissue sample relative to stem-like cells in normal samples in each tissue plotted against the malignancy continuum. Samples are colored based on if they are from different disease stage. |
Top |
Malignant transformation related pathway analysis |
| Find out the enriched GO biological processes and KEGG pathways involved in transition from healthy to precancer to cancer |
| Tissue | Disease Stage | Enriched GO biological Processes |
| Colorectum | AD |  |
| Colorectum | SER |  |
| Colorectum | MSS |  |
| Colorectum | MSI-H |  |
| Colorectum | FAP |  |
| ∗Top 15 enriched GO BP terms are showed in the bar plot of each disease state in each tissue. Each row represents a significant GO biological process which is colored according to the -log10(p.adjust). |
| Page: 1 2 3 4 5 6 7 8 9 |
| GO ID | Tissue | Disease Stage | Description | Gene Ratio | Bg Ratio | pvalue | p.adjust | Count |
| Page: 1 |
| Pathway ID | Tissue | Disease Stage | Description | Gene Ratio | Bg Ratio | pvalue | p.adjust | qvalue | Count |
| Page: 1 |
Top |
Cell-cell communication analysis |
| Identification of potential cell-cell interactions between two cell types and their ligand-receptor pairs for different disease states |
| Ligand | Receptor | LRpair | Pathway | Tissue | Disease Stage |
| Page: 1 |
Top |
Single-cell gene regulatory network inference analysis |
| Find out the significant the regulons (TFs) and the target genes of each regulon across cell types for different disease states |
| TF | Cell Type | Tissue | Disease Stage | Target Gene | RSS | Regulon Activity |
| ∗The dot plots of a searched regulon are shown for all cell subpopulations in each disease state of each tissue based on the regulon specific score inferred using pySCENIC and by calculating the average expression. |
| Page: 1 |
Top |
Somatic mutation of malignant transformation related genes |
| Annotation of somatic variants for genes involved in malignant transformation |
| Hugo Symbol | Variant Class | Variant Classification | dbSNP RS | HGVSc | HGVSp | HGVSp Short | SWISSPROT | BIOTYPE | SIFT | PolyPhen | Tumor Sample Barcode | Tissue | Histology | Sex | Age | Stage | Therapy Types | Drugs | Outcome |
| CCDC90B | SNV | Missense_Mutation | rs762292538 | c.488N>C | p.Arg163Thr | p.R163T | Q9GZT6 | protein_coding | deleterious(0.01) | benign(0.025) | TCGA-A2-A0EQ-01 | Breast | breast invasive carcinoma | Female | <65 | I/II | Chemotherapy | adriamycin | SD |
| CCDC90B | SNV | Missense_Mutation | novel | c.582N>T | p.Glu194Asp | p.E194D | Q9GZT6 | protein_coding | tolerated(0.06) | benign(0.148) | TCGA-AN-A046-01 | Breast | breast invasive carcinoma | Female | >=65 | I/II | Unknown | Unknown | SD |
| CCDC90B | SNV | Missense_Mutation | rs779039037 | c.698N>A | p.Arg233His | p.R233H | Q9GZT6 | protein_coding | deleterious(0.01) | benign(0.148) | TCGA-CA-6716-01 | Colorectum | colon adenocarcinoma | Male | >=65 | I/II | Chemotherapy | oxaliplatin | CR |
| CCDC90B | SNV | Missense_Mutation | rs148744063 | c.697N>T | p.Arg233Cys | p.R233C | Q9GZT6 | protein_coding | tolerated(0.05) | benign(0.148) | TCGA-CA-6717-01 | Colorectum | colon adenocarcinoma | Male | <65 | I/II | Chemotherapy | oxaliplatin | CR |
| CCDC90B | SNV | Missense_Mutation | rs148744063 | c.697C>T | p.Arg233Cys | p.R233C | Q9GZT6 | protein_coding | tolerated(0.05) | benign(0.148) | TCGA-EI-6917-01 | Colorectum | rectum adenocarcinoma | Male | <65 | III/IV | Chemotherapy | 5fluorouracil+oxaciplatina+l-folinian | SD |
| CCDC90B | insertion | Frame_Shift_Ins | novel | c.593_594insA | p.Asp199GlyfsTer13 | p.D199Gfs*13 | Q9GZT6 | protein_coding | TCGA-AD-6889-01 | Colorectum | colon adenocarcinoma | Male | >=65 | I/II | Chemotherapy | xeloda | PD | ||
| CCDC90B | SNV | Missense_Mutation | novel | c.239C>T | p.Ala80Val | p.A80V | Q9GZT6 | protein_coding | deleterious(0) | possibly_damaging(0.894) | TCGA-BG-A2L7-01 | Endometrium | uterine corpus endometrioid carcinoma | Female | >=65 | I/II | Chemotherapy | carboplatin | CR |
| CCDC90B | SNV | Missense_Mutation | rs148744063 | c.697N>T | p.Arg233Cys | p.R233C | Q9GZT6 | protein_coding | tolerated(0.05) | benign(0.148) | TCGA-D1-A17Q-01 | Endometrium | uterine corpus endometrioid carcinoma | Female | <65 | I/II | Unknown | Unknown | SD |
| CCDC90B | SNV | Missense_Mutation | rs148744063 | c.697N>T | p.Arg233Cys | p.R233C | Q9GZT6 | protein_coding | tolerated(0.05) | benign(0.148) | TCGA-EO-A22R-01 | Endometrium | uterine corpus endometrioid carcinoma | Female | <65 | I/II | Unknown | Unknown | SD |
| CCDC90B | SNV | Missense_Mutation | novel | c.239C>T | p.Ala80Val | p.A80V | Q9GZT6 | protein_coding | deleterious(0) | possibly_damaging(0.894) | TCGA-EO-A3AZ-01 | Endometrium | uterine corpus endometrioid carcinoma | Female | >=65 | I/II | Unknown | Unknown | SD |
| Page: 1 2 |
Top |
Related drugs of malignant transformation related genes |
| Identification of chemicals and drugs interact with genes involved in malignant transfromation |
| (DGIdb 4.0) |
| Entrez ID | Symbol | Category | Interaction Types | Drug Claim Name | Drug Name | PMIDs |
| Page: 1 |

Copyright 2023-Present -The University of Texas Health Science Center at Houston |