
|
|||||
|
 | |
| |
| |
| |
| |
| |
|
Gene: CCDC88C |
Gene summary for CCDC88C |
| Gene information | Species | Human | Gene symbol | CCDC88C | Gene ID | 440193 |
| Gene name | coiled-coil domain containing 88C | |
| Gene Alias | DAPLE | |
| Cytomap | 14q32.11-q32.12 | |
| Gene Type | protein-coding | GO ID | GO:0000226 | UniProtAcc | B4DZB8 |
Top |
Malignant transformation analysis |
| Identification of the aberrant gene expression in precancerous and cancerous lesions by comparing the gene expression of stem-like cells in diseased tissues with normal stem cells |
| Entrez ID | Symbol | Replicates | Species | Organ | Tissue | Adj P-value | Log2FC | Malignancy |
| 440193 | CCDC88C | LZE4T | Human | Esophagus | ESCC | 2.54e-04 | 1.57e-01 | 0.0811 |
| 440193 | CCDC88C | LZE20T | Human | Esophagus | ESCC | 7.00e-05 | 2.56e-01 | 0.0662 |
| 440193 | CCDC88C | LZE22T | Human | Esophagus | ESCC | 1.87e-04 | 3.43e-01 | 0.068 |
| 440193 | CCDC88C | LZE24T | Human | Esophagus | ESCC | 9.42e-15 | 5.58e-01 | 0.0596 |
| 440193 | CCDC88C | P1T-E | Human | Esophagus | ESCC | 3.08e-04 | 2.14e-01 | 0.0875 |
| 440193 | CCDC88C | P2T-E | Human | Esophagus | ESCC | 1.67e-13 | 2.05e-01 | 0.1177 |
| 440193 | CCDC88C | P4T-E | Human | Esophagus | ESCC | 5.58e-12 | 4.41e-01 | 0.1323 |
| 440193 | CCDC88C | P5T-E | Human | Esophagus | ESCC | 1.33e-15 | 2.33e-01 | 0.1327 |
| 440193 | CCDC88C | P8T-E | Human | Esophagus | ESCC | 2.28e-10 | 1.80e-01 | 0.0889 |
| 440193 | CCDC88C | P9T-E | Human | Esophagus | ESCC | 7.72e-05 | 6.92e-02 | 0.1131 |
| 440193 | CCDC88C | P10T-E | Human | Esophagus | ESCC | 3.28e-11 | 1.96e-01 | 0.116 |
| 440193 | CCDC88C | P12T-E | Human | Esophagus | ESCC | 2.77e-34 | 6.36e-01 | 0.1122 |
| 440193 | CCDC88C | P15T-E | Human | Esophagus | ESCC | 1.95e-24 | 6.56e-01 | 0.1149 |
| 440193 | CCDC88C | P16T-E | Human | Esophagus | ESCC | 2.23e-07 | 1.25e-01 | 0.1153 |
| 440193 | CCDC88C | P20T-E | Human | Esophagus | ESCC | 1.88e-12 | 2.22e-01 | 0.1124 |
| 440193 | CCDC88C | P21T-E | Human | Esophagus | ESCC | 3.36e-09 | 1.99e-01 | 0.1617 |
| 440193 | CCDC88C | P22T-E | Human | Esophagus | ESCC | 1.61e-07 | 1.36e-01 | 0.1236 |
| 440193 | CCDC88C | P23T-E | Human | Esophagus | ESCC | 2.79e-10 | 3.42e-01 | 0.108 |
| 440193 | CCDC88C | P24T-E | Human | Esophagus | ESCC | 1.51e-02 | 1.04e-01 | 0.1287 |
| 440193 | CCDC88C | P26T-E | Human | Esophagus | ESCC | 1.24e-08 | 2.35e-01 | 0.1276 |
| Page: 1 2 3 4 |
| Tissue | Expression Dynamics | Abbreviation |
| Esophagus | 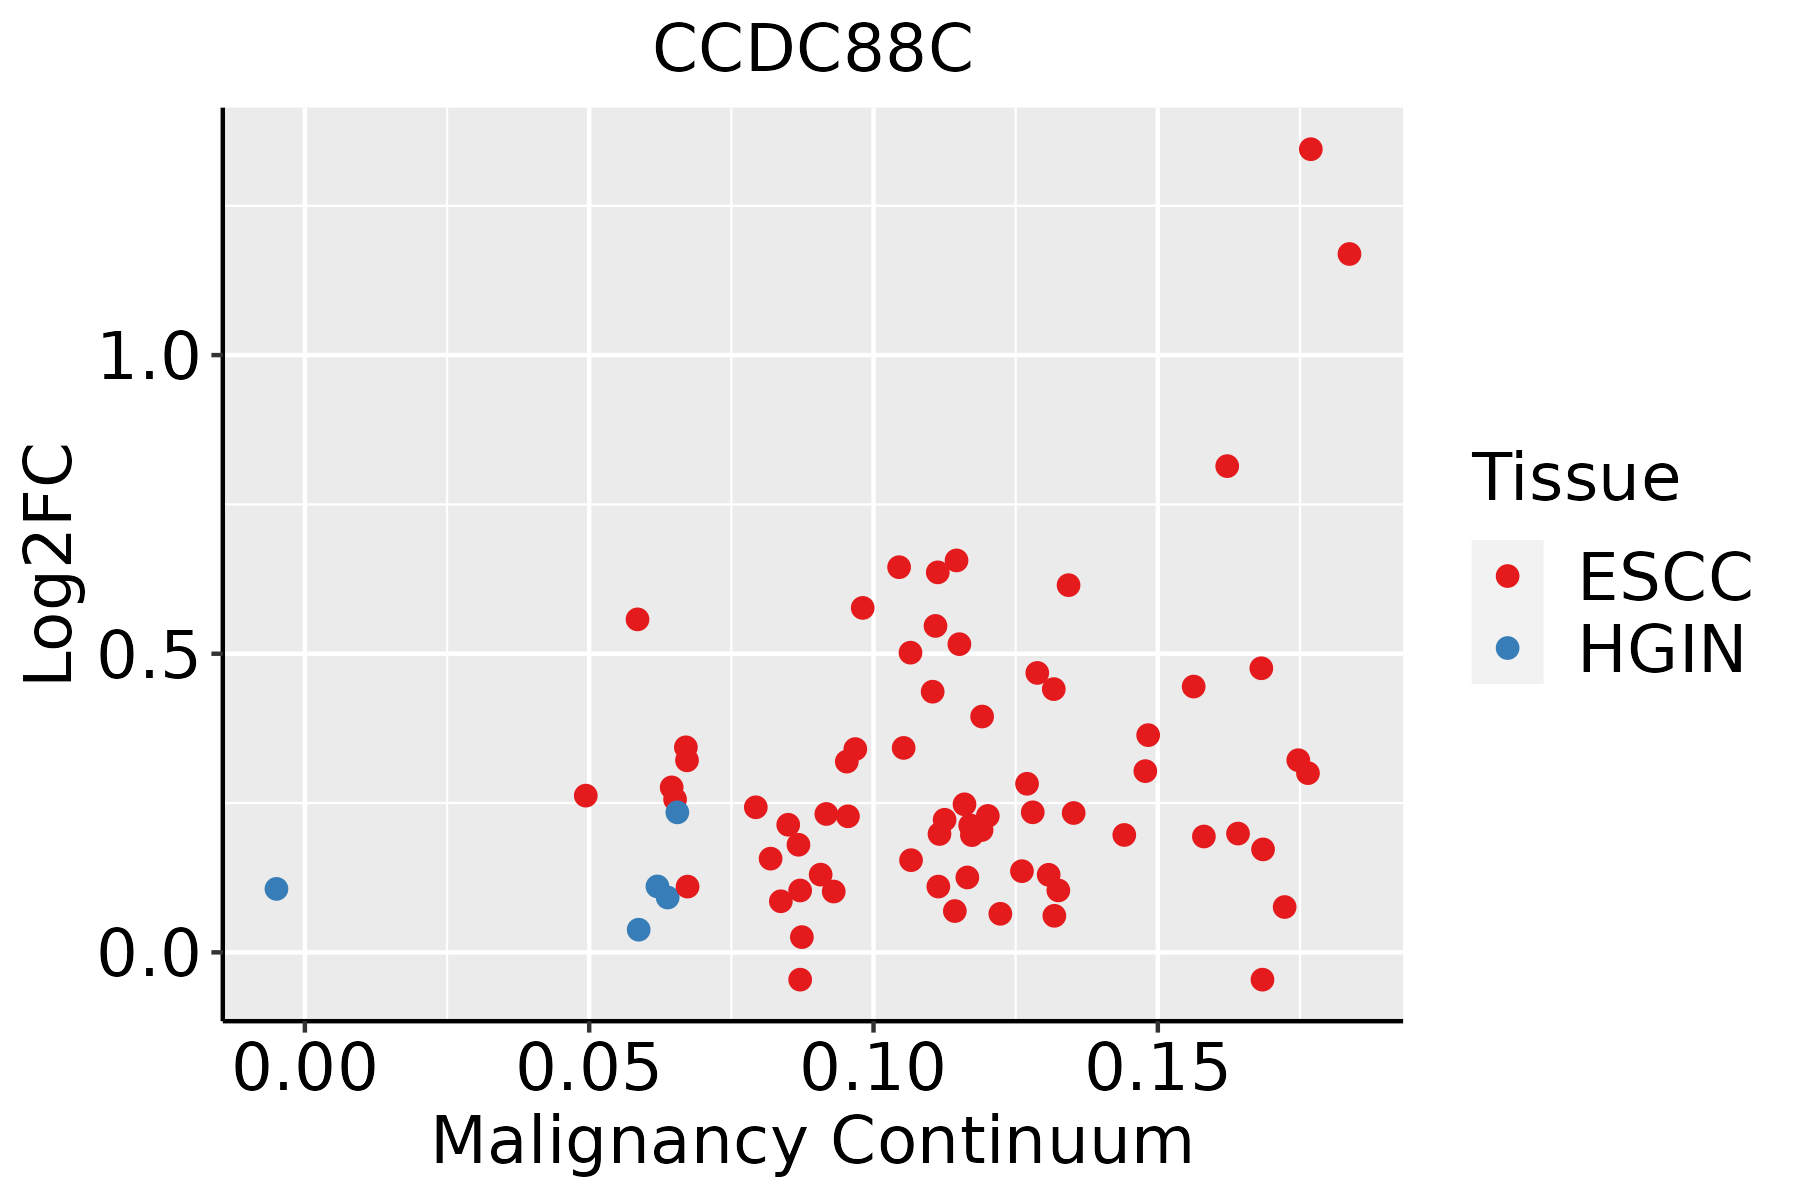 | ESCC: Esophageal squamous cell carcinoma |
| HGIN: High-grade intraepithelial neoplasias | ||
| LGIN: Low-grade intraepithelial neoplasias | ||
| Oral Cavity | 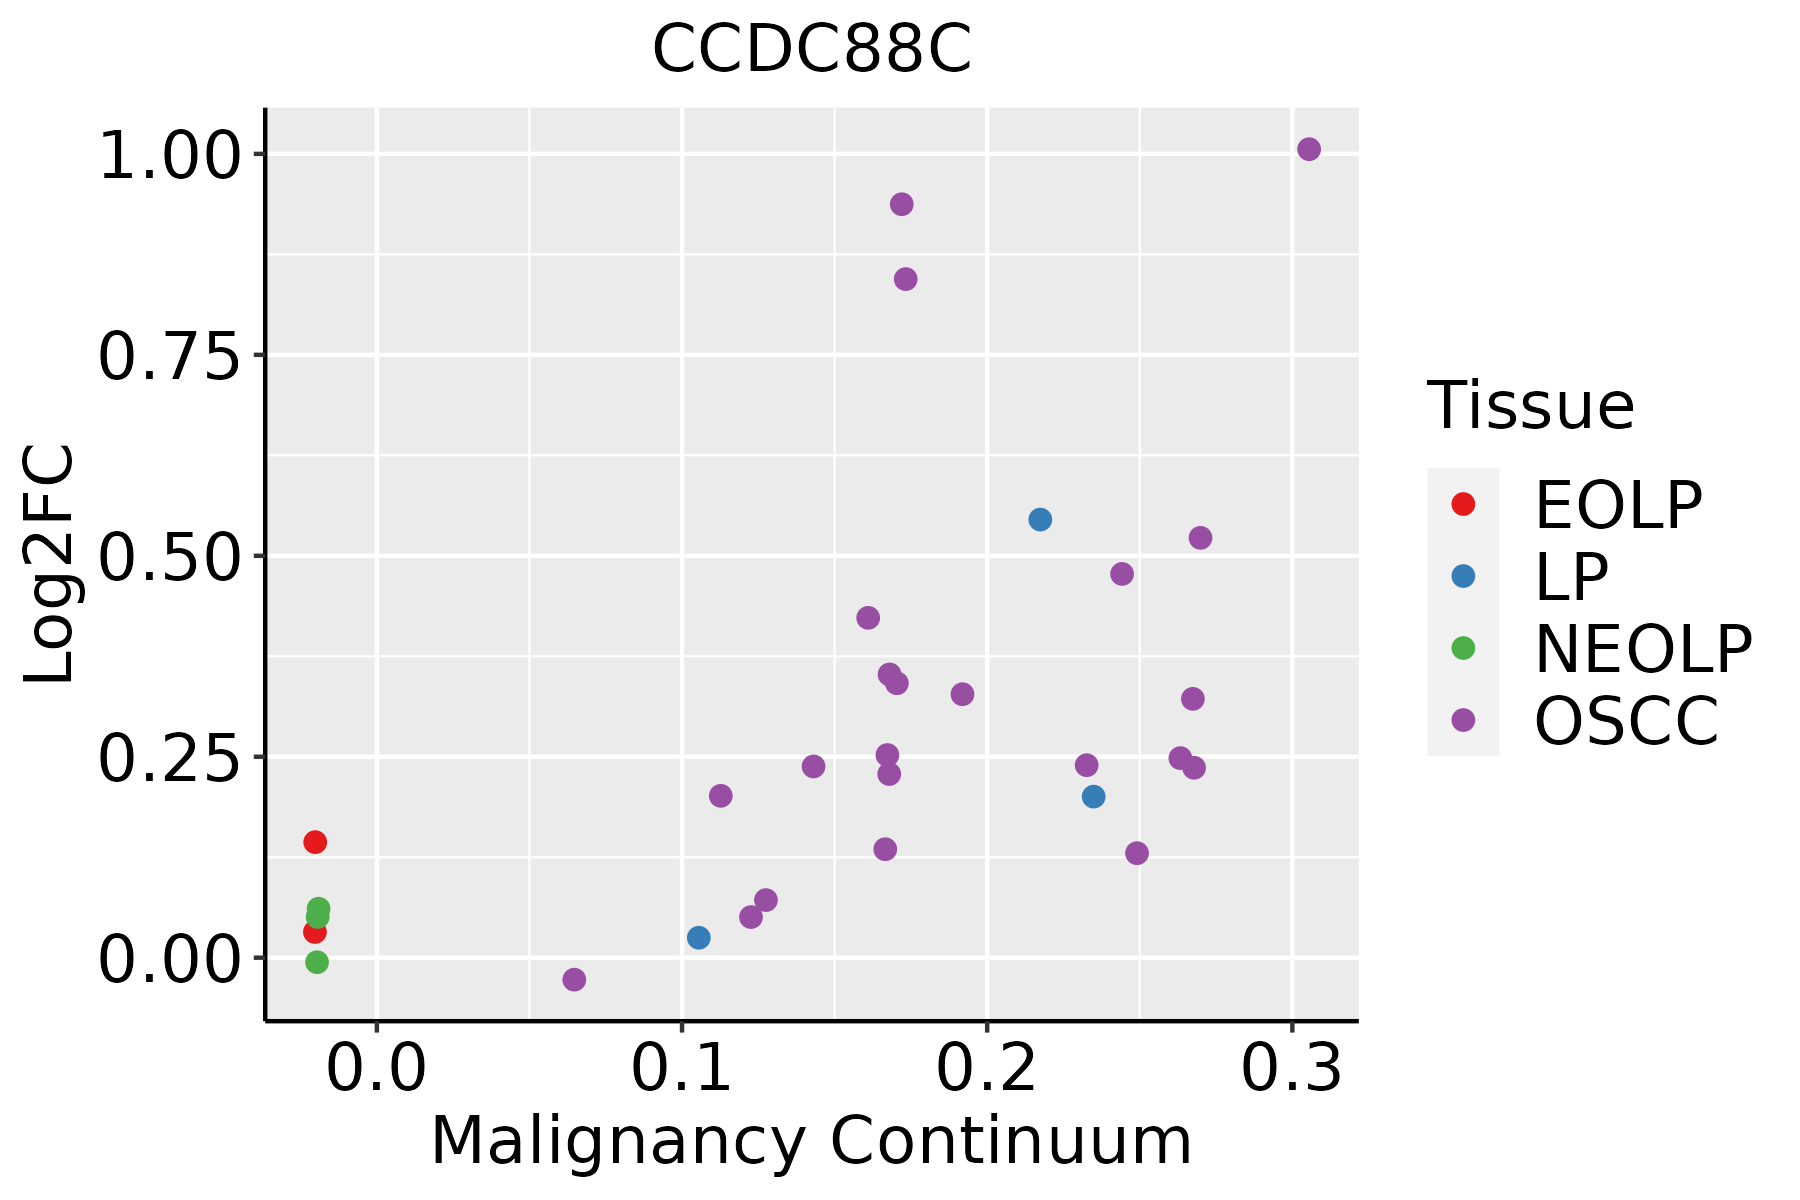 | EOLP: Erosive Oral lichen planus |
| LP: leukoplakia | ||
| NEOLP: Non-erosive oral lichen planus | ||
| OSCC: Oral squamous cell carcinoma | ||
| Prostate | 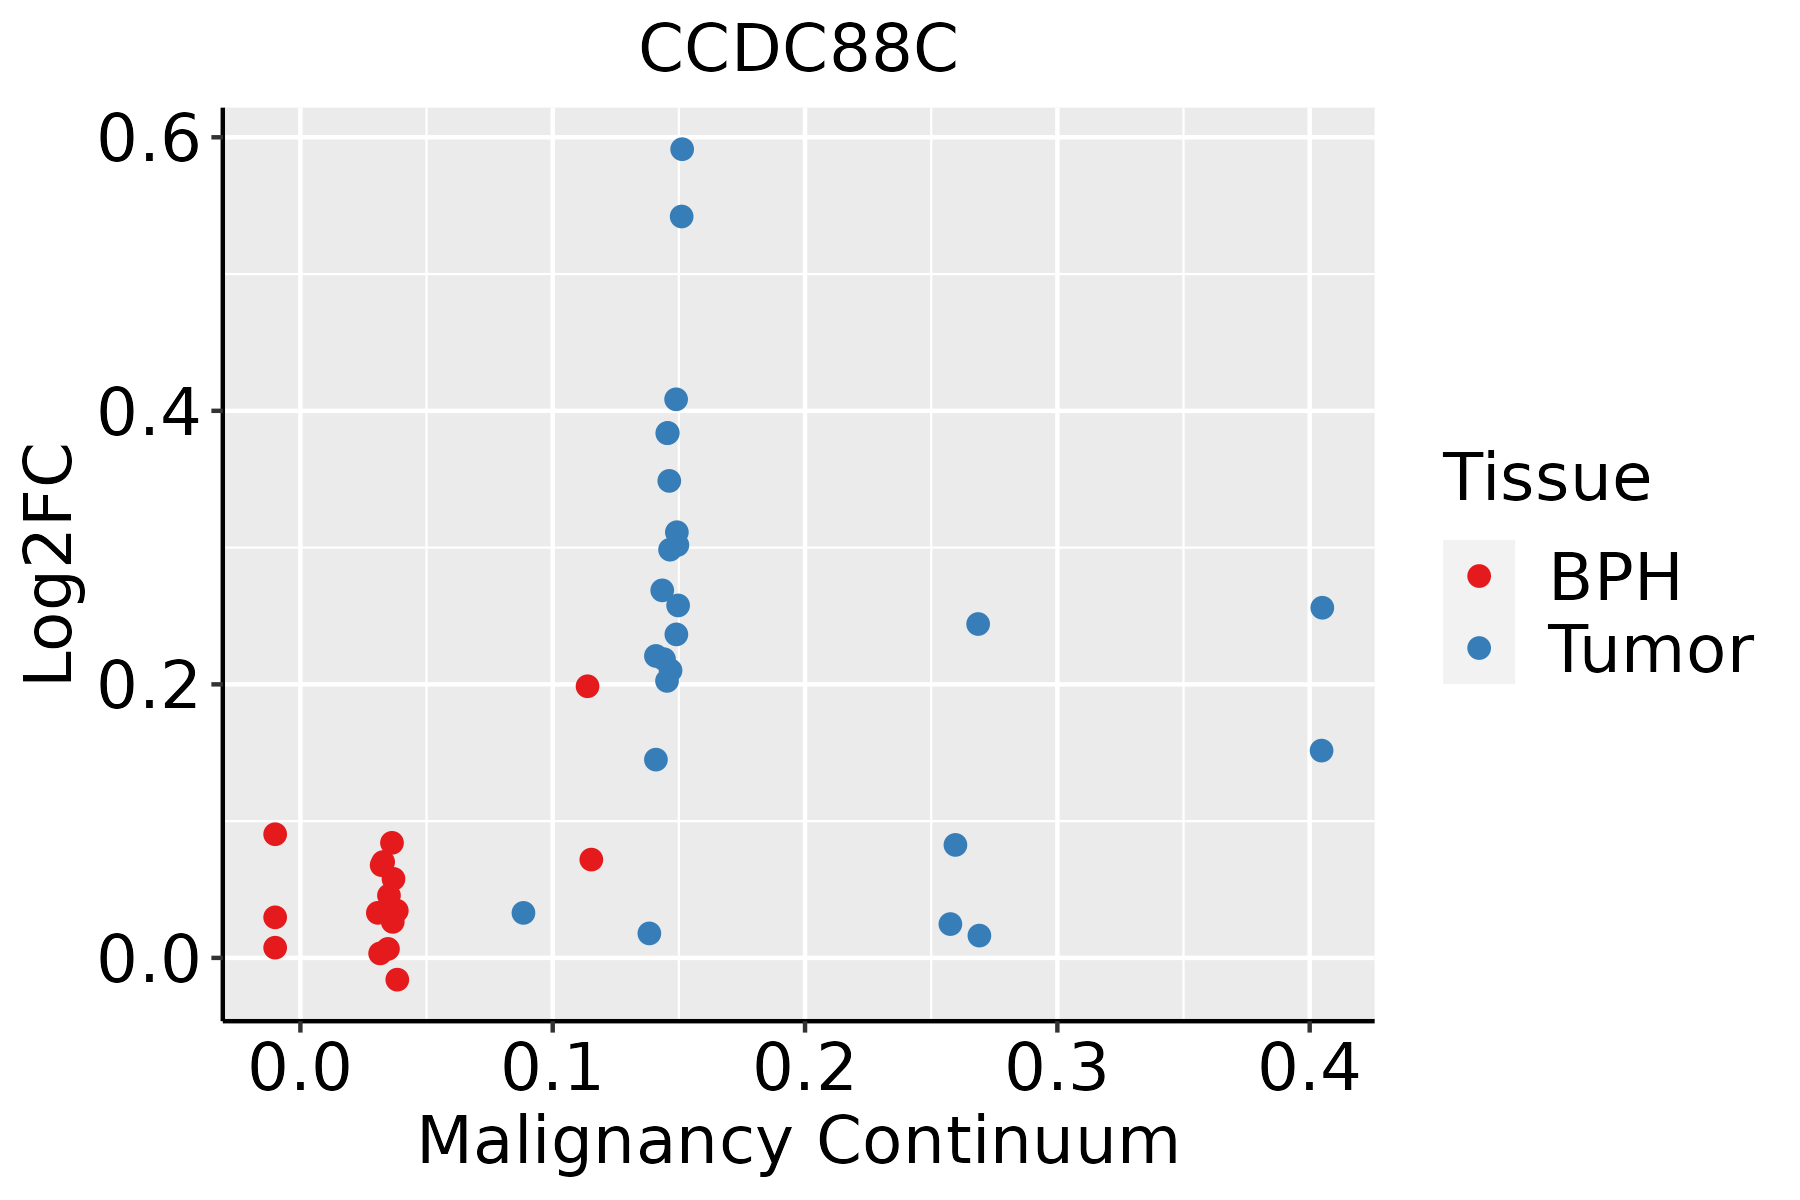 | BPH: Benign Prostatic Hyperplasia |
| ∗log2FC in expression of this searched gene in stem-like cells from each diseased tissue sample relative to stem-like cells in normal samples in each tissue plotted against the malignancy continuum. Samples are colored based on if they are from different disease stage. |
Top |
Malignant transformation related pathway analysis |
| Find out the enriched GO biological processes and KEGG pathways involved in transition from healthy to precancer to cancer |
| Tissue | Disease Stage | Enriched GO biological Processes |
| Colorectum | AD |  |
| Colorectum | SER |  |
| Colorectum | MSS |  |
| Colorectum | MSI-H |  |
| Colorectum | FAP |  |
| ∗Top 15 enriched GO BP terms are showed in the bar plot of each disease state in each tissue. Each row represents a significant GO biological process which is colored according to the -log10(p.adjust). |
| Page: 1 2 3 4 5 6 7 8 9 |
| GO ID | Tissue | Disease Stage | Description | Gene Ratio | Bg Ratio | pvalue | p.adjust | Count |
| GO:0031647111 | Esophagus | ESCC | regulation of protein stability | 223/8552 | 298/18723 | 5.76e-25 | 1.52e-22 | 223 |
| GO:003070518 | Esophagus | ESCC | cytoskeleton-dependent intracellular transport | 133/8552 | 195/18723 | 1.48e-10 | 4.27e-09 | 133 |
| GO:001605517 | Esophagus | ESCC | Wnt signaling pathway | 268/8552 | 444/18723 | 2.32e-10 | 6.58e-09 | 268 |
| GO:019873817 | Esophagus | ESCC | cell-cell signaling by wnt | 269/8552 | 446/18723 | 2.41e-10 | 6.79e-09 | 269 |
| GO:003109818 | Esophagus | ESCC | stress-activated protein kinase signaling cascade | 154/8552 | 247/18723 | 8.53e-08 | 1.44e-06 | 154 |
| GO:003011117 | Esophagus | ESCC | regulation of Wnt signaling pathway | 194/8552 | 328/18723 | 5.39e-07 | 7.14e-06 | 194 |
| GO:006007016 | Esophagus | ESCC | canonical Wnt signaling pathway | 180/8552 | 303/18723 | 9.15e-07 | 1.17e-05 | 180 |
| GO:000206420 | Esophagus | ESCC | epithelial cell development | 136/8552 | 220/18723 | 9.50e-07 | 1.21e-05 | 136 |
| GO:006082817 | Esophagus | ESCC | regulation of canonical Wnt signaling pathway | 153/8552 | 253/18723 | 1.38e-06 | 1.67e-05 | 153 |
| GO:00316486 | Esophagus | ESCC | protein destabilization | 33/8552 | 46/18723 | 3.06e-04 | 1.83e-03 | 33 |
| GO:00311227 | Esophagus | ESCC | cytoplasmic microtubule organization | 38/8552 | 56/18723 | 6.60e-04 | 3.50e-03 | 38 |
| GO:00301788 | Esophagus | ESCC | negative regulation of Wnt signaling pathway | 97/8552 | 170/18723 | 1.81e-03 | 8.31e-03 | 97 |
| GO:00355671 | Esophagus | ESCC | non-canonical Wnt signaling pathway | 45/8552 | 72/18723 | 2.97e-03 | 1.24e-02 | 45 |
| GO:00900905 | Esophagus | ESCC | negative regulation of canonical Wnt signaling pathway | 78/8552 | 137/18723 | 5.17e-03 | 1.95e-02 | 78 |
| GO:00033824 | Esophagus | ESCC | epithelial cell morphogenesis | 22/8552 | 33/18723 | 1.22e-02 | 4.08e-02 | 22 |
| GO:003164720 | Oral cavity | OSCC | regulation of protein stability | 193/7305 | 298/18723 | 1.30e-19 | 1.95e-17 | 193 |
| GO:003109816 | Oral cavity | OSCC | stress-activated protein kinase signaling cascade | 141/7305 | 247/18723 | 5.74e-09 | 1.25e-07 | 141 |
| GO:003070510 | Oral cavity | OSCC | cytoskeleton-dependent intracellular transport | 113/7305 | 195/18723 | 6.03e-08 | 1.09e-06 | 113 |
| GO:001605510 | Oral cavity | OSCC | Wnt signaling pathway | 227/7305 | 444/18723 | 1.10e-07 | 1.87e-06 | 227 |
| GO:019873810 | Oral cavity | OSCC | cell-cell signaling by wnt | 227/7305 | 446/18723 | 1.75e-07 | 2.86e-06 | 227 |
| Page: 1 2 3 |
| Pathway ID | Tissue | Disease Stage | Description | Gene Ratio | Bg Ratio | pvalue | p.adjust | qvalue | Count |
| hsa0431014 | Prostate | BPH | Wnt signaling pathway | 50/1718 | 171/8465 | 3.11e-03 | 1.15e-02 | 7.14e-03 | 50 |
| hsa0431015 | Prostate | BPH | Wnt signaling pathway | 50/1718 | 171/8465 | 3.11e-03 | 1.15e-02 | 7.14e-03 | 50 |
| hsa0431023 | Prostate | Tumor | Wnt signaling pathway | 50/1791 | 171/8465 | 7.32e-03 | 2.37e-02 | 1.47e-02 | 50 |
| hsa0431033 | Prostate | Tumor | Wnt signaling pathway | 50/1791 | 171/8465 | 7.32e-03 | 2.37e-02 | 1.47e-02 | 50 |
| Page: 1 |
Top |
Cell-cell communication analysis |
| Identification of potential cell-cell interactions between two cell types and their ligand-receptor pairs for different disease states |
| Ligand | Receptor | LRpair | Pathway | Tissue | Disease Stage |
| Page: 1 |
Top |
Single-cell gene regulatory network inference analysis |
| Find out the significant the regulons (TFs) and the target genes of each regulon across cell types for different disease states |
| TF | Cell Type | Tissue | Disease Stage | Target Gene | RSS | Regulon Activity |
| ∗The dot plots of a searched regulon are shown for all cell subpopulations in each disease state of each tissue based on the regulon specific score inferred using pySCENIC and by calculating the average expression. |
| Page: 1 |
Top |
Somatic mutation of malignant transformation related genes |
| Annotation of somatic variants for genes involved in malignant transformation |
| Hugo Symbol | Variant Class | Variant Classification | dbSNP RS | HGVSc | HGVSp | HGVSp Short | SWISSPROT | BIOTYPE | SIFT | PolyPhen | Tumor Sample Barcode | Tissue | Histology | Sex | Age | Stage | Therapy Types | Drugs | Outcome |
| CCDC88C | SNV | Missense_Mutation | c.3994N>C | p.Glu1332Gln | p.E1332Q | Q9P219 | protein_coding | deleterious(0) | probably_damaging(0.979) | TCGA-A2-A04T-01 | Breast | breast invasive carcinoma | Female | <65 | I/II | Chemotherapy | cyclophosphamide | SD | |
| CCDC88C | SNV | Missense_Mutation | rs753170514 | c.3748N>A | p.Glu1250Lys | p.E1250K | Q9P219 | protein_coding | deleterious(0.02) | possibly_damaging(0.825) | TCGA-AN-A046-01 | Breast | breast invasive carcinoma | Female | >=65 | I/II | Unknown | Unknown | SD |
| CCDC88C | SNV | Missense_Mutation | c.2617G>A | p.Asp873Asn | p.D873N | Q9P219 | protein_coding | tolerated(0.34) | benign(0.119) | TCGA-AR-A255-01 | Breast | breast invasive carcinoma | Female | <65 | I/II | Targeted Molecular therapy | trastuzumab | SD | |
| CCDC88C | SNV | Missense_Mutation | rs776581160 | c.4751C>T | p.Ser1584Leu | p.S1584L | Q9P219 | protein_coding | deleterious(0.01) | probably_damaging(0.994) | TCGA-D8-A27G-01 | Breast | breast invasive carcinoma | Female | >=65 | I/II | Unknown | Unknown | SD |
| CCDC88C | SNV | Missense_Mutation | c.1225G>A | p.Glu409Lys | p.E409K | Q9P219 | protein_coding | deleterious(0.01) | probably_damaging(0.976) | TCGA-D8-A27G-01 | Breast | breast invasive carcinoma | Female | >=65 | I/II | Unknown | Unknown | SD | |
| CCDC88C | SNV | Missense_Mutation | c.1156G>A | p.Glu386Lys | p.E386K | Q9P219 | protein_coding | deleterious(0) | probably_damaging(0.96) | TCGA-D8-A27G-01 | Breast | breast invasive carcinoma | Female | >=65 | I/II | Unknown | Unknown | SD | |
| CCDC88C | SNV | Missense_Mutation | c.4153G>A | p.Glu1385Lys | p.E1385K | Q9P219 | protein_coding | deleterious(0) | probably_damaging(0.999) | TCGA-EW-A1J5-01 | Breast | breast invasive carcinoma | Female | <65 | I/II | Chemotherapy | adriamycin | SD | |
| CCDC88C | SNV | Missense_Mutation | c.2512G>A | p.Glu838Lys | p.E838K | Q9P219 | protein_coding | deleterious(0) | possibly_damaging(0.698) | TCGA-EW-A1PD-01 | Breast | breast invasive carcinoma | Male | <65 | I/II | Chemotherapy | docetaxel | SD | |
| CCDC88C | insertion | Frame_Shift_Ins | novel | c.4273_4274insTCAACACGTTCTCCATGTATATAAGACCT | p.Arg1425LeufsTer12 | p.R1425Lfs*12 | Q9P219 | protein_coding | TCGA-AN-A0FW-01 | Breast | breast invasive carcinoma | Female | >=65 | III/IV | Unknown | Unknown | SD | ||
| CCDC88C | insertion | Nonsense_Mutation | novel | c.1863_1864insATTCAATATTTTGATCTCCACTTCTCCTGTGTCTAAGCAAT | p.Gln622IlefsTer12 | p.Q622Ifs*12 | Q9P219 | protein_coding | TCGA-AO-A0JB-01 | Breast | breast invasive carcinoma | Female | <65 | III/IV | Chemotherapy | cyclophosphamide | SD |
| Page: 1 2 3 4 5 6 7 8 9 10 11 12 13 14 15 16 |
Top |
Related drugs of malignant transformation related genes |
| Identification of chemicals and drugs interact with genes involved in malignant transfromation |
| (DGIdb 4.0) |
| Entrez ID | Symbol | Category | Interaction Types | Drug Claim Name | Drug Name | PMIDs |
| Page: 1 |

Copyright 2023-Present -The University of Texas Health Science Center at Houston |