
|
|||||
|
 | |
| |
| |
| |
| |
| |
|
Gene: CCDC88B |
Gene summary for CCDC88B |
| Gene information | Species | Human | Gene symbol | CCDC88B | Gene ID | 283234 |
| Gene name | coiled-coil domain containing 88B | |
| Gene Alias | BRLZ | |
| Cytomap | 11q13.1 | |
| Gene Type | protein-coding | GO ID | GO:0000226 | UniProtAcc | A6NC98 |
Top |
Malignant transformation analysis |
| Identification of the aberrant gene expression in precancerous and cancerous lesions by comparing the gene expression of stem-like cells in diseased tissues with normal stem cells |
| Entrez ID | Symbol | Replicates | Species | Organ | Tissue | Adj P-value | Log2FC | Malignancy |
| 283234 | CCDC88B | HTA11_78_2000001011 | Human | Colorectum | AD | 1.61e-03 | -3.84e-01 | -0.1088 |
| 283234 | CCDC88B | HTA11_347_2000001011 | Human | Colorectum | AD | 1.78e-09 | -4.18e-01 | -0.1954 |
| 283234 | CCDC88B | HTA11_99999974143_84620 | Human | Colorectum | MSS | 1.05e-04 | -3.71e-01 | 0.3005 |
| 283234 | CCDC88B | A015-C-203 | Human | Colorectum | FAP | 2.06e-23 | 6.55e-01 | -0.1294 |
| 283234 | CCDC88B | A015-C-204 | Human | Colorectum | FAP | 3.00e-10 | 7.46e-01 | -0.0228 |
| 283234 | CCDC88B | A001-C-108 | Human | Colorectum | FAP | 3.33e-04 | -2.68e-01 | -0.0272 |
| 283234 | CCDC88B | A002-C-205 | Human | Colorectum | FAP | 3.75e-05 | 3.09e-01 | -0.1236 |
| 283234 | CCDC88B | A015-C-005 | Human | Colorectum | FAP | 2.72e-03 | 5.38e-01 | -0.0336 |
| 283234 | CCDC88B | A015-C-006 | Human | Colorectum | FAP | 1.98e-03 | 3.74e-01 | -0.0994 |
| 283234 | CCDC88B | A015-C-106 | Human | Colorectum | FAP | 2.17e-06 | 4.26e-01 | -0.0511 |
| 283234 | CCDC88B | A002-C-114 | Human | Colorectum | FAP | 1.42e-10 | 6.22e-01 | -0.1561 |
| 283234 | CCDC88B | A015-C-104 | Human | Colorectum | FAP | 1.75e-29 | 7.79e-01 | -0.1899 |
| 283234 | CCDC88B | A015-C-002 | Human | Colorectum | FAP | 4.72e-17 | 9.32e-01 | -0.0763 |
| 283234 | CCDC88B | A002-C-116 | Human | Colorectum | FAP | 7.56e-07 | 9.76e-02 | -0.0452 |
| 283234 | CCDC88B | A018-E-020 | Human | Colorectum | FAP | 2.84e-02 | 8.58e-03 | -0.2034 |
| 283234 | CCDC88B | F034 | Human | Colorectum | FAP | 1.89e-08 | 3.85e-01 | -0.0665 |
| 283234 | CCDC88B | CRC-1-8810 | Human | Colorectum | CRC | 3.12e-10 | -3.88e-01 | 0.6257 |
| 283234 | CCDC88B | CRC-3-11773 | Human | Colorectum | CRC | 1.01e-36 | 9.66e-01 | 0.2564 |
| 283234 | CCDC88B | P4T-E | Human | Esophagus | ESCC | 1.99e-07 | 2.18e-01 | 0.1323 |
| 283234 | CCDC88B | P8T-E | Human | Esophagus | ESCC | 6.50e-05 | 1.18e-01 | 0.0889 |
| Page: 1 2 |
| Tissue | Expression Dynamics | Abbreviation |
| Colorectum (GSE201348) |  | FAP: Familial adenomatous polyposis |
| CRC: Colorectal cancer | ||
| Colorectum (HTA11) |  | AD: Adenomas |
| SER: Sessile serrated lesions | ||
| MSI-H: Microsatellite-high colorectal cancer | ||
| MSS: Microsatellite stable colorectal cancer | ||
| Esophagus | 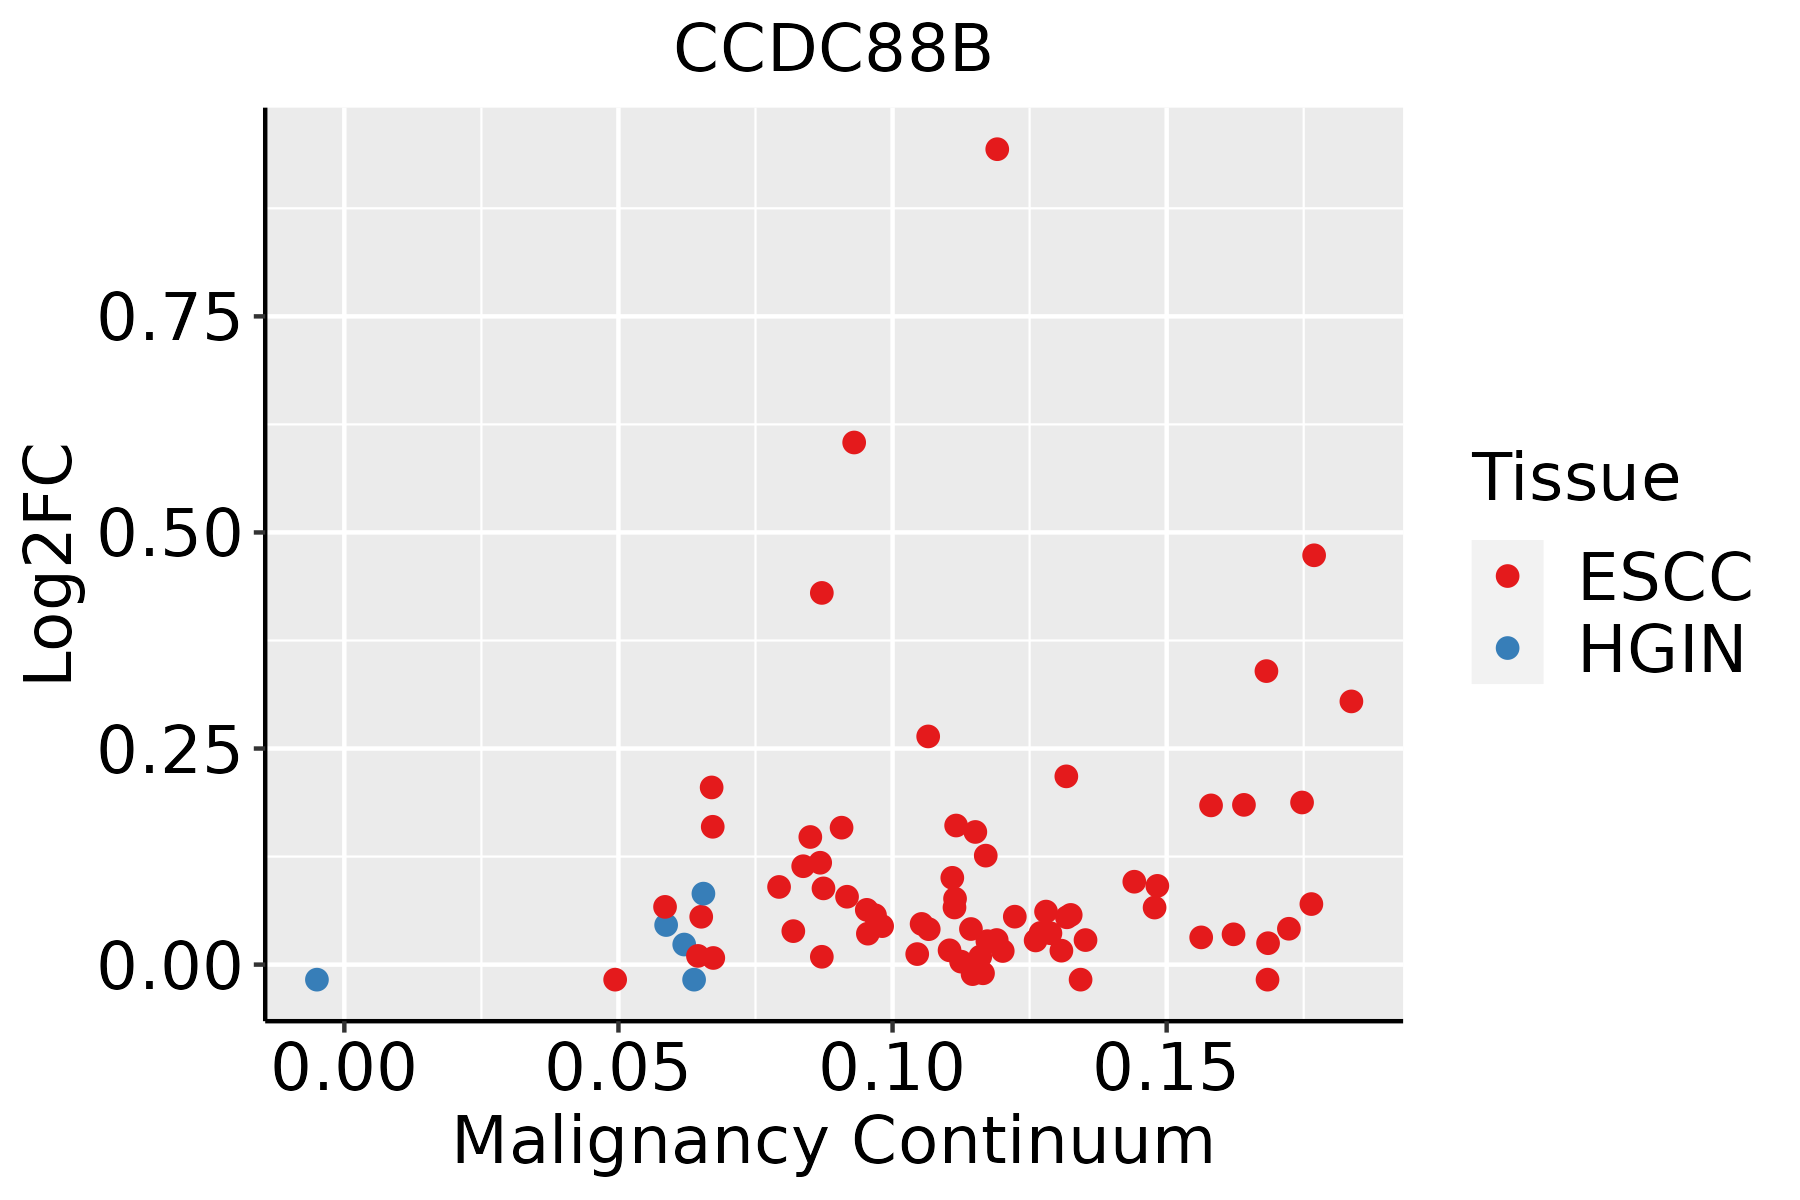 | ESCC: Esophageal squamous cell carcinoma |
| HGIN: High-grade intraepithelial neoplasias | ||
| LGIN: Low-grade intraepithelial neoplasias | ||
| Liver | 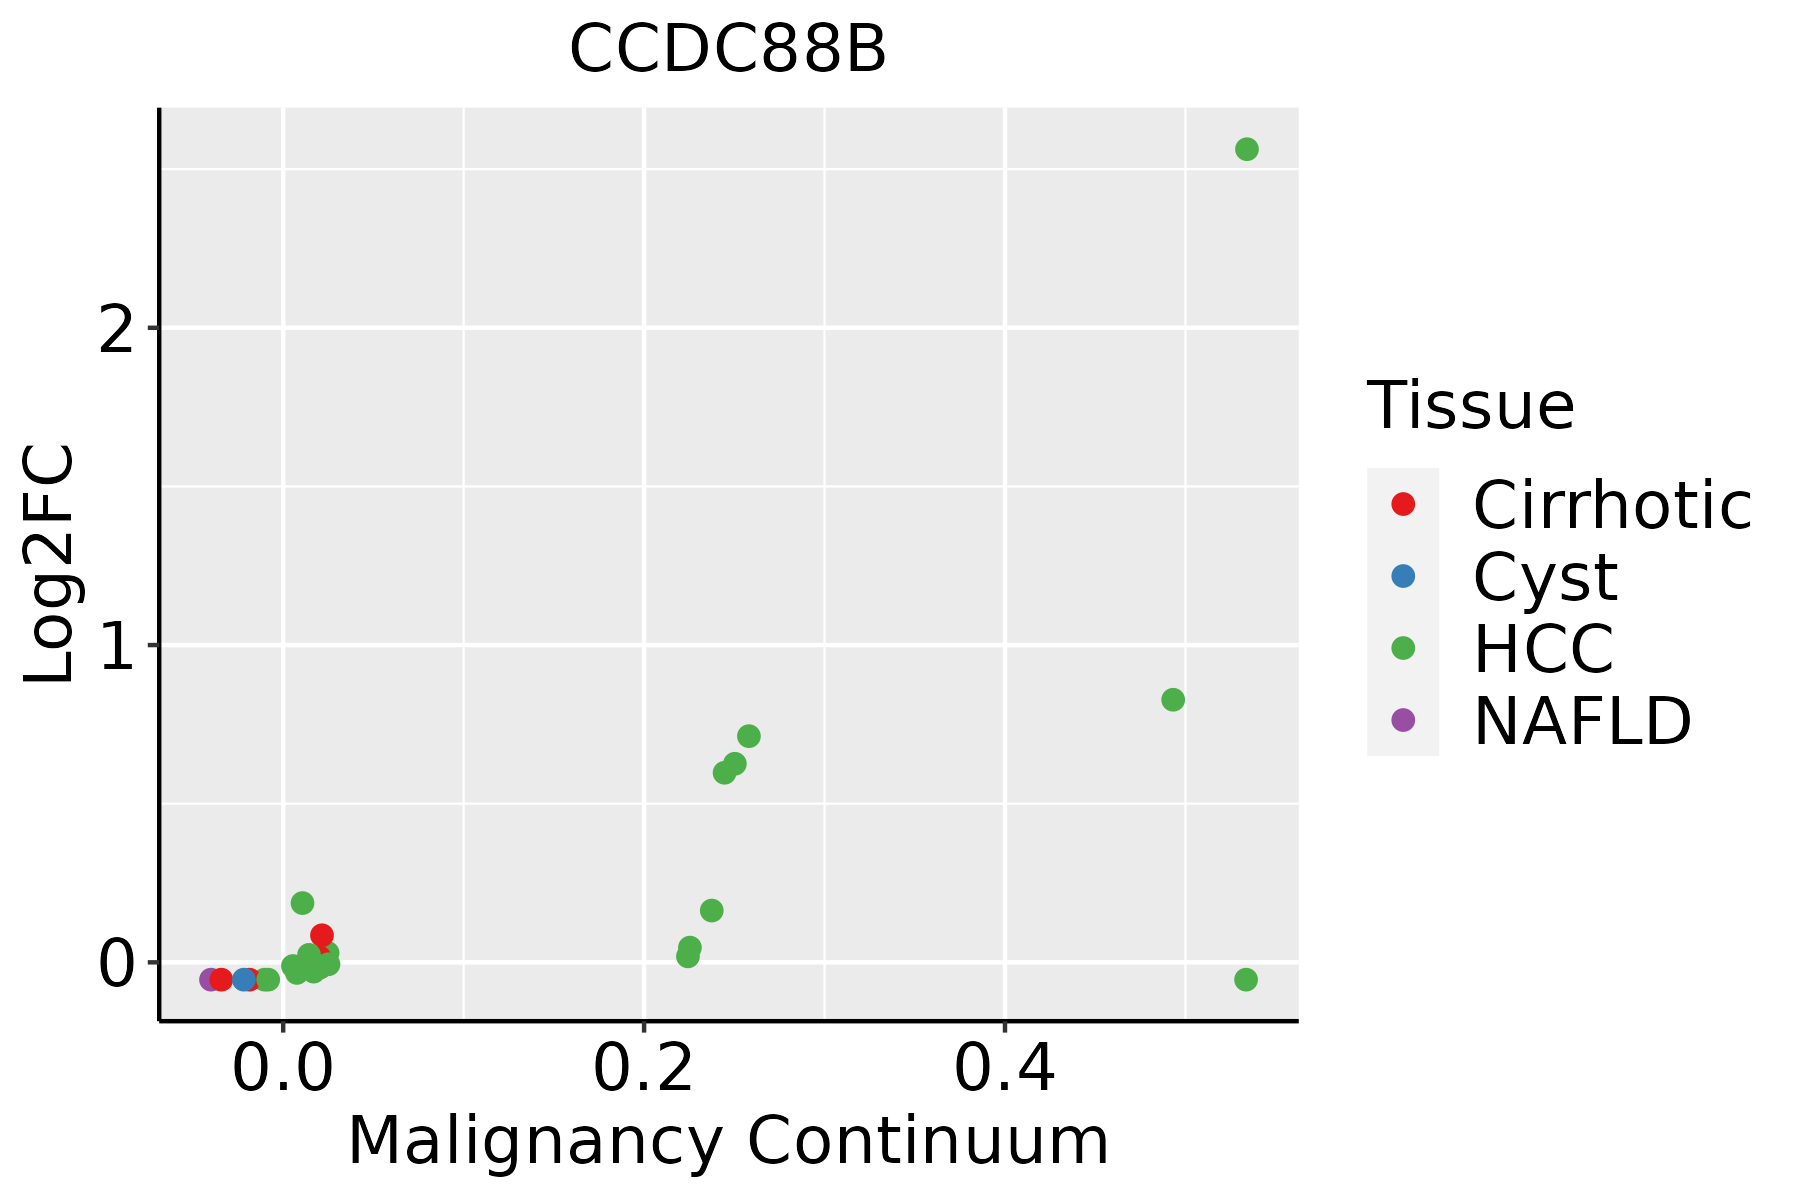 | HCC: Hepatocellular carcinoma |
| NAFLD: Non-alcoholic fatty liver disease |
| ∗log2FC in expression of this searched gene in stem-like cells from each diseased tissue sample relative to stem-like cells in normal samples in each tissue plotted against the malignancy continuum. Samples are colored based on if they are from different disease stage. |
Top |
Malignant transformation related pathway analysis |
| Find out the enriched GO biological processes and KEGG pathways involved in transition from healthy to precancer to cancer |
| Tissue | Disease Stage | Enriched GO biological Processes |
| Colorectum | AD |  |
| Colorectum | SER |  |
| Colorectum | MSS |  |
| Colorectum | MSI-H |  |
| Colorectum | FAP |  |
| ∗Top 15 enriched GO BP terms are showed in the bar plot of each disease state in each tissue. Each row represents a significant GO biological process which is colored according to the -log10(p.adjust). |
| Page: 1 2 3 4 5 6 7 8 9 |
| GO ID | Tissue | Disease Stage | Description | Gene Ratio | Bg Ratio | pvalue | p.adjust | Count |
| GO:0045785 | Colorectum | AD | positive regulation of cell adhesion | 122/3918 | 437/18723 | 2.65e-04 | 3.28e-03 | 122 |
| GO:0030705 | Colorectum | AD | cytoskeleton-dependent intracellular transport | 60/3918 | 195/18723 | 7.56e-04 | 7.59e-03 | 60 |
| GO:00457852 | Colorectum | MSS | positive regulation of cell adhesion | 110/3467 | 437/18723 | 2.94e-04 | 3.87e-03 | 110 |
| GO:00307052 | Colorectum | MSS | cytoskeleton-dependent intracellular transport | 52/3467 | 195/18723 | 3.07e-03 | 2.34e-02 | 52 |
| GO:00457854 | Colorectum | FAP | positive regulation of cell adhesion | 92/2622 | 437/18723 | 3.09e-05 | 7.04e-04 | 92 |
| GO:00307053 | Colorectum | FAP | cytoskeleton-dependent intracellular transport | 47/2622 | 195/18723 | 1.06e-04 | 1.76e-03 | 47 |
| GO:0031122 | Colorectum | FAP | cytoplasmic microtubule organization | 17/2622 | 56/18723 | 1.24e-03 | 1.16e-02 | 17 |
| GO:00307054 | Colorectum | CRC | cytoskeleton-dependent intracellular transport | 45/2078 | 195/18723 | 1.29e-06 | 7.21e-05 | 45 |
| GO:00457855 | Colorectum | CRC | positive regulation of cell adhesion | 81/2078 | 437/18723 | 2.28e-06 | 1.10e-04 | 81 |
| GO:00311221 | Colorectum | CRC | cytoplasmic microtubule organization | 16/2078 | 56/18723 | 2.72e-04 | 4.37e-03 | 16 |
| GO:0022407 | Colorectum | CRC | regulation of cell-cell adhesion | 67/2078 | 448/18723 | 6.86e-03 | 4.81e-02 | 67 |
| GO:003070518 | Esophagus | ESCC | cytoskeleton-dependent intracellular transport | 133/8552 | 195/18723 | 1.48e-10 | 4.27e-09 | 133 |
| GO:004578527 | Esophagus | ESCC | positive regulation of cell adhesion | 255/8552 | 437/18723 | 5.07e-08 | 9.11e-07 | 255 |
| GO:002240720 | Esophagus | ESCC | regulation of cell-cell adhesion | 239/8552 | 448/18723 | 5.88e-04 | 3.19e-03 | 239 |
| GO:00311227 | Esophagus | ESCC | cytoplasmic microtubule organization | 38/8552 | 56/18723 | 6.60e-04 | 3.50e-03 | 38 |
| GO:004211018 | Esophagus | ESCC | T cell activation | 256/8552 | 487/18723 | 1.18e-03 | 5.87e-03 | 256 |
| GO:002240919 | Esophagus | ESCC | positive regulation of cell-cell adhesion | 155/8552 | 284/18723 | 1.50e-03 | 7.06e-03 | 155 |
| GO:000181916 | Esophagus | ESCC | positive regulation of cytokine production | 244/8552 | 467/18723 | 2.29e-03 | 1.01e-02 | 244 |
| GO:005087015 | Esophagus | ESCC | positive regulation of T cell activation | 117/8552 | 216/18723 | 7.23e-03 | 2.62e-02 | 117 |
| GO:190303916 | Esophagus | ESCC | positive regulation of leukocyte cell-cell adhesion | 128/8552 | 239/18723 | 8.40e-03 | 2.96e-02 | 128 |
| Page: 1 2 |
| Pathway ID | Tissue | Disease Stage | Description | Gene Ratio | Bg Ratio | pvalue | p.adjust | qvalue | Count |
| Page: 1 |
Top |
Cell-cell communication analysis |
| Identification of potential cell-cell interactions between two cell types and their ligand-receptor pairs for different disease states |
| Ligand | Receptor | LRpair | Pathway | Tissue | Disease Stage |
| Page: 1 |
Top |
Single-cell gene regulatory network inference analysis |
| Find out the significant the regulons (TFs) and the target genes of each regulon across cell types for different disease states |
| TF | Cell Type | Tissue | Disease Stage | Target Gene | RSS | Regulon Activity |
| ∗The dot plots of a searched regulon are shown for all cell subpopulations in each disease state of each tissue based on the regulon specific score inferred using pySCENIC and by calculating the average expression. |
| Page: 1 |
Top |
Somatic mutation of malignant transformation related genes |
| Annotation of somatic variants for genes involved in malignant transformation |
| Hugo Symbol | Variant Class | Variant Classification | dbSNP RS | HGVSc | HGVSp | HGVSp Short | SWISSPROT | BIOTYPE | SIFT | PolyPhen | Tumor Sample Barcode | Tissue | Histology | Sex | Age | Stage | Therapy Types | Drugs | Outcome |
| CCDC88B | SNV | Missense_Mutation | c.1750N>A | p.Glu584Lys | p.E584K | A6NC98 | protein_coding | tolerated_low_confidence(0.06) | benign(0.079) | TCGA-BH-A18H-01 | Breast | breast invasive carcinoma | Female | <65 | I/II | Chemotherapy | adriamycin | CR | |
| CCDC88B | SNV | Missense_Mutation | rs557823274 | c.2678N>A | p.Arg893His | p.R893H | A6NC98 | protein_coding | tolerated(1) | benign(0.107) | TCGA-E2-A2P5-01 | Breast | breast invasive carcinoma | Female | >=65 | III/IV | Hormone Therapy | arimidex | PD |
| CCDC88B | SNV | Missense_Mutation | novel | c.2420C>T | p.Ala807Val | p.A807V | A6NC98 | protein_coding | tolerated(0.95) | benign(0.383) | TCGA-EA-A3HS-01 | Cervix | cervical & endocervical cancer | Female | <65 | I/II | Unknown | Unknown | SD |
| CCDC88B | SNV | Missense_Mutation | c.2581N>A | p.Glu861Lys | p.E861K | A6NC98 | protein_coding | deleterious(0.01) | probably_damaging(0.978) | TCGA-EK-A2IP-01 | Cervix | cervical & endocervical cancer | Female | <65 | I/II | Unknown | Unknown | SD | |
| CCDC88B | SNV | Missense_Mutation | c.2701N>C | p.Glu901Gln | p.E901Q | A6NC98 | protein_coding | deleterious(0.04) | benign(0.412) | TCGA-EK-A2IP-01 | Cervix | cervical & endocervical cancer | Female | <65 | I/II | Unknown | Unknown | SD | |
| CCDC88B | SNV | Missense_Mutation | novel | c.1079C>G | p.Ser360Trp | p.S360W | A6NC98 | protein_coding | deleterious(0) | probably_damaging(1) | TCGA-IR-A3LA-01 | Cervix | cervical & endocervical cancer | Female | <65 | I/II | Chemotherapy | cisplatin | CR |
| CCDC88B | SNV | Missense_Mutation | rs746620915 | c.3259N>T | p.Arg1087Trp | p.R1087W | A6NC98 | protein_coding | deleterious(0) | probably_damaging(0.998) | TCGA-MY-A5BD-01 | Cervix | cervical & endocervical cancer | Female | <65 | I/II | Chemotherapy | cisplatin | CR |
| CCDC88B | SNV | Missense_Mutation | rs747595586 | c.422G>A | p.Arg141Gln | p.R141Q | A6NC98 | protein_coding | tolerated(0.31) | benign(0.075) | TCGA-ZJ-A8QR-01 | Cervix | cervical & endocervical cancer | Female | <65 | I/II | Unknown | Unknown | SD |
| CCDC88B | SNV | Missense_Mutation | rs756702849 | c.3854G>A | p.Arg1285His | p.R1285H | A6NC98 | protein_coding | deleterious(0) | probably_damaging(0.995) | TCGA-A6-6781-01 | Colorectum | colon adenocarcinoma | Male | <65 | III/IV | Chemotherapy | oxaliplatin | SD |
| CCDC88B | SNV | Missense_Mutation | c.1265N>C | p.Leu422Pro | p.L422P | A6NC98 | protein_coding | deleterious(0) | probably_damaging(1) | TCGA-AA-3663-01 | Colorectum | colon adenocarcinoma | Male | <65 | I/II | Unknown | Unknown | SD |
| Page: 1 2 3 4 5 6 7 8 9 10 |
Top |
Related drugs of malignant transformation related genes |
| Identification of chemicals and drugs interact with genes involved in malignant transfromation |
| (DGIdb 4.0) |
| Entrez ID | Symbol | Category | Interaction Types | Drug Claim Name | Drug Name | PMIDs |
| Page: 1 |

Copyright 2023-Present -The University of Texas Health Science Center at Houston |