
|
|||||
|
 | |
| |
| |
| |
| |
| |
|
Gene: CCDC85B |
Gene summary for CCDC85B |
| Gene information | Species | Human | Gene symbol | CCDC85B | Gene ID | 11007 |
| Gene name | coiled-coil domain containing 85B | |
| Gene Alias | DIPA | |
| Cytomap | 11q13.1 | |
| Gene Type | protein-coding | GO ID | GO:0001558 | UniProtAcc | Q15834 |
Top |
Malignant transformation analysis |
| Identification of the aberrant gene expression in precancerous and cancerous lesions by comparing the gene expression of stem-like cells in diseased tissues with normal stem cells |
| Entrez ID | Symbol | Replicates | Species | Organ | Tissue | Adj P-value | Log2FC | Malignancy |
| 11007 | CCDC85B | CA_HPV_1 | Human | Cervix | CC | 7.58e-12 | -1.75e-01 | 0.0264 |
| 11007 | CCDC85B | N_HPV_1 | Human | Cervix | N_HPV | 4.13e-02 | 5.67e-02 | 0.0079 |
| 11007 | CCDC85B | CCI_1 | Human | Cervix | CC | 4.39e-07 | -5.19e-01 | 0.528 |
| 11007 | CCDC85B | CCI_3 | Human | Cervix | CC | 7.49e-04 | -4.42e-01 | 0.516 |
| 11007 | CCDC85B | CCII_1 | Human | Cervix | CC | 3.54e-11 | -5.07e-01 | 0.3249 |
| 11007 | CCDC85B | H2 | Human | Cervix | HSIL_HPV | 6.52e-04 | -2.57e-01 | 0.0632 |
| 11007 | CCDC85B | L1 | Human | Cervix | CC | 1.67e-04 | -1.35e-01 | 0.0802 |
| 11007 | CCDC85B | HTA11_696_2000001011 | Human | Colorectum | AD | 2.26e-02 | 1.62e-01 | -0.1464 |
| 11007 | CCDC85B | HTA11_1391_2000001011 | Human | Colorectum | AD | 1.97e-12 | 4.11e-01 | -0.059 |
| 11007 | CCDC85B | HTA11_866_3004761011 | Human | Colorectum | AD | 9.27e-09 | 2.78e-01 | 0.096 |
| 11007 | CCDC85B | HTA11_4255_2000001011 | Human | Colorectum | SER | 1.47e-02 | 2.88e-01 | 0.0446 |
| 11007 | CCDC85B | HTA11_7696_3000711011 | Human | Colorectum | AD | 2.03e-05 | 2.49e-01 | 0.0674 |
| 11007 | CCDC85B | HTA11_6818_2000001011 | Human | Colorectum | AD | 4.67e-04 | 2.18e-01 | 0.0112 |
| 11007 | CCDC85B | HTA11_6818_2000001021 | Human | Colorectum | AD | 2.34e-11 | 4.89e-01 | 0.0588 |
| 11007 | CCDC85B | HTA11_99999970781_79442 | Human | Colorectum | MSS | 1.81e-10 | 3.07e-01 | 0.294 |
| 11007 | CCDC85B | HTA11_99999965104_69814 | Human | Colorectum | MSS | 9.62e-04 | 2.15e-01 | 0.281 |
| 11007 | CCDC85B | HTA11_99999971662_82457 | Human | Colorectum | MSS | 3.22e-53 | 1.06e+00 | 0.3859 |
| 11007 | CCDC85B | HTA11_99999973899_84307 | Human | Colorectum | MSS | 5.44e-03 | 3.15e-01 | 0.2585 |
| 11007 | CCDC85B | HTA11_99999974143_84620 | Human | Colorectum | MSS | 1.36e-22 | 5.56e-01 | 0.3005 |
| 11007 | CCDC85B | A002-C-116 | Human | Colorectum | FAP | 7.81e-03 | 3.17e-01 | -0.0452 |
| Page: 1 2 3 4 5 6 7 8 9 10 |
| Tissue | Expression Dynamics | Abbreviation |
| Cervix | 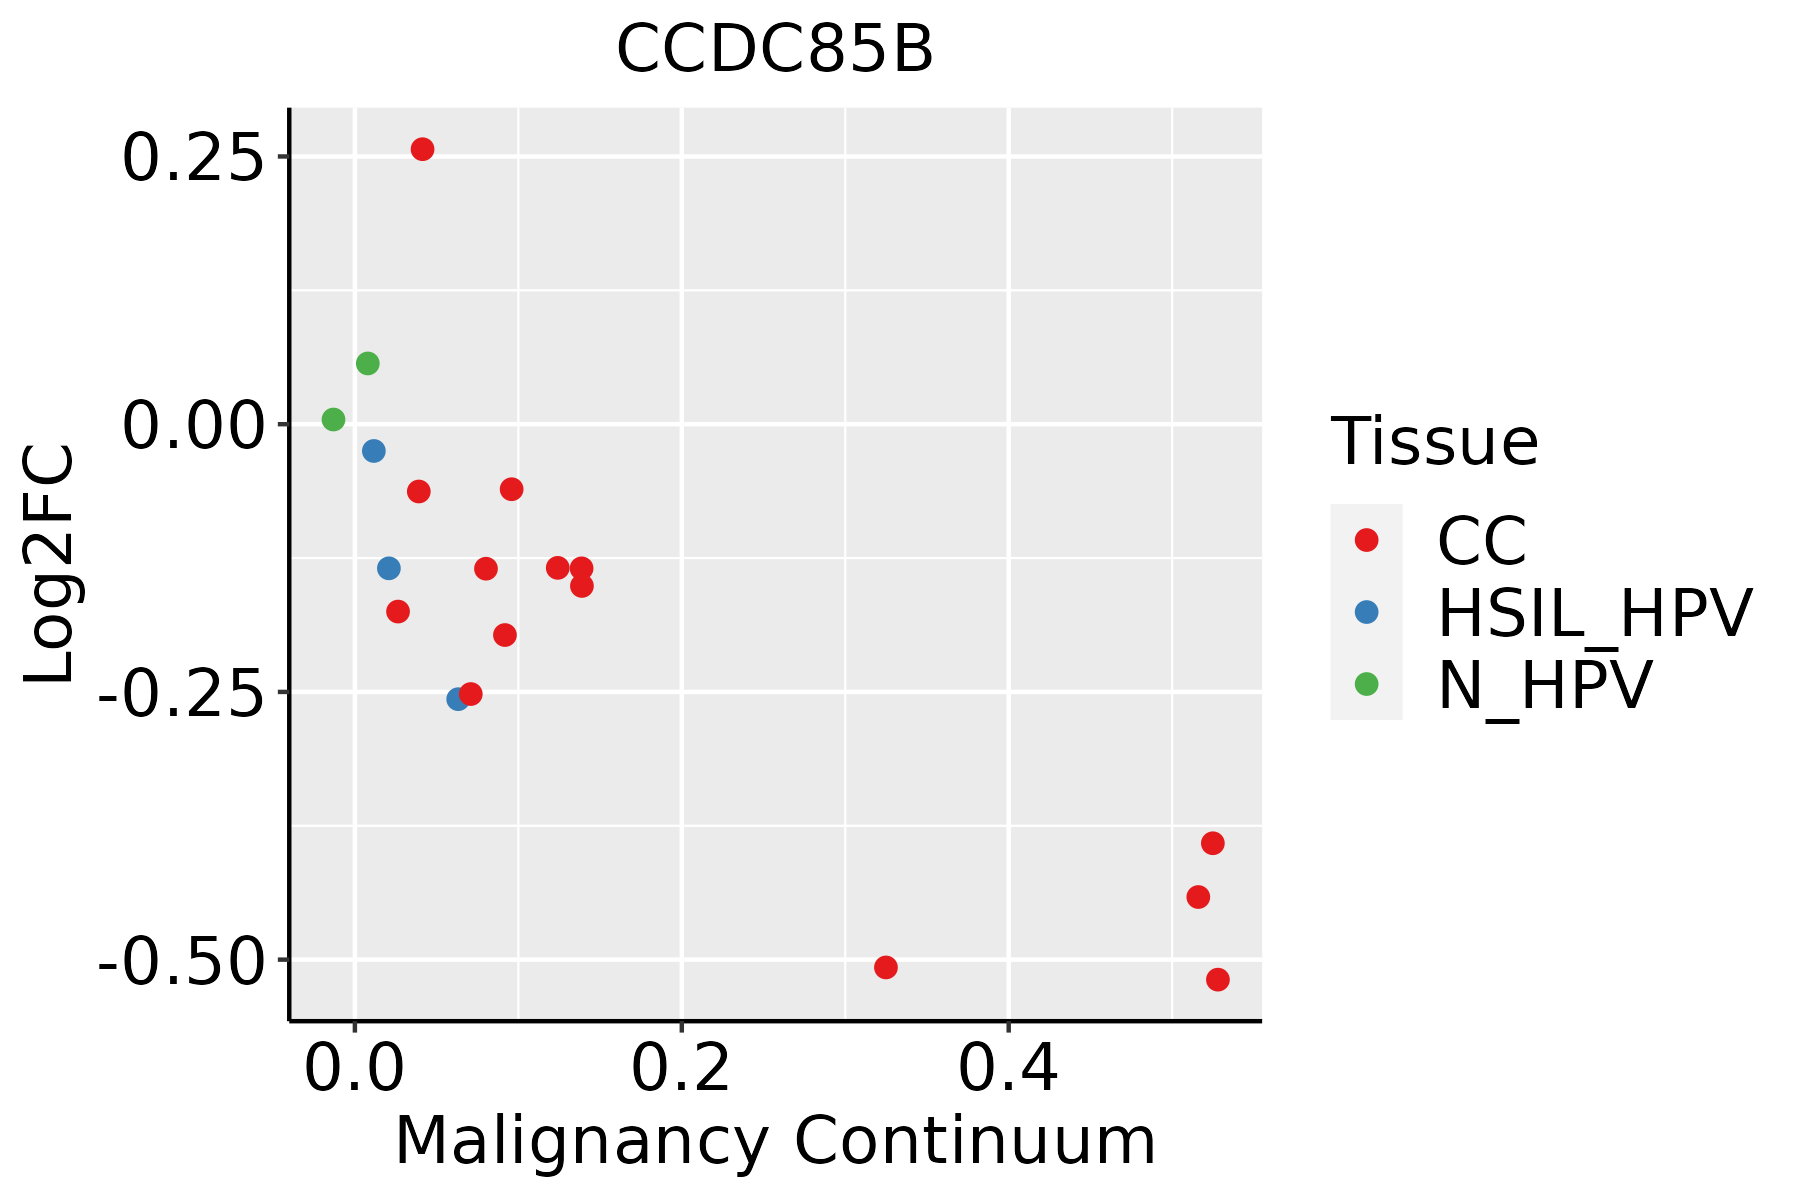 | CC: Cervix cancer |
| HSIL_HPV: HPV-infected high-grade squamous intraepithelial lesions | ||
| N_HPV: HPV-infected normal cervix | ||
| Colorectum (GSE201348) |  | FAP: Familial adenomatous polyposis |
| CRC: Colorectal cancer | ||
| Colorectum (HTA11) |  | AD: Adenomas |
| SER: Sessile serrated lesions | ||
| MSI-H: Microsatellite-high colorectal cancer | ||
| MSS: Microsatellite stable colorectal cancer | ||
| Endometrium | 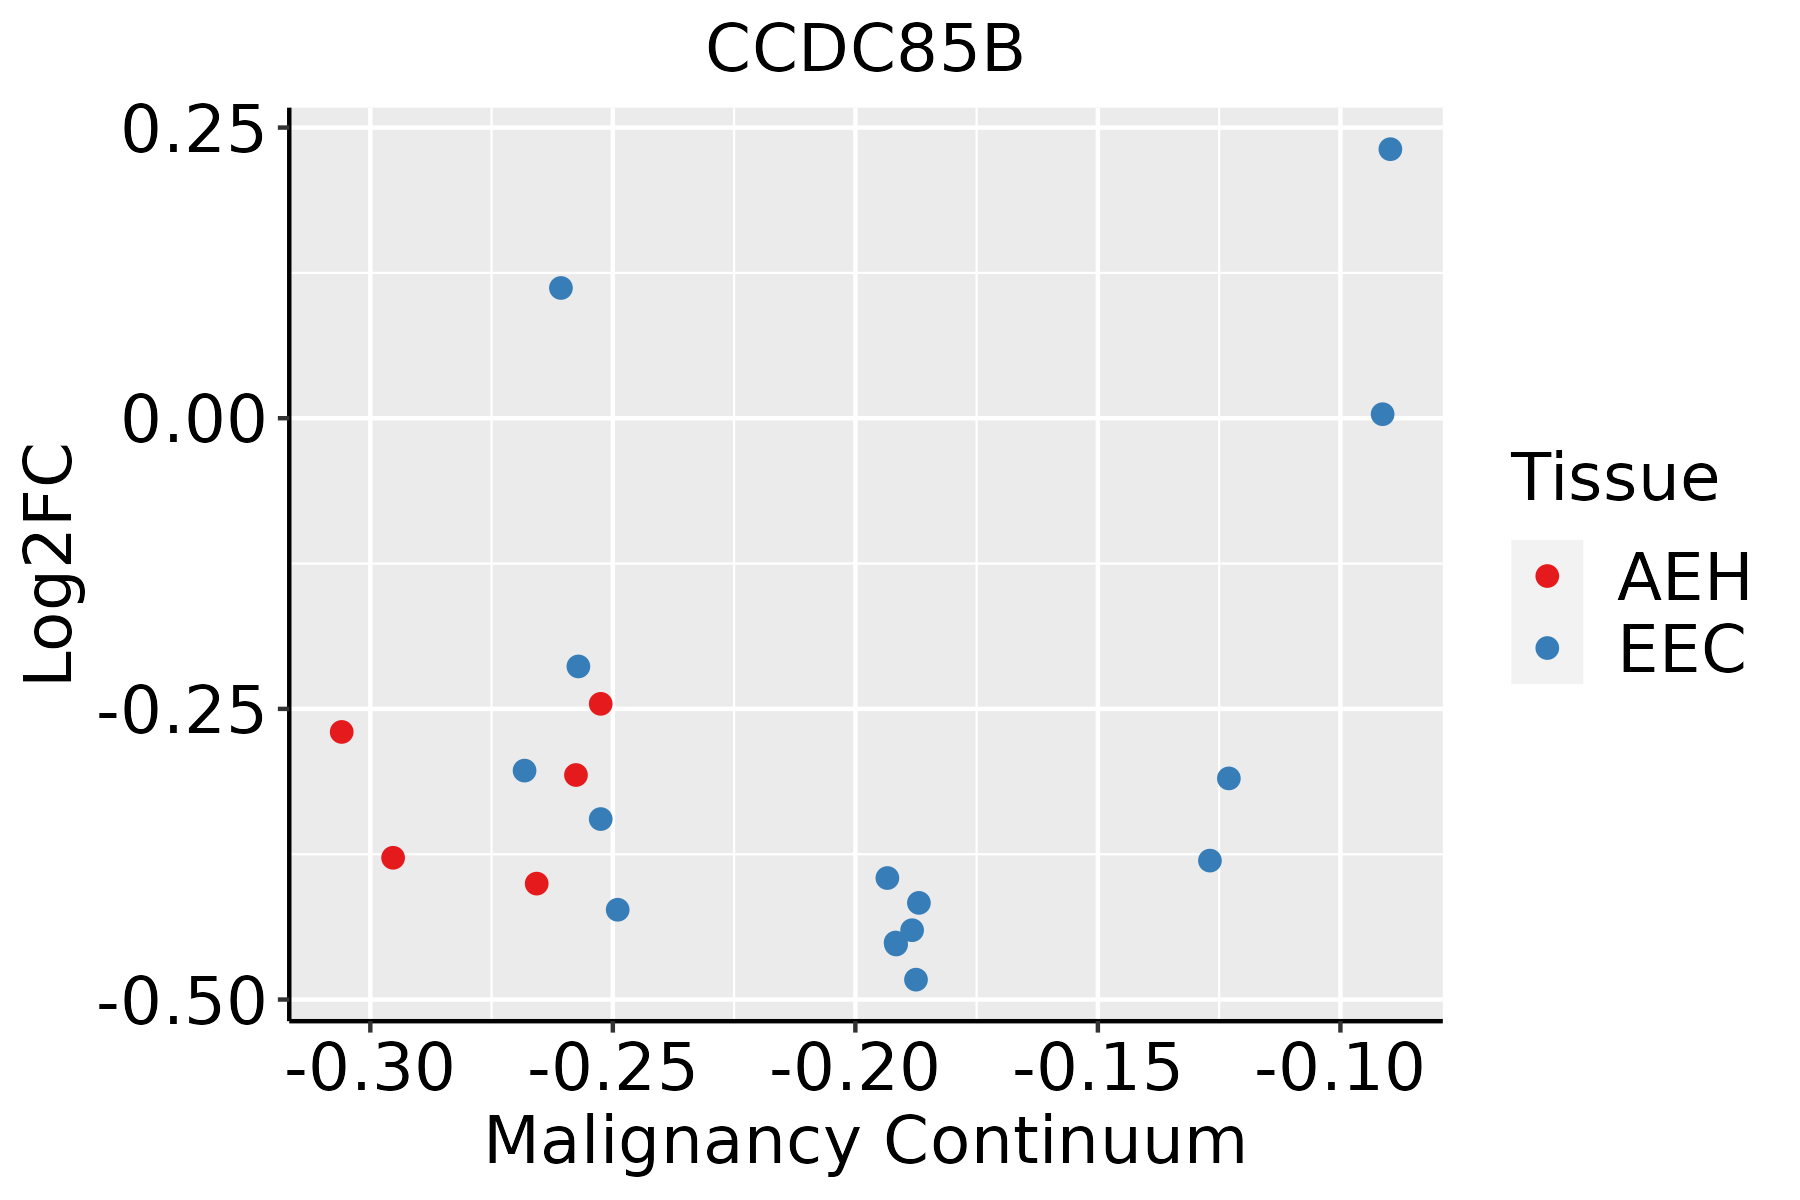 | AEH: Atypical endometrial hyperplasia |
| EEC: Endometrioid Cancer | ||
| Esophagus |  | ESCC: Esophageal squamous cell carcinoma |
| HGIN: High-grade intraepithelial neoplasias | ||
| LGIN: Low-grade intraepithelial neoplasias | ||
| Liver |  | HCC: Hepatocellular carcinoma |
| NAFLD: Non-alcoholic fatty liver disease | ||
| Oral Cavity |  | EOLP: Erosive Oral lichen planus |
| LP: leukoplakia | ||
| NEOLP: Non-erosive oral lichen planus | ||
| OSCC: Oral squamous cell carcinoma | ||
| Prostate | 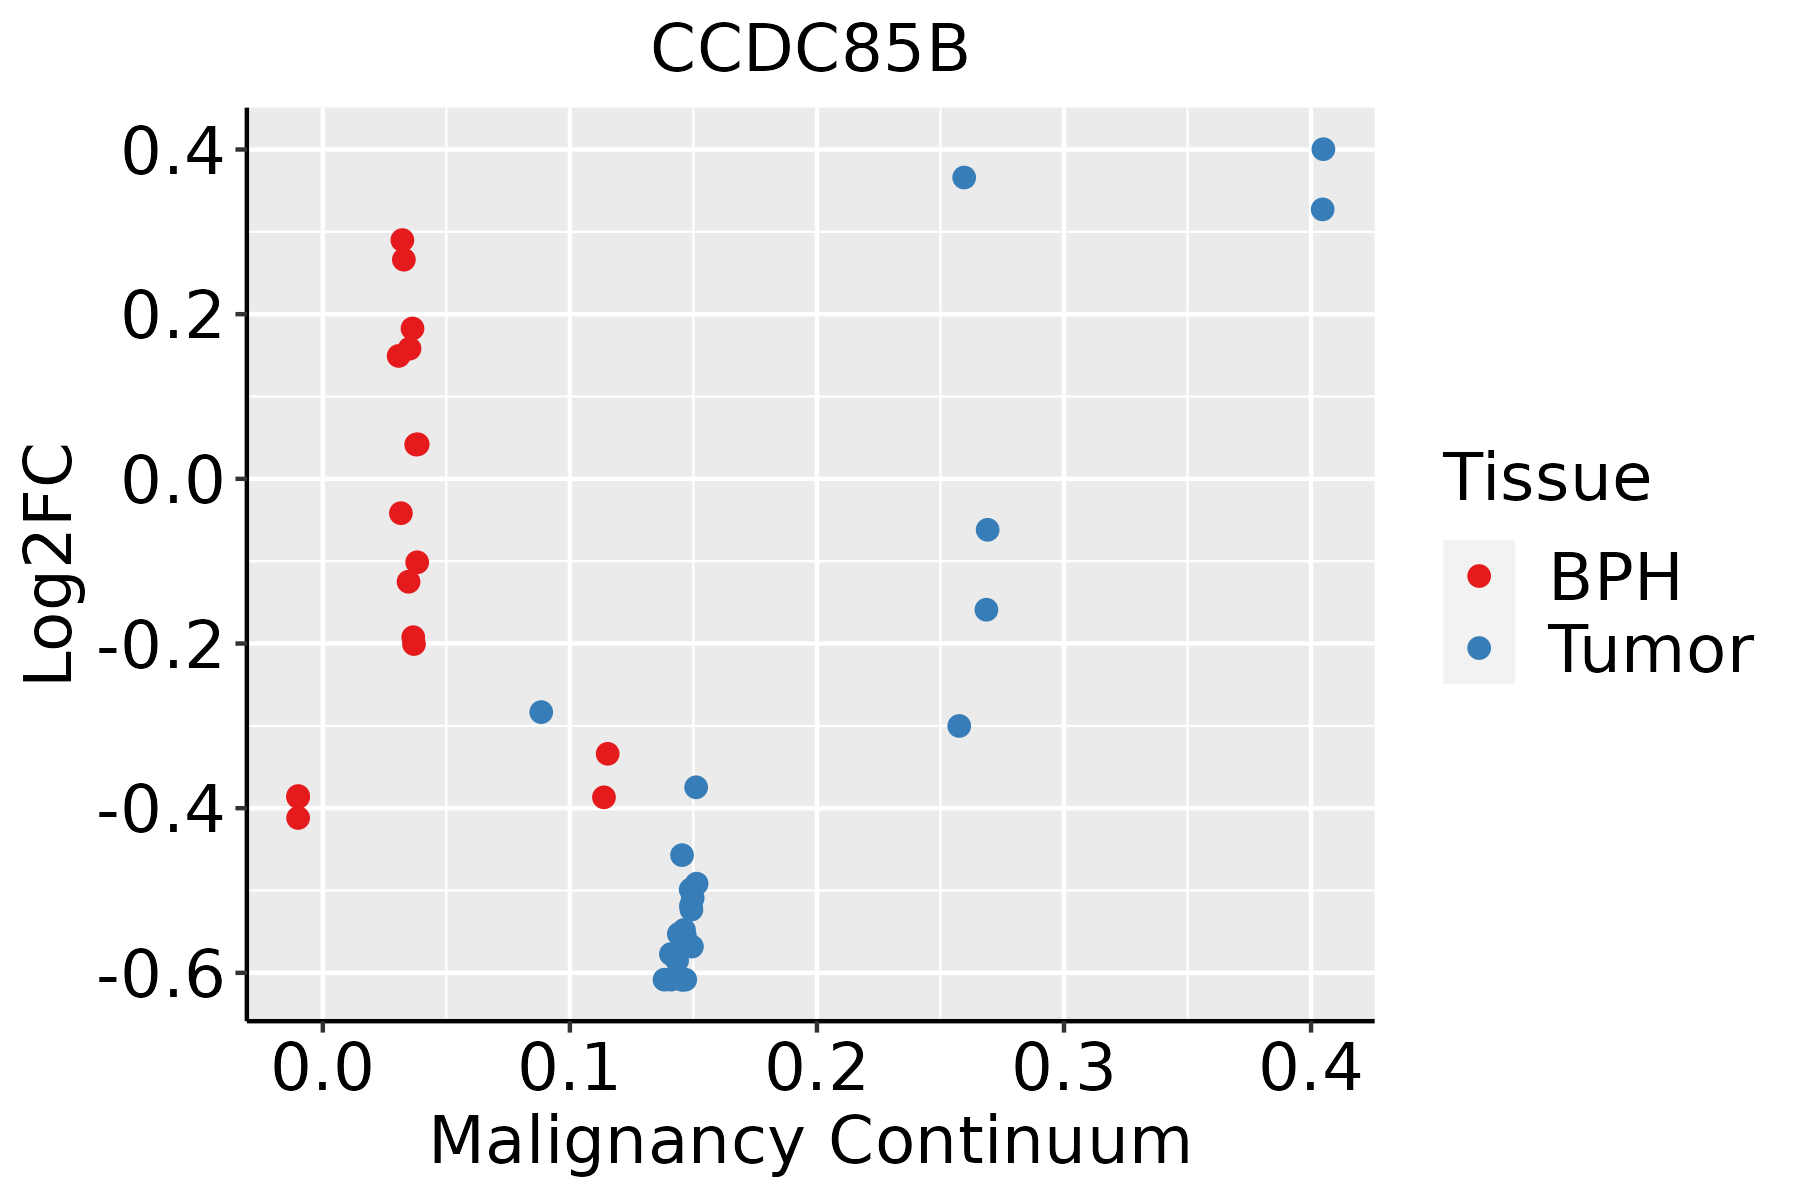 | BPH: Benign Prostatic Hyperplasia |
| Skin |  | AK: Actinic keratosis |
| cSCC: Cutaneous squamous cell carcinoma | ||
| SCCIS:squamous cell carcinoma in situ | ||
| Thyroid |  | ATC: Anaplastic thyroid cancer |
| HT: Hashimoto's thyroiditis | ||
| PTC: Papillary thyroid cancer |
| ∗log2FC in expression of this searched gene in stem-like cells from each diseased tissue sample relative to stem-like cells in normal samples in each tissue plotted against the malignancy continuum. Samples are colored based on if they are from different disease stage. |
Top |
Malignant transformation related pathway analysis |
| Find out the enriched GO biological processes and KEGG pathways involved in transition from healthy to precancer to cancer |
| Tissue | Disease Stage | Enriched GO biological Processes |
| Colorectum | AD |  |
| Colorectum | SER |  |
| Colorectum | MSS |  |
| Colorectum | MSI-H |  |
| Colorectum | FAP |  |
| ∗Top 15 enriched GO BP terms are showed in the bar plot of each disease state in each tissue. Each row represents a significant GO biological process which is colored according to the -log10(p.adjust). |
| Page: 1 2 3 4 5 6 7 8 9 |
| GO ID | Tissue | Disease Stage | Description | Gene Ratio | Bg Ratio | pvalue | p.adjust | Count |
| GO:00454445 | Cervix | CC | fat cell differentiation | 53/2311 | 229/18723 | 3.72e-06 | 9.75e-05 | 53 |
| GO:00160498 | Cervix | CC | cell growth | 92/2311 | 482/18723 | 1.16e-05 | 2.49e-04 | 92 |
| GO:00015588 | Cervix | CC | regulation of cell growth | 77/2311 | 414/18723 | 1.40e-04 | 1.70e-03 | 77 |
| GO:0045598 | Cervix | CC | regulation of fat cell differentiation | 31/2311 | 139/18723 | 7.06e-04 | 6.41e-03 | 31 |
| GO:001604914 | Cervix | HSIL_HPV | cell growth | 32/737 | 482/18723 | 2.87e-03 | 2.70e-02 | 32 |
| GO:004544413 | Cervix | HSIL_HPV | fat cell differentiation | 18/737 | 229/18723 | 4.27e-03 | 3.64e-02 | 18 |
| GO:0016049 | Colorectum | AD | cell growth | 143/3918 | 482/18723 | 2.83e-06 | 8.09e-05 | 143 |
| GO:0001558 | Colorectum | AD | regulation of cell growth | 124/3918 | 414/18723 | 7.67e-06 | 1.86e-04 | 124 |
| GO:0045926 | Colorectum | AD | negative regulation of growth | 70/3918 | 249/18723 | 4.07e-03 | 2.83e-02 | 70 |
| GO:00015581 | Colorectum | SER | regulation of cell growth | 90/2897 | 414/18723 | 4.00e-04 | 6.02e-03 | 90 |
| GO:00160491 | Colorectum | SER | cell growth | 100/2897 | 482/18723 | 1.07e-03 | 1.24e-02 | 100 |
| GO:00459261 | Colorectum | SER | negative regulation of growth | 55/2897 | 249/18723 | 3.44e-03 | 2.92e-02 | 55 |
| GO:0045444 | Colorectum | SER | fat cell differentiation | 51/2897 | 229/18723 | 3.96e-03 | 3.26e-02 | 51 |
| GO:00160492 | Colorectum | MSS | cell growth | 123/3467 | 482/18723 | 7.15e-05 | 1.21e-03 | 123 |
| GO:00015582 | Colorectum | MSS | regulation of cell growth | 105/3467 | 414/18723 | 2.97e-04 | 3.90e-03 | 105 |
| GO:00160493 | Colorectum | FAP | cell growth | 112/2622 | 482/18723 | 2.40e-08 | 2.30e-06 | 112 |
| GO:00015583 | Colorectum | FAP | regulation of cell growth | 95/2622 | 414/18723 | 5.02e-07 | 2.61e-05 | 95 |
| GO:00160494 | Colorectum | CRC | cell growth | 95/2078 | 482/18723 | 1.51e-08 | 2.75e-06 | 95 |
| GO:00015584 | Colorectum | CRC | regulation of cell growth | 78/2078 | 414/18723 | 1.84e-06 | 9.11e-05 | 78 |
| GO:00160499 | Endometrium | AEH | cell growth | 93/2100 | 482/18723 | 1.00e-07 | 4.99e-06 | 93 |
| Page: 1 2 3 4 5 |
| Pathway ID | Tissue | Disease Stage | Description | Gene Ratio | Bg Ratio | pvalue | p.adjust | qvalue | Count |
| Page: 1 |
Top |
Cell-cell communication analysis |
| Identification of potential cell-cell interactions between two cell types and their ligand-receptor pairs for different disease states |
| Ligand | Receptor | LRpair | Pathway | Tissue | Disease Stage |
| Page: 1 |
Top |
Single-cell gene regulatory network inference analysis |
| Find out the significant the regulons (TFs) and the target genes of each regulon across cell types for different disease states |
| TF | Cell Type | Tissue | Disease Stage | Target Gene | RSS | Regulon Activity |
| ∗The dot plots of a searched regulon are shown for all cell subpopulations in each disease state of each tissue based on the regulon specific score inferred using pySCENIC and by calculating the average expression. |
| Page: 1 |
Top |
Somatic mutation of malignant transformation related genes |
| Annotation of somatic variants for genes involved in malignant transformation |
| Hugo Symbol | Variant Class | Variant Classification | dbSNP RS | HGVSc | HGVSp | HGVSp Short | SWISSPROT | BIOTYPE | SIFT | PolyPhen | Tumor Sample Barcode | Tissue | Histology | Sex | Age | Stage | Therapy Types | Drugs | Outcome |
| CCDC85B | SNV | Missense_Mutation | novel | c.533N>C | p.Leu178Pro | p.L178P | Q15834 | protein_coding | tolerated(0.26) | possibly_damaging(0.539) | TCGA-43-8115-01 | Lung | lung squamous cell carcinoma | Female | >=65 | I/II | Chemotherapy | carboplatin | SD |
| Page: 1 |
Top |
Related drugs of malignant transformation related genes |
| Identification of chemicals and drugs interact with genes involved in malignant transfromation |
| (DGIdb 4.0) |
| Entrez ID | Symbol | Category | Interaction Types | Drug Claim Name | Drug Name | PMIDs |
| Page: 1 |

Copyright 2023-Present -The University of Texas Health Science Center at Houston |