
|
|||||
|
 | |
| |
| |
| |
| |
| |
|
Gene: CCDC74A |
Gene summary for CCDC74A |
| Gene information | Species | Human | Gene symbol | CCDC74A | Gene ID | 90557 |
| Gene name | coiled-coil domain containing 74A | |
| Gene Alias | CCDC74A | |
| Cytomap | 2q21.1 | |
| Gene Type | protein-coding | GO ID | GO:0003674 | UniProtAcc | F5GZA4 |
Top |
Malignant transformation analysis |
| Identification of the aberrant gene expression in precancerous and cancerous lesions by comparing the gene expression of stem-like cells in diseased tissues with normal stem cells |
| Entrez ID | Symbol | Replicates | Species | Organ | Tissue | Adj P-value | Log2FC | Malignancy |
| 90557 | CCDC74A | GSM4909304 | Human | Breast | IDC | 2.89e-100 | 1.29e+00 | 0.1636 |
| 90557 | CCDC74A | GSM4909306 | Human | Breast | IDC | 4.30e-07 | 2.75e-01 | 0.1564 |
| 90557 | CCDC74A | GSM4909308 | Human | Breast | IDC | 3.90e-03 | 1.69e-01 | 0.158 |
| 90557 | CCDC74A | brca1 | Human | Breast | Precancer | 3.11e-02 | -8.18e-02 | -0.0338 |
| 90557 | CCDC74A | M1 | Human | Breast | IDC | 2.46e-02 | 1.59e-01 | 0.1577 |
| 90557 | CCDC74A | NCCBC11 | Human | Breast | DCIS | 4.45e-17 | 9.90e-01 | 0.1232 |
| 90557 | CCDC74A | NCCBC5 | Human | Breast | DCIS | 4.29e-09 | 4.67e-01 | 0.2046 |
| 90557 | CCDC74A | LZE22T | Human | Esophagus | ESCC | 4.10e-06 | 2.98e-01 | 0.068 |
| 90557 | CCDC74A | P2T-E | Human | Esophagus | ESCC | 1.73e-28 | 5.72e-01 | 0.1177 |
| 90557 | CCDC74A | P4T-E | Human | Esophagus | ESCC | 1.91e-05 | 1.59e-01 | 0.1323 |
| 90557 | CCDC74A | P8T-E | Human | Esophagus | ESCC | 3.35e-02 | 7.04e-02 | 0.0889 |
| 90557 | CCDC74A | P9T-E | Human | Esophagus | ESCC | 4.96e-10 | 2.30e-01 | 0.1131 |
| 90557 | CCDC74A | P12T-E | Human | Esophagus | ESCC | 5.55e-06 | 1.58e-01 | 0.1122 |
| 90557 | CCDC74A | P16T-E | Human | Esophagus | ESCC | 1.03e-19 | 3.25e-01 | 0.1153 |
| 90557 | CCDC74A | P21T-E | Human | Esophagus | ESCC | 1.64e-18 | 4.09e-01 | 0.1617 |
| 90557 | CCDC74A | P22T-E | Human | Esophagus | ESCC | 1.15e-19 | 3.36e-01 | 0.1236 |
| 90557 | CCDC74A | P27T-E | Human | Esophagus | ESCC | 6.53e-04 | 1.66e-01 | 0.1055 |
| 90557 | CCDC74A | P28T-E | Human | Esophagus | ESCC | 4.09e-09 | 1.98e-01 | 0.1149 |
| 90557 | CCDC74A | P31T-E | Human | Esophagus | ESCC | 3.64e-14 | 2.73e-01 | 0.1251 |
| 90557 | CCDC74A | P32T-E | Human | Esophagus | ESCC | 4.10e-03 | 6.05e-02 | 0.1666 |
| Page: 1 2 |
| Tissue | Expression Dynamics | Abbreviation |
| Breast | 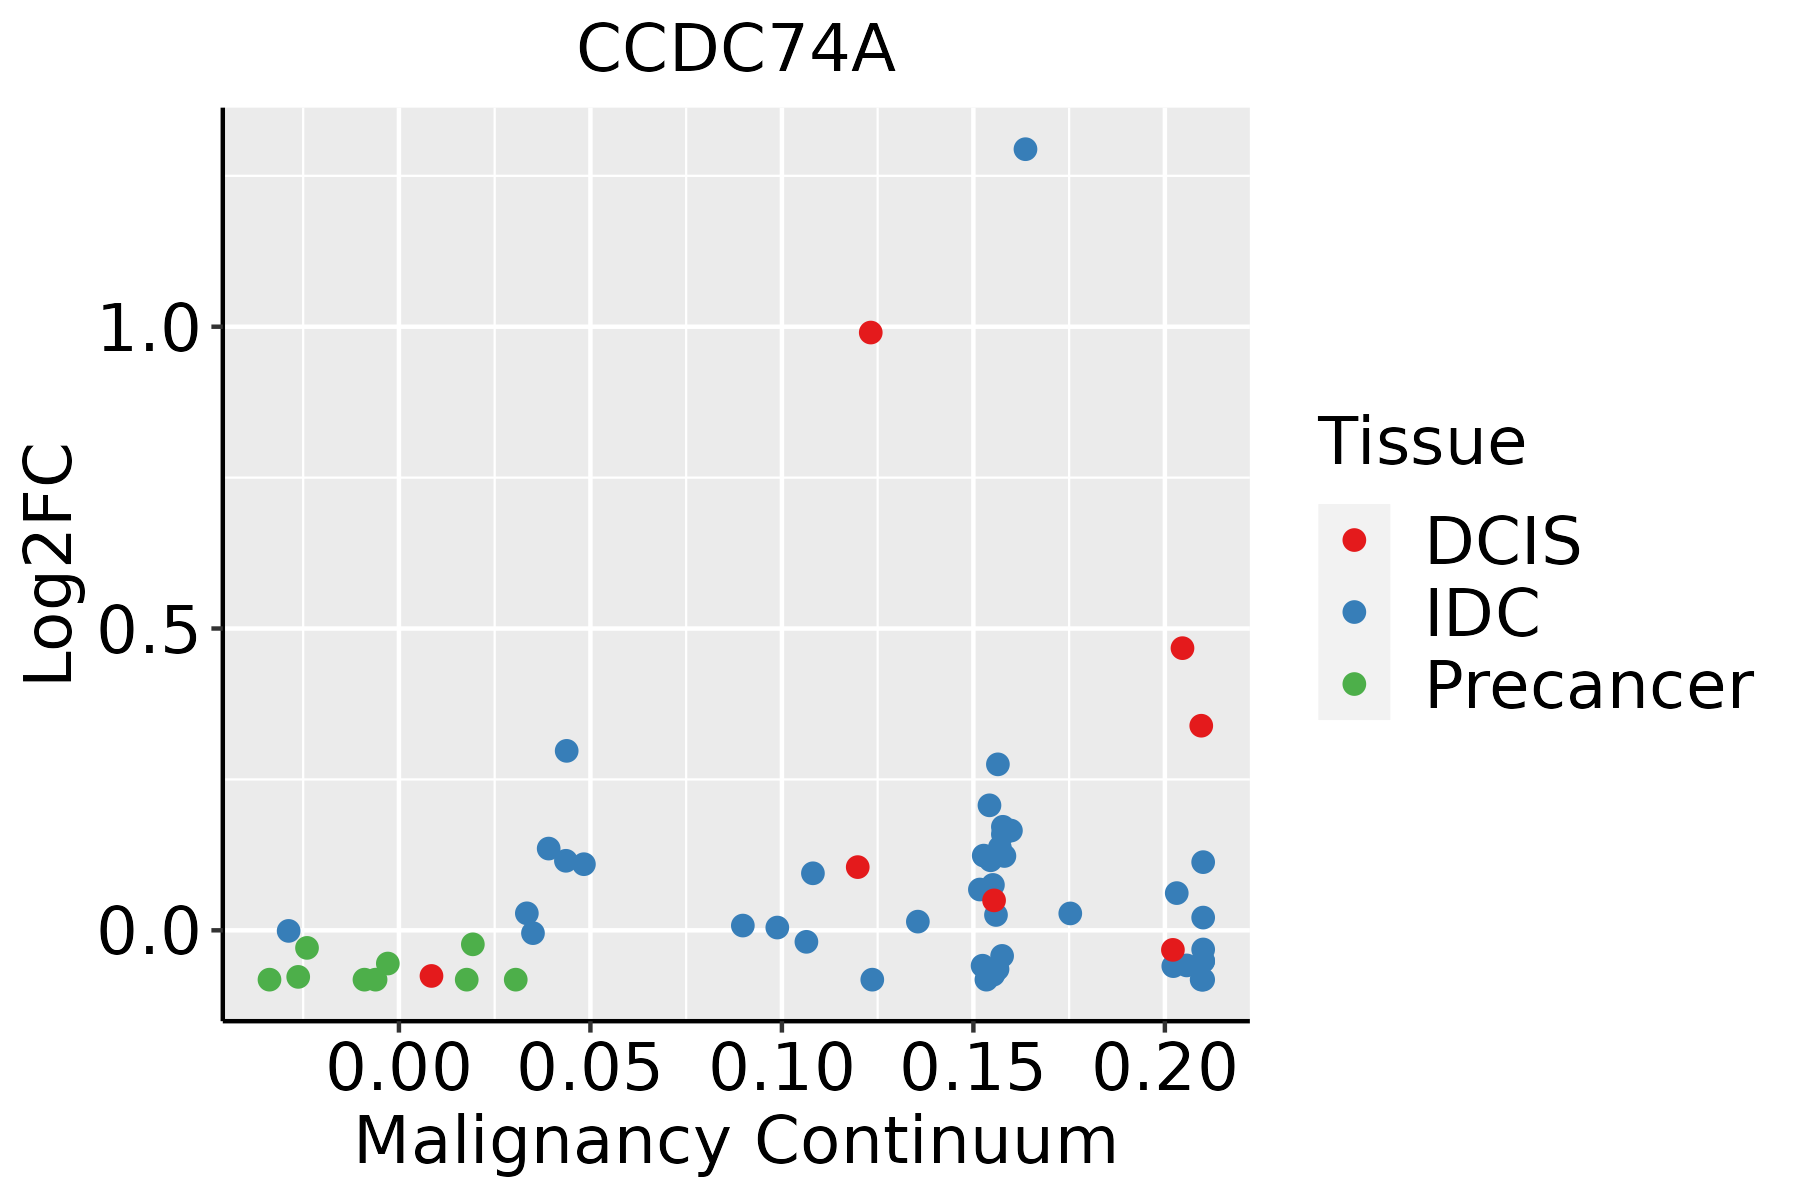 | IDC: Invasive ductal carcinoma |
| DCIS: Ductal carcinoma in situ | ||
| Precancer(BRCA1-mut): Precancerous lesion from BRCA1 mutation carriers | ||
| Esophagus |  | ESCC: Esophageal squamous cell carcinoma |
| HGIN: High-grade intraepithelial neoplasias | ||
| LGIN: Low-grade intraepithelial neoplasias | ||
| Oral Cavity | 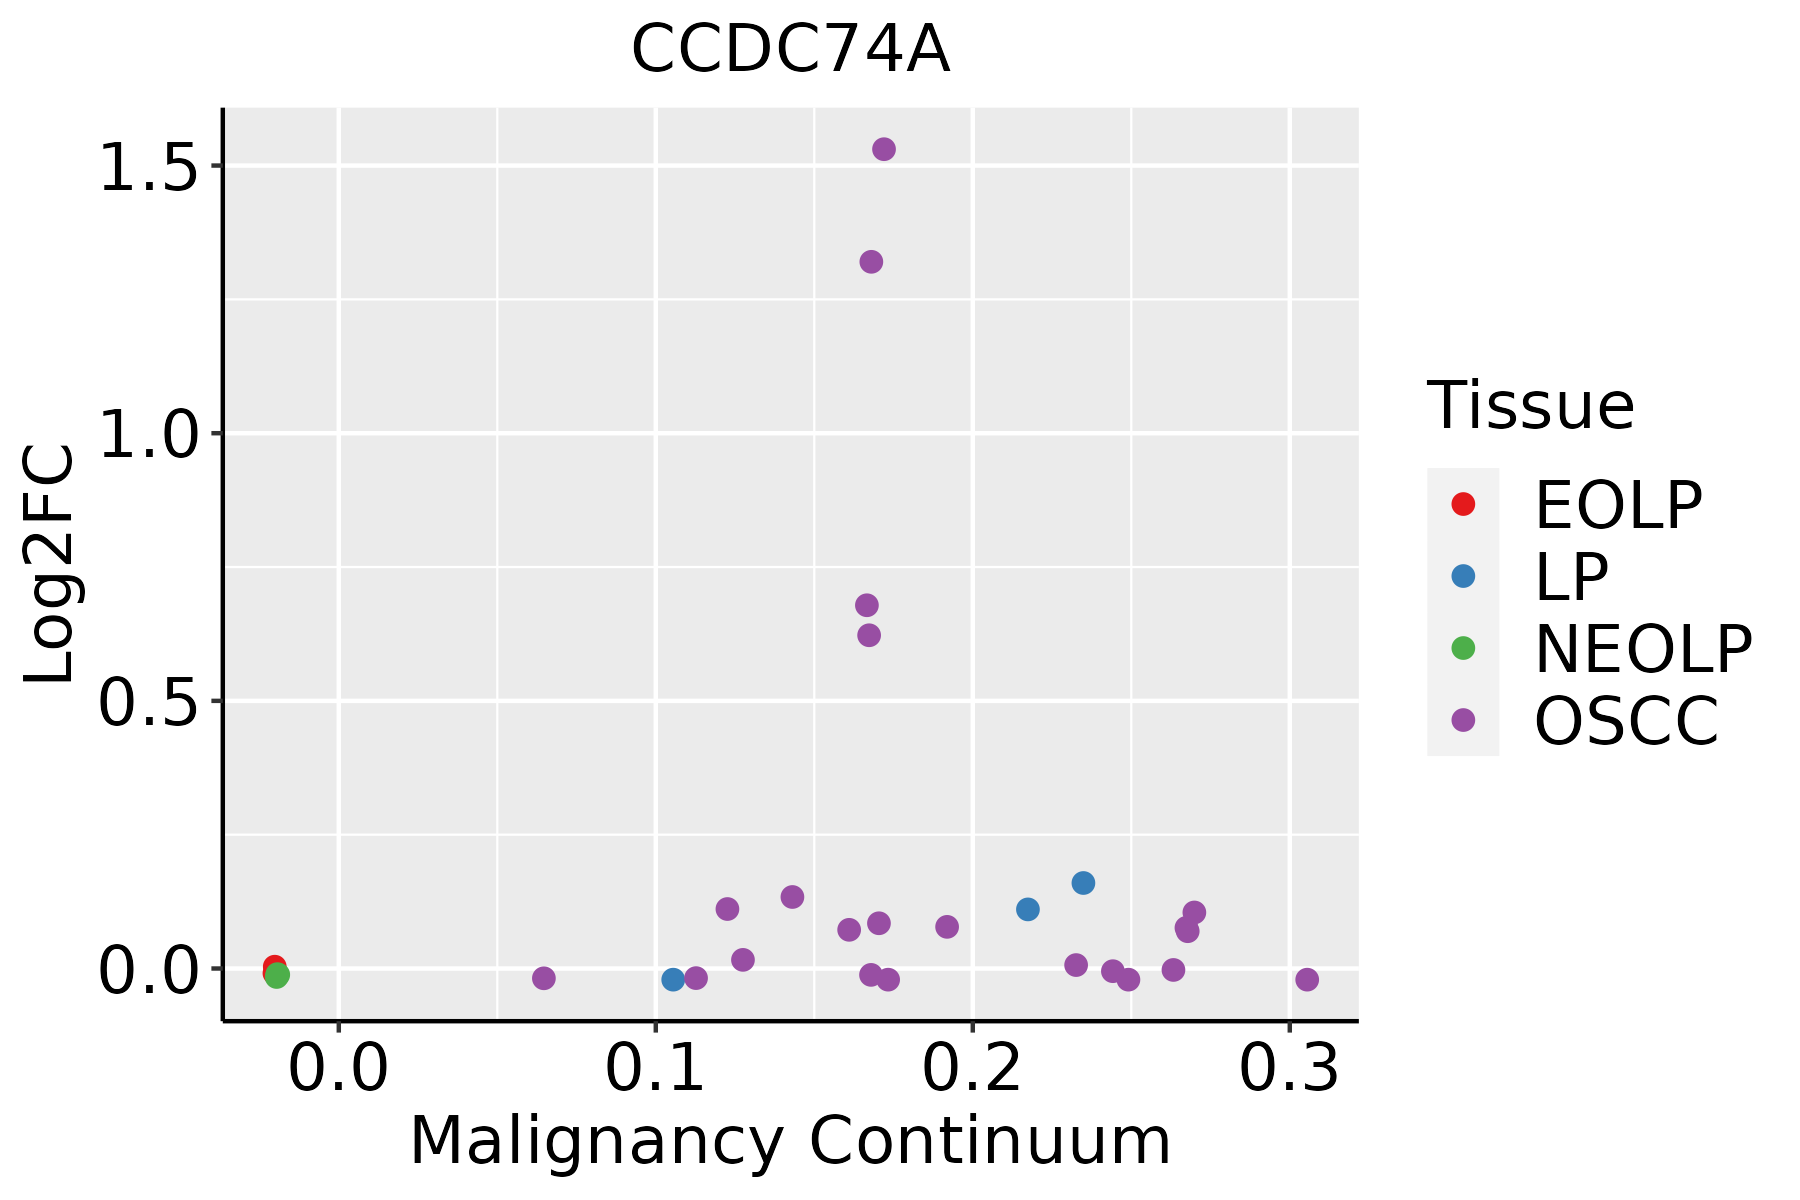 | EOLP: Erosive Oral lichen planus |
| LP: leukoplakia | ||
| NEOLP: Non-erosive oral lichen planus | ||
| OSCC: Oral squamous cell carcinoma |
| ∗log2FC in expression of this searched gene in stem-like cells from each diseased tissue sample relative to stem-like cells in normal samples in each tissue plotted against the malignancy continuum. Samples are colored based on if they are from different disease stage. |
Top |
Malignant transformation related pathway analysis |
| Find out the enriched GO biological processes and KEGG pathways involved in transition from healthy to precancer to cancer |
| Tissue | Disease Stage | Enriched GO biological Processes |
| Colorectum | AD |  |
| Colorectum | SER |  |
| Colorectum | MSS |  |
| Colorectum | MSI-H |  |
| Colorectum | FAP |  |
| ∗Top 15 enriched GO BP terms are showed in the bar plot of each disease state in each tissue. Each row represents a significant GO biological process which is colored according to the -log10(p.adjust). |
| Page: 1 2 3 4 5 6 7 8 9 |
| GO ID | Tissue | Disease Stage | Description | Gene Ratio | Bg Ratio | pvalue | p.adjust | Count |
| Page: 1 |
| Pathway ID | Tissue | Disease Stage | Description | Gene Ratio | Bg Ratio | pvalue | p.adjust | qvalue | Count |
| Page: 1 |
Top |
Cell-cell communication analysis |
| Identification of potential cell-cell interactions between two cell types and their ligand-receptor pairs for different disease states |
| Ligand | Receptor | LRpair | Pathway | Tissue | Disease Stage |
| Page: 1 |
Top |
Single-cell gene regulatory network inference analysis |
| Find out the significant the regulons (TFs) and the target genes of each regulon across cell types for different disease states |
| TF | Cell Type | Tissue | Disease Stage | Target Gene | RSS | Regulon Activity |
| ∗The dot plots of a searched regulon are shown for all cell subpopulations in each disease state of each tissue based on the regulon specific score inferred using pySCENIC and by calculating the average expression. |
| Page: 1 |
Top |
Somatic mutation of malignant transformation related genes |
| Annotation of somatic variants for genes involved in malignant transformation |
| Hugo Symbol | Variant Class | Variant Classification | dbSNP RS | HGVSc | HGVSp | HGVSp Short | SWISSPROT | BIOTYPE | SIFT | PolyPhen | Tumor Sample Barcode | Tissue | Histology | Sex | Age | Stage | Therapy Types | Drugs | Outcome |
| CCDC74A | SNV | Missense_Mutation | c.226G>C | p.Glu76Gln | p.E76Q | Q96AQ1 | protein_coding | deleterious(0.02) | possibly_damaging(0.581) | TCGA-AQ-A54N-01 | Breast | breast invasive carcinoma | Female | <65 | I/II | Unknown | Unknown | SD | |
| CCDC74A | SNV | Missense_Mutation | novel | c.791T>C | p.Leu264Pro | p.L264P | Q96AQ1 | protein_coding | tolerated(0.39) | benign(0) | TCGA-E2-A1B0-01 | Breast | breast invasive carcinoma | Female | <65 | III/IV | Chemotherapy | cytoxan | SD |
| CCDC74A | SNV | Missense_Mutation | c.347N>A | p.Arg116His | p.R116H | Q96AQ1 | protein_coding | tolerated(0.1) | possibly_damaging(0.655) | TCGA-EA-A410-01 | Cervix | cervical & endocervical cancer | Female | <65 | I/II | Unknown | Unknown | SD | |
| CCDC74A | SNV | Missense_Mutation | c.536N>G | p.Ser179Cys | p.S179C | Q96AQ1 | protein_coding | deleterious(0.03) | probably_damaging(0.937) | TCGA-EK-A2PM-01 | Cervix | cervical & endocervical cancer | Female | >=65 | I/II | Unknown | Unknown | SD | |
| CCDC74A | SNV | Missense_Mutation | novel | c.990G>C | p.Lys330Asn | p.K330N | Q96AQ1 | protein_coding | deleterious(0) | probably_damaging(0.978) | TCGA-VS-A8QA-01 | Cervix | cervical & endocervical cancer | Female | <65 | I/II | Unknown | Unknown | SD |
| CCDC74A | SNV | Missense_Mutation | c.862N>A | p.Leu288Met | p.L288M | Q96AQ1 | protein_coding | tolerated(0.11) | probably_damaging(0.986) | TCGA-AA-3672-01 | Colorectum | colon adenocarcinoma | Female | >=65 | III/IV | Unknown | Unknown | SD | |
| CCDC74A | SNV | Missense_Mutation | novel | c.614N>G | p.Asp205Gly | p.D205G | Q96AQ1 | protein_coding | tolerated(0.1) | probably_damaging(0.915) | TCGA-D5-6540-01 | Colorectum | colon adenocarcinoma | Male | >=65 | I/II | Unknown | Unknown | SD |
| CCDC74A | SNV | Missense_Mutation | rs374861718 | c.617N>C | p.Leu206Pro | p.L206P | Q96AQ1 | protein_coding | deleterious(0.02) | probably_damaging(0.997) | TCGA-G4-6588-01 | Colorectum | colon adenocarcinoma | Female | <65 | I/II | Unknown | Unknown | SD |
| CCDC74A | SNV | Missense_Mutation | rs192139598 | c.598G>A | p.Val200Ile | p.V200I | Q96AQ1 | protein_coding | tolerated(0.2) | possibly_damaging(0.548) | TCGA-AF-A56L-01 | Colorectum | rectum adenocarcinoma | Female | <65 | III/IV | Chemotherapy | oxaliplatin | CR |
| CCDC74A | SNV | Missense_Mutation | rs532077892 | c.343N>A | p.Ala115Thr | p.A115T | Q96AQ1 | protein_coding | tolerated(1) | benign(0) | TCGA-A5-A0G1-01 | Endometrium | uterine corpus endometrioid carcinoma | Female | >=65 | I/II | Unknown | Unknown | SD |
| Page: 1 2 3 4 5 |
Top |
Related drugs of malignant transformation related genes |
| Identification of chemicals and drugs interact with genes involved in malignant transfromation |
| (DGIdb 4.0) |
| Entrez ID | Symbol | Category | Interaction Types | Drug Claim Name | Drug Name | PMIDs |
| Page: 1 |

Copyright 2023-Present -The University of Texas Health Science Center at Houston |