
|
|||||
|
 | |
| |
| |
| |
| |
| |
|
Gene: CCDC71L |
Gene summary for CCDC71L |
| Gene information | Species | Human | Gene symbol | CCDC71L | Gene ID | 168455 |
| Gene name | coiled-coil domain containing 71 like | |
| Gene Alias | C7orf74 | |
| Cytomap | 7q22.3 | |
| Gene Type | protein-coding | GO ID | GO:0006629 | UniProtAcc | Q8N9Z2 |
Top |
Malignant transformation analysis |
| Identification of the aberrant gene expression in precancerous and cancerous lesions by comparing the gene expression of stem-like cells in diseased tissues with normal stem cells |
| Entrez ID | Symbol | Replicates | Species | Organ | Tissue | Adj P-value | Log2FC | Malignancy |
| 168455 | CCDC71L | HCC1_Meng | Human | Liver | HCC | 2.89e-51 | 5.75e-02 | 0.0246 |
| 168455 | CCDC71L | HCC2_Meng | Human | Liver | HCC | 4.14e-24 | 1.70e-01 | 0.0107 |
| 168455 | CCDC71L | S027 | Human | Liver | HCC | 2.98e-16 | 1.74e+00 | 0.2446 |
| 168455 | CCDC71L | S028 | Human | Liver | HCC | 7.08e-32 | 2.07e+00 | 0.2503 |
| 168455 | CCDC71L | S029 | Human | Liver | HCC | 2.06e-31 | 1.99e+00 | 0.2581 |
| 168455 | CCDC71L | C04 | Human | Oral cavity | OSCC | 5.60e-06 | 5.56e-01 | 0.2633 |
| 168455 | CCDC71L | C21 | Human | Oral cavity | OSCC | 7.11e-25 | 1.06e+00 | 0.2678 |
| 168455 | CCDC71L | C30 | Human | Oral cavity | OSCC | 1.49e-14 | 8.27e-01 | 0.3055 |
| 168455 | CCDC71L | C08 | Human | Oral cavity | OSCC | 1.14e-37 | 9.19e-01 | 0.1919 |
| 168455 | CCDC71L | C09 | Human | Oral cavity | OSCC | 5.39e-07 | 3.00e-01 | 0.1431 |
| 168455 | CCDC71L | EOLP-2 | Human | Oral cavity | EOLP | 9.74e-08 | 2.73e-01 | -0.0203 |
| 168455 | CCDC71L | NEOLP-1 | Human | Oral cavity | NEOLP | 4.90e-05 | 2.65e-01 | -0.0194 |
| 168455 | CCDC71L | NEOLP-2 | Human | Oral cavity | NEOLP | 1.14e-02 | 1.44e-01 | -0.0196 |
| 168455 | CCDC71L | NEOLP-3 | Human | Oral cavity | NEOLP | 2.35e-06 | 1.84e-01 | -0.0191 |
| 168455 | CCDC71L | SYSMH2 | Human | Oral cavity | OSCC | 5.70e-08 | 3.25e-01 | 0.2326 |
| 168455 | CCDC71L | SYSMH3 | Human | Oral cavity | OSCC | 1.12e-09 | 2.63e-01 | 0.2442 |
| 168455 | CCDC71L | SYSMH5 | Human | Oral cavity | OSCC | 1.54e-04 | 1.25e-01 | 0.0647 |
| 168455 | CCDC71L | SYSMH6 | Human | Oral cavity | OSCC | 8.38e-11 | 2.39e-01 | 0.1275 |
| 168455 | CCDC71L | GSM5252132_BPH389PrGF | Human | Prostate | BPH | 1.92e-03 | 1.20e+00 | -0.2247 |
| 168455 | CCDC71L | GSM5252136_BPH556PrGA1_Fcol | Human | Prostate | BPH | 4.54e-03 | 4.99e-01 | -0.23 |
| Page: 1 2 |
| Tissue | Expression Dynamics | Abbreviation |
| Liver | 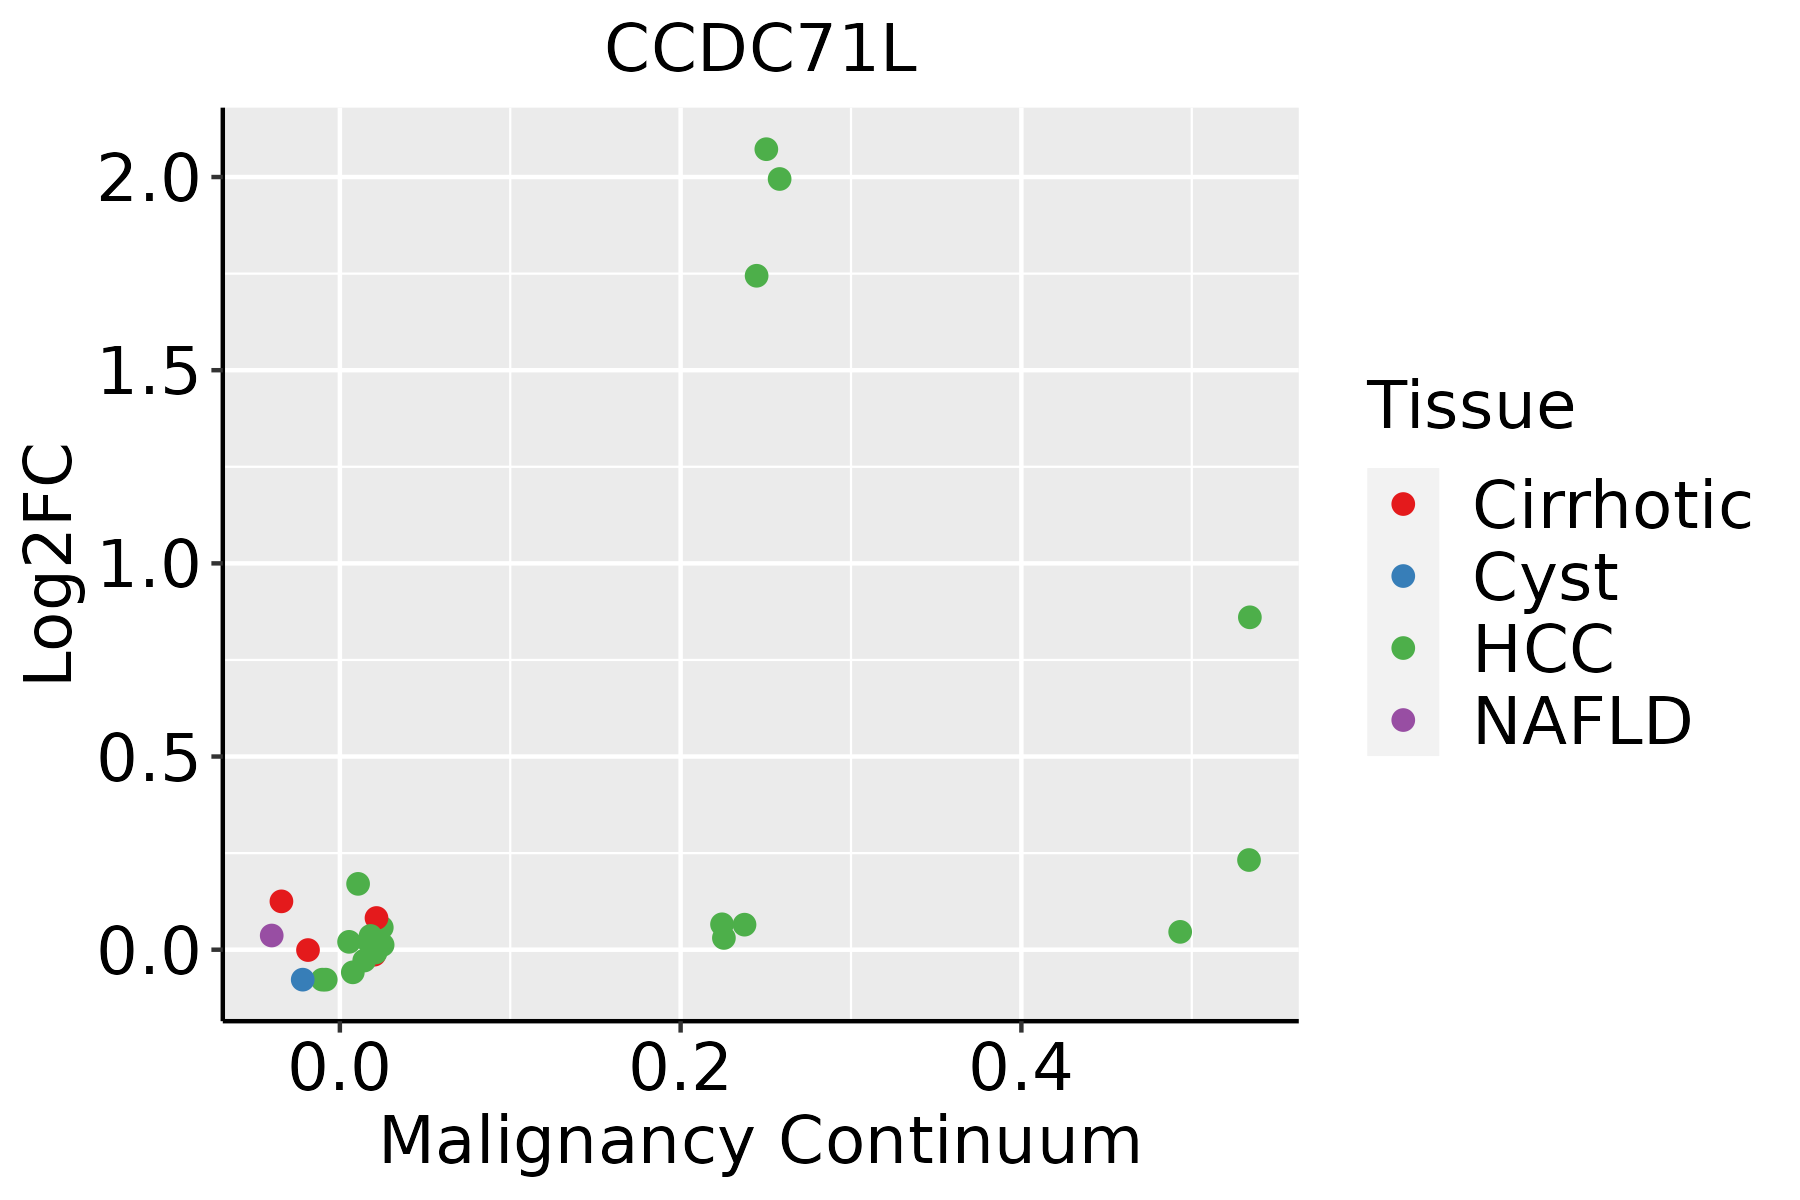 | HCC: Hepatocellular carcinoma |
| NAFLD: Non-alcoholic fatty liver disease | ||
| Oral Cavity |  | EOLP: Erosive Oral lichen planus |
| LP: leukoplakia | ||
| NEOLP: Non-erosive oral lichen planus | ||
| OSCC: Oral squamous cell carcinoma | ||
| Prostate |  | BPH: Benign Prostatic Hyperplasia |
| Thyroid |  | ATC: Anaplastic thyroid cancer |
| HT: Hashimoto's thyroiditis | ||
| PTC: Papillary thyroid cancer |
| ∗log2FC in expression of this searched gene in stem-like cells from each diseased tissue sample relative to stem-like cells in normal samples in each tissue plotted against the malignancy continuum. Samples are colored based on if they are from different disease stage. |
Top |
Malignant transformation related pathway analysis |
| Find out the enriched GO biological processes and KEGG pathways involved in transition from healthy to precancer to cancer |
| Tissue | Disease Stage | Enriched GO biological Processes |
| Colorectum | AD |  |
| Colorectum | SER |  |
| Colorectum | MSS |  |
| Colorectum | MSI-H |  |
| Colorectum | FAP |  |
| ∗Top 15 enriched GO BP terms are showed in the bar plot of each disease state in each tissue. Each row represents a significant GO biological process which is colored according to the -log10(p.adjust). |
| Page: 1 2 3 4 5 6 7 8 9 |
| GO ID | Tissue | Disease Stage | Description | Gene Ratio | Bg Ratio | pvalue | p.adjust | Count |
| GO:00454441 | Liver | HCC | fat cell differentiation | 120/7958 | 229/18723 | 1.52e-03 | 8.05e-03 | 120 |
| GO:00454448 | Oral cavity | OSCC | fat cell differentiation | 120/7305 | 229/18723 | 2.48e-05 | 2.32e-04 | 120 |
| GO:00455983 | Oral cavity | OSCC | regulation of fat cell differentiation | 77/7305 | 139/18723 | 6.36e-05 | 5.18e-04 | 77 |
| GO:00456006 | Oral cavity | OSCC | positive regulation of fat cell differentiation | 41/7305 | 66/18723 | 1.20e-04 | 8.60e-04 | 41 |
| GO:004560013 | Oral cavity | EOLP | positive regulation of fat cell differentiation | 17/2218 | 66/18723 | 1.41e-03 | 9.58e-03 | 17 |
| GO:004544415 | Oral cavity | EOLP | fat cell differentiation | 42/2218 | 229/18723 | 2.58e-03 | 1.56e-02 | 42 |
| GO:004559812 | Oral cavity | EOLP | regulation of fat cell differentiation | 28/2218 | 139/18723 | 3.29e-03 | 1.90e-02 | 28 |
| GO:004560022 | Oral cavity | NEOLP | positive regulation of fat cell differentiation | 24/2005 | 66/18723 | 3.20e-08 | 1.35e-06 | 24 |
| GO:004559821 | Oral cavity | NEOLP | regulation of fat cell differentiation | 37/2005 | 139/18723 | 1.12e-07 | 4.05e-06 | 37 |
| GO:004544422 | Oral cavity | NEOLP | fat cell differentiation | 50/2005 | 229/18723 | 6.79e-07 | 1.93e-05 | 50 |
| GO:00454447 | Prostate | BPH | fat cell differentiation | 59/3107 | 229/18723 | 2.60e-04 | 2.04e-03 | 59 |
| GO:00455982 | Prostate | BPH | regulation of fat cell differentiation | 36/3107 | 139/18723 | 3.43e-03 | 1.76e-02 | 36 |
| GO:00456005 | Prostate | BPH | positive regulation of fat cell differentiation | 20/3107 | 66/18723 | 4.09e-03 | 2.03e-02 | 20 |
| GO:004544414 | Prostate | Tumor | fat cell differentiation | 69/3246 | 229/18723 | 1.22e-06 | 2.28e-05 | 69 |
| GO:004559811 | Prostate | Tumor | regulation of fat cell differentiation | 39/3246 | 139/18723 | 1.11e-03 | 7.12e-03 | 39 |
| GO:004560012 | Prostate | Tumor | positive regulation of fat cell differentiation | 22/3246 | 66/18723 | 1.21e-03 | 7.66e-03 | 22 |
| GO:004544418 | Thyroid | PTC | fat cell differentiation | 102/5968 | 229/18723 | 3.66e-05 | 3.40e-04 | 102 |
| GO:004560015 | Thyroid | PTC | positive regulation of fat cell differentiation | 33/5968 | 66/18723 | 1.63e-03 | 9.01e-03 | 33 |
| GO:004559814 | Thyroid | PTC | regulation of fat cell differentiation | 59/5968 | 139/18723 | 5.50e-03 | 2.50e-02 | 59 |
| GO:004544423 | Thyroid | ATC | fat cell differentiation | 105/6293 | 229/18723 | 7.42e-05 | 5.62e-04 | 105 |
| Page: 1 2 |
| Pathway ID | Tissue | Disease Stage | Description | Gene Ratio | Bg Ratio | pvalue | p.adjust | qvalue | Count |
| Page: 1 |
Top |
Cell-cell communication analysis |
| Identification of potential cell-cell interactions between two cell types and their ligand-receptor pairs for different disease states |
| Ligand | Receptor | LRpair | Pathway | Tissue | Disease Stage |
| Page: 1 |
Top |
Single-cell gene regulatory network inference analysis |
| Find out the significant the regulons (TFs) and the target genes of each regulon across cell types for different disease states |
| TF | Cell Type | Tissue | Disease Stage | Target Gene | RSS | Regulon Activity |
| ∗The dot plots of a searched regulon are shown for all cell subpopulations in each disease state of each tissue based on the regulon specific score inferred using pySCENIC and by calculating the average expression. |
| Page: 1 |
Top |
Somatic mutation of malignant transformation related genes |
| Annotation of somatic variants for genes involved in malignant transformation |
| Hugo Symbol | Variant Class | Variant Classification | dbSNP RS | HGVSc | HGVSp | HGVSp Short | SWISSPROT | BIOTYPE | SIFT | PolyPhen | Tumor Sample Barcode | Tissue | Histology | Sex | Age | Stage | Therapy Types | Drugs | Outcome |
| CCDC71L | SNV | Missense_Mutation | novel | c.264C>A | p.Phe88Leu | p.F88L | Q8N9Z2 | protein_coding | tolerated(0.07) | benign(0.053) | TCGA-A5-A2K5-01 | Endometrium | uterine corpus endometrioid carcinoma | Female | >=65 | I/II | Unknown | Unknown | SD |
| CCDC71L | SNV | Missense_Mutation | c.190A>G | p.Met64Val | p.M64V | Q8N9Z2 | protein_coding | tolerated(1) | benign(0.019) | TCGA-BG-A0MQ-01 | Endometrium | uterine corpus endometrioid carcinoma | Female | >=65 | I/II | Unknown | Unknown | SD |
| Page: 1 |
Top |
Related drugs of malignant transformation related genes |
| Identification of chemicals and drugs interact with genes involved in malignant transfromation |
| (DGIdb 4.0) |
| Entrez ID | Symbol | Category | Interaction Types | Drug Claim Name | Drug Name | PMIDs |
| Page: 1 |

Copyright 2023-Present -The University of Texas Health Science Center at Houston |