
|
|||||
|
 | |
| |
| |
| |
| |
| |
|
Gene: CCDC71 |
Gene summary for CCDC71 |
| Gene information | Species | Human | Gene symbol | CCDC71 | Gene ID | 64925 |
| Gene name | coiled-coil domain containing 71 | |
| Gene Alias | CCDC71 | |
| Cytomap | 3p21.31 | |
| Gene Type | protein-coding | GO ID | NA | UniProtAcc | Q8IV32 |
Top |
Malignant transformation analysis |
| Identification of the aberrant gene expression in precancerous and cancerous lesions by comparing the gene expression of stem-like cells in diseased tissues with normal stem cells |
| Entrez ID | Symbol | Replicates | Species | Organ | Tissue | Adj P-value | Log2FC | Malignancy |
| 64925 | CCDC71 | LZE4T | Human | Esophagus | ESCC | 5.01e-04 | 1.23e-01 | 0.0811 |
| 64925 | CCDC71 | LZE24T | Human | Esophagus | ESCC | 3.11e-08 | 2.13e-01 | 0.0596 |
| 64925 | CCDC71 | P2T-E | Human | Esophagus | ESCC | 4.44e-08 | 1.79e-01 | 0.1177 |
| 64925 | CCDC71 | P4T-E | Human | Esophagus | ESCC | 5.47e-11 | 2.97e-01 | 0.1323 |
| 64925 | CCDC71 | P5T-E | Human | Esophagus | ESCC | 4.92e-07 | 1.18e-01 | 0.1327 |
| 64925 | CCDC71 | P8T-E | Human | Esophagus | ESCC | 1.84e-10 | 8.02e-02 | 0.0889 |
| 64925 | CCDC71 | P9T-E | Human | Esophagus | ESCC | 1.60e-10 | 2.21e-01 | 0.1131 |
| 64925 | CCDC71 | P10T-E | Human | Esophagus | ESCC | 1.34e-17 | 1.91e-01 | 0.116 |
| 64925 | CCDC71 | P12T-E | Human | Esophagus | ESCC | 1.63e-18 | 1.65e-01 | 0.1122 |
| 64925 | CCDC71 | P15T-E | Human | Esophagus | ESCC | 8.56e-08 | 2.12e-01 | 0.1149 |
| 64925 | CCDC71 | P16T-E | Human | Esophagus | ESCC | 3.77e-19 | 3.03e-01 | 0.1153 |
| 64925 | CCDC71 | P20T-E | Human | Esophagus | ESCC | 4.04e-08 | 2.07e-01 | 0.1124 |
| 64925 | CCDC71 | P21T-E | Human | Esophagus | ESCC | 7.93e-23 | 3.46e-01 | 0.1617 |
| 64925 | CCDC71 | P22T-E | Human | Esophagus | ESCC | 1.42e-07 | 1.34e-01 | 0.1236 |
| 64925 | CCDC71 | P23T-E | Human | Esophagus | ESCC | 6.94e-12 | 3.11e-01 | 0.108 |
| 64925 | CCDC71 | P24T-E | Human | Esophagus | ESCC | 3.01e-16 | 2.63e-01 | 0.1287 |
| 64925 | CCDC71 | P26T-E | Human | Esophagus | ESCC | 1.98e-20 | 1.91e-01 | 0.1276 |
| 64925 | CCDC71 | P27T-E | Human | Esophagus | ESCC | 3.58e-15 | 1.53e-01 | 0.1055 |
| 64925 | CCDC71 | P28T-E | Human | Esophagus | ESCC | 5.09e-07 | 6.08e-02 | 0.1149 |
| 64925 | CCDC71 | P30T-E | Human | Esophagus | ESCC | 4.62e-04 | 2.36e-01 | 0.137 |
| Page: 1 2 3 |
| Tissue | Expression Dynamics | Abbreviation |
| Esophagus | 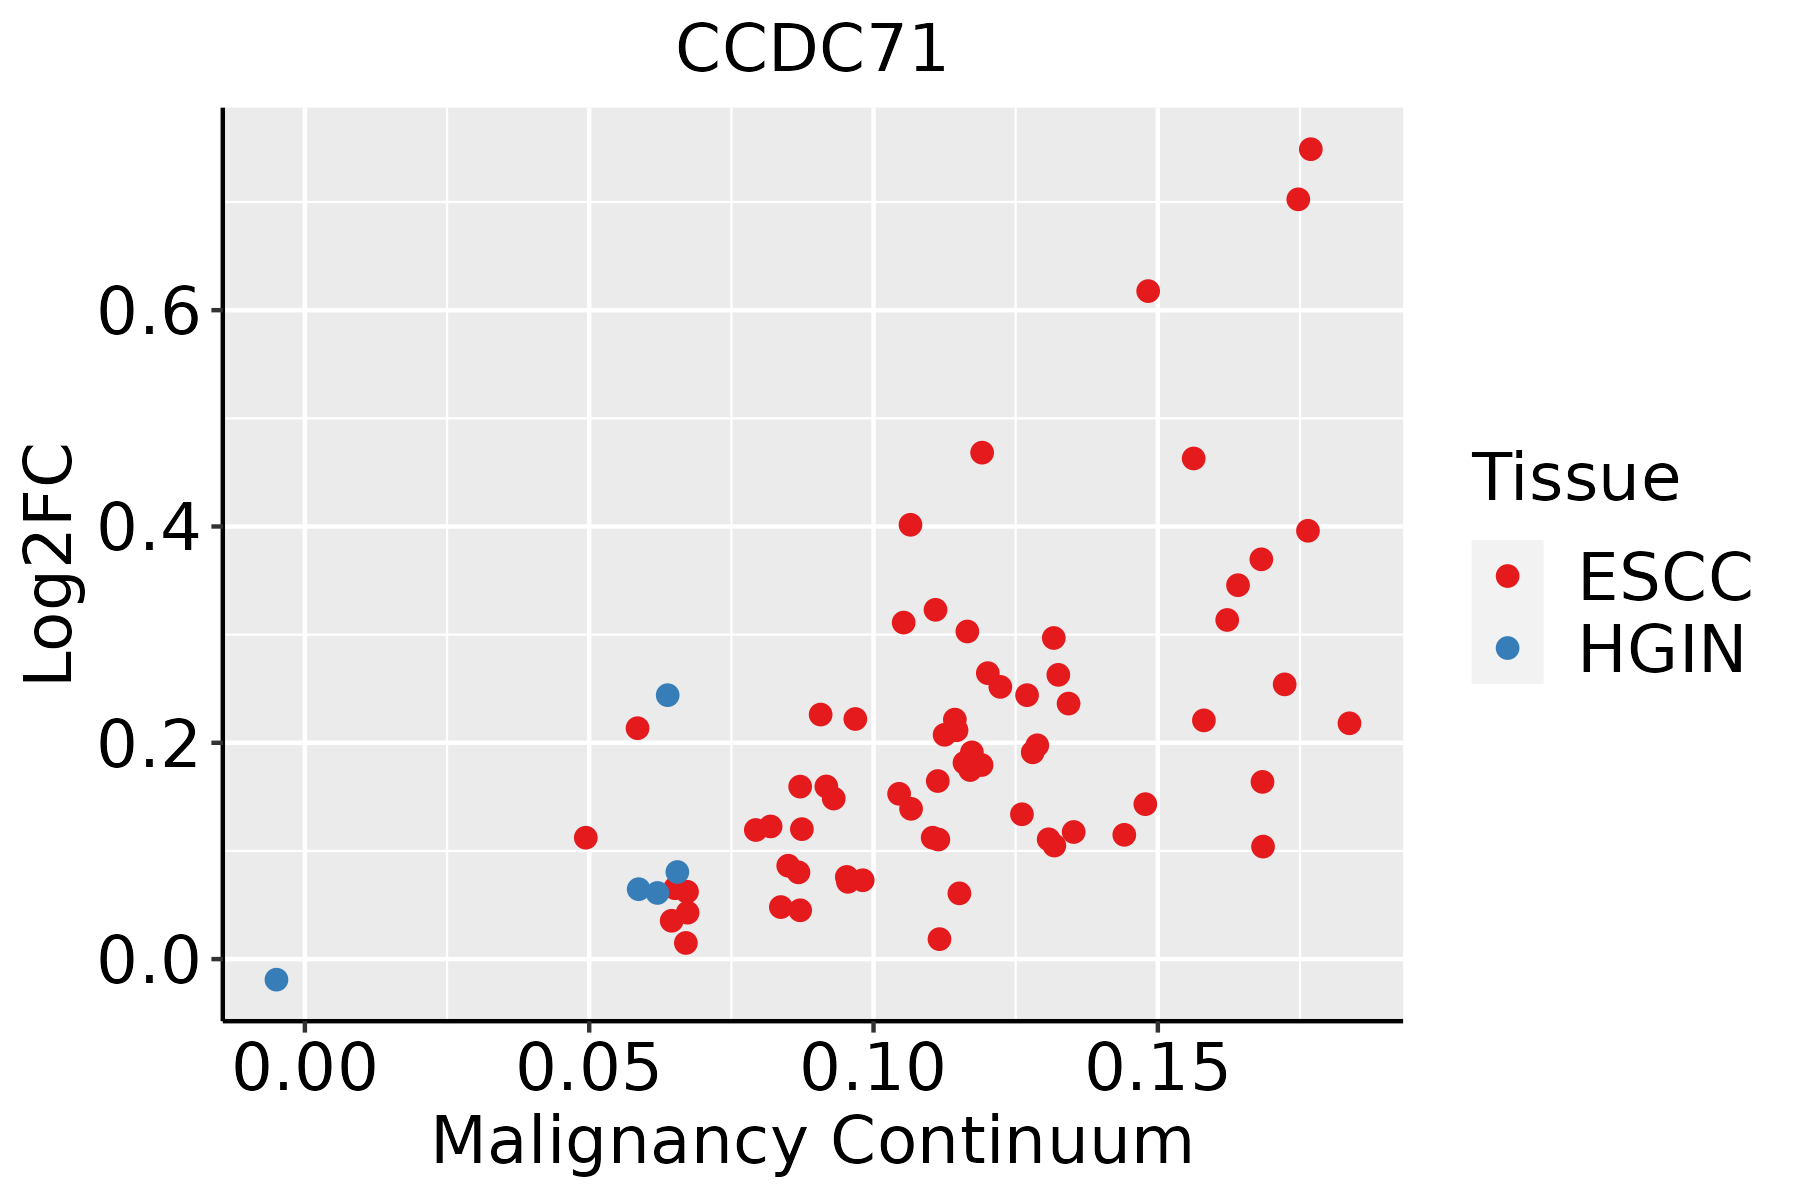 | ESCC: Esophageal squamous cell carcinoma |
| HGIN: High-grade intraepithelial neoplasias | ||
| LGIN: Low-grade intraepithelial neoplasias | ||
| Liver | 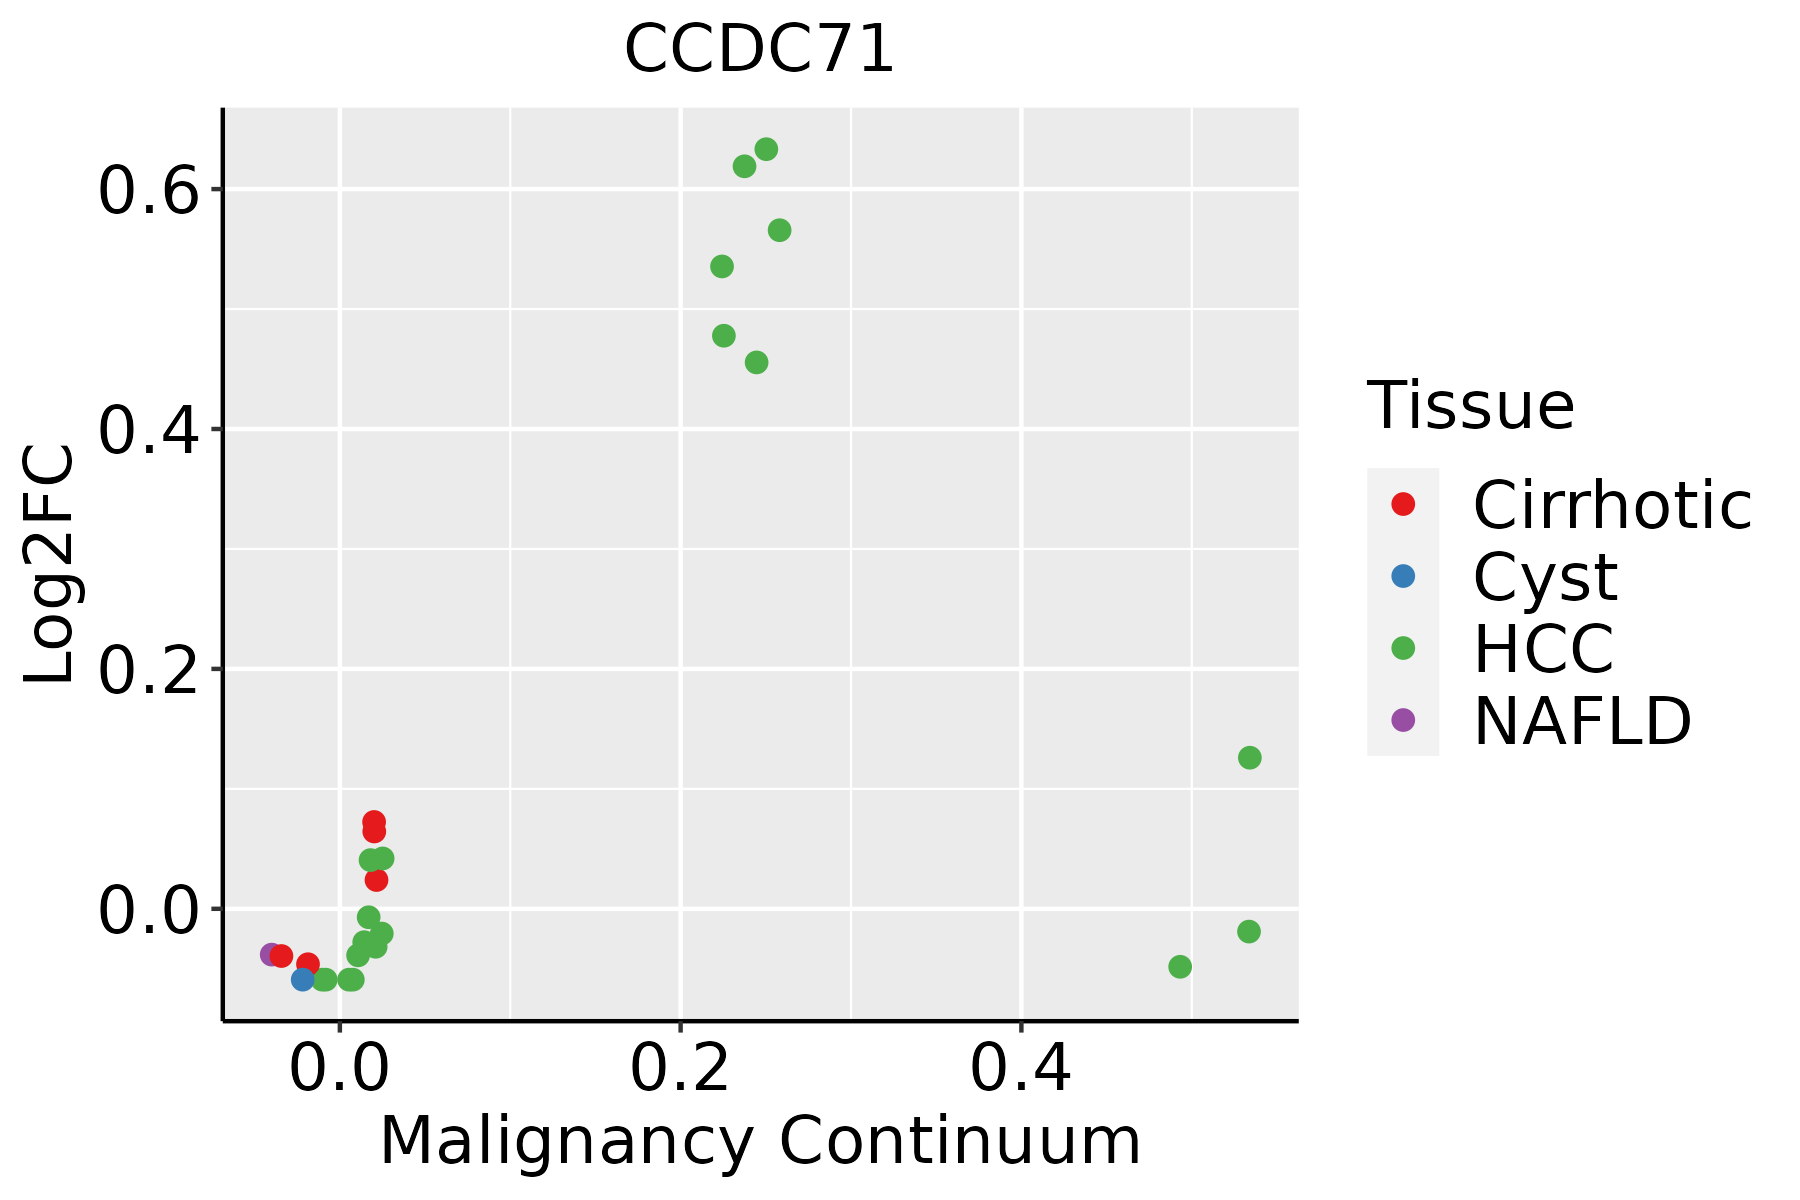 | HCC: Hepatocellular carcinoma |
| NAFLD: Non-alcoholic fatty liver disease |
| ∗log2FC in expression of this searched gene in stem-like cells from each diseased tissue sample relative to stem-like cells in normal samples in each tissue plotted against the malignancy continuum. Samples are colored based on if they are from different disease stage. |
Top |
Malignant transformation related pathway analysis |
| Find out the enriched GO biological processes and KEGG pathways involved in transition from healthy to precancer to cancer |
| Tissue | Disease Stage | Enriched GO biological Processes |
| Colorectum | AD |  |
| Colorectum | SER |  |
| Colorectum | MSS |  |
| Colorectum | MSI-H |  |
| Colorectum | FAP |  |
| ∗Top 15 enriched GO BP terms are showed in the bar plot of each disease state in each tissue. Each row represents a significant GO biological process which is colored according to the -log10(p.adjust). |
| Page: 1 2 3 4 5 6 7 8 9 |
| GO ID | Tissue | Disease Stage | Description | Gene Ratio | Bg Ratio | pvalue | p.adjust | Count |
| GO:00454441 | Liver | HCC | fat cell differentiation | 120/7958 | 229/18723 | 1.52e-03 | 8.05e-03 | 120 |
| GO:00454448 | Oral cavity | OSCC | fat cell differentiation | 120/7305 | 229/18723 | 2.48e-05 | 2.32e-04 | 120 |
| GO:00455983 | Oral cavity | OSCC | regulation of fat cell differentiation | 77/7305 | 139/18723 | 6.36e-05 | 5.18e-04 | 77 |
| GO:00456006 | Oral cavity | OSCC | positive regulation of fat cell differentiation | 41/7305 | 66/18723 | 1.20e-04 | 8.60e-04 | 41 |
| GO:004560013 | Oral cavity | EOLP | positive regulation of fat cell differentiation | 17/2218 | 66/18723 | 1.41e-03 | 9.58e-03 | 17 |
| GO:004544415 | Oral cavity | EOLP | fat cell differentiation | 42/2218 | 229/18723 | 2.58e-03 | 1.56e-02 | 42 |
| GO:004559812 | Oral cavity | EOLP | regulation of fat cell differentiation | 28/2218 | 139/18723 | 3.29e-03 | 1.90e-02 | 28 |
| GO:004560022 | Oral cavity | NEOLP | positive regulation of fat cell differentiation | 24/2005 | 66/18723 | 3.20e-08 | 1.35e-06 | 24 |
| GO:004559821 | Oral cavity | NEOLP | regulation of fat cell differentiation | 37/2005 | 139/18723 | 1.12e-07 | 4.05e-06 | 37 |
| GO:004544422 | Oral cavity | NEOLP | fat cell differentiation | 50/2005 | 229/18723 | 6.79e-07 | 1.93e-05 | 50 |
| GO:00454447 | Prostate | BPH | fat cell differentiation | 59/3107 | 229/18723 | 2.60e-04 | 2.04e-03 | 59 |
| GO:00455982 | Prostate | BPH | regulation of fat cell differentiation | 36/3107 | 139/18723 | 3.43e-03 | 1.76e-02 | 36 |
| GO:00456005 | Prostate | BPH | positive regulation of fat cell differentiation | 20/3107 | 66/18723 | 4.09e-03 | 2.03e-02 | 20 |
| GO:004544414 | Prostate | Tumor | fat cell differentiation | 69/3246 | 229/18723 | 1.22e-06 | 2.28e-05 | 69 |
| GO:004559811 | Prostate | Tumor | regulation of fat cell differentiation | 39/3246 | 139/18723 | 1.11e-03 | 7.12e-03 | 39 |
| GO:004560012 | Prostate | Tumor | positive regulation of fat cell differentiation | 22/3246 | 66/18723 | 1.21e-03 | 7.66e-03 | 22 |
| GO:004544418 | Thyroid | PTC | fat cell differentiation | 102/5968 | 229/18723 | 3.66e-05 | 3.40e-04 | 102 |
| GO:004560015 | Thyroid | PTC | positive regulation of fat cell differentiation | 33/5968 | 66/18723 | 1.63e-03 | 9.01e-03 | 33 |
| GO:004559814 | Thyroid | PTC | regulation of fat cell differentiation | 59/5968 | 139/18723 | 5.50e-03 | 2.50e-02 | 59 |
| GO:004544423 | Thyroid | ATC | fat cell differentiation | 105/6293 | 229/18723 | 7.42e-05 | 5.62e-04 | 105 |
| Page: 1 2 |
| Pathway ID | Tissue | Disease Stage | Description | Gene Ratio | Bg Ratio | pvalue | p.adjust | qvalue | Count |
| Page: 1 |
Top |
Cell-cell communication analysis |
| Identification of potential cell-cell interactions between two cell types and their ligand-receptor pairs for different disease states |
| Ligand | Receptor | LRpair | Pathway | Tissue | Disease Stage |
| Page: 1 |
Top |
Single-cell gene regulatory network inference analysis |
| Find out the significant the regulons (TFs) and the target genes of each regulon across cell types for different disease states |
| TF | Cell Type | Tissue | Disease Stage | Target Gene | RSS | Regulon Activity |
| ∗The dot plots of a searched regulon are shown for all cell subpopulations in each disease state of each tissue based on the regulon specific score inferred using pySCENIC and by calculating the average expression. |
| Page: 1 |
Top |
Somatic mutation of malignant transformation related genes |
| Annotation of somatic variants for genes involved in malignant transformation |
| Hugo Symbol | Variant Class | Variant Classification | dbSNP RS | HGVSc | HGVSp | HGVSp Short | SWISSPROT | BIOTYPE | SIFT | PolyPhen | Tumor Sample Barcode | Tissue | Histology | Sex | Age | Stage | Therapy Types | Drugs | Outcome |
| CCDC71 | SNV | Missense_Mutation | c.1082N>A | p.Arg361Lys | p.R361K | Q8IV32 | protein_coding | tolerated_low_confidence(0.56) | benign(0.001) | TCGA-D8-A1JK-01 | Breast | breast invasive carcinoma | Female | >=65 | I/II | Unknown | Unknown | SD | |
| CCDC71 | insertion | Nonsense_Mutation | novel | c.977_978insCTTGCAGCTAGTGGGTTTTTAGGTCCTGGAATGGAGCCTTTGTG | p.Ala327LeufsTer7 | p.A327Lfs*7 | Q8IV32 | protein_coding | TCGA-A8-A07U-01 | Breast | breast invasive carcinoma | Female | >=65 | III/IV | Chemotherapy | 5-fluorouracil | SD | ||
| CCDC71 | insertion | Frame_Shift_Ins | novel | c.491_492insGAAGAGGAAAAGGGCTGAGGAGGCAAAAGATCTT | p.His164GlnfsTer28 | p.H164Qfs*28 | Q8IV32 | protein_coding | TCGA-BH-A0H7-01 | Breast | breast invasive carcinoma | Female | >=65 | III/IV | Chemotherapy | doxorubicin | SD | ||
| CCDC71 | deletion | Frame_Shift_Del | novel | c.1120delN | p.Thr374LeufsTer43 | p.T374Lfs*43 | Q8IV32 | protein_coding | TCGA-D8-A27V-01 | Breast | breast invasive carcinoma | Female | <65 | I/II | Hormone Therapy | tamoxiphen | SD | ||
| CCDC71 | SNV | Missense_Mutation | c.1174A>G | p.Arg392Gly | p.R392G | Q8IV32 | protein_coding | deleterious(0.03) | benign(0.387) | TCGA-C5-A8XJ-01 | Cervix | cervical & endocervical cancer | Female | >=65 | I/II | Chemotherapy | cisplatin | SD | |
| CCDC71 | SNV | Missense_Mutation | novel | c.998N>T | p.Ala333Val | p.A333V | Q8IV32 | protein_coding | tolerated_low_confidence(0.16) | benign(0.23) | TCGA-AA-3947-01 | Colorectum | colon adenocarcinoma | Female | <65 | I/II | Unknown | Unknown | SD |
| CCDC71 | SNV | Missense_Mutation | c.265C>T | p.Arg89Cys | p.R89C | Q8IV32 | protein_coding | tolerated(0.07) | benign(0.011) | TCGA-AA-A010-01 | Colorectum | colon adenocarcinoma | Female | <65 | I/II | Chemotherapy | folinic | CR | |
| CCDC71 | SNV | Missense_Mutation | novel | c.877G>C | p.Ala293Pro | p.A293P | Q8IV32 | protein_coding | deleterious(0.01) | possibly_damaging(0.474) | TCGA-AA-A029-01 | Colorectum | colon adenocarcinoma | Male | >=65 | I/II | Unknown | Unknown | SD |
| CCDC71 | SNV | Missense_Mutation | c.95N>C | p.Leu32Pro | p.L32P | Q8IV32 | protein_coding | tolerated(0.11) | possibly_damaging(0.858) | TCGA-CA-6717-01 | Colorectum | colon adenocarcinoma | Male | <65 | I/II | Chemotherapy | oxaliplatin | CR | |
| CCDC71 | SNV | Missense_Mutation | c.1292T>C | p.Val431Ala | p.V431A | Q8IV32 | protein_coding | deleterious(0) | probably_damaging(0.941) | TCGA-D5-6927-01 | Colorectum | colon adenocarcinoma | Male | <65 | I/II | Unknown | Unknown | SD |
| Page: 1 2 3 4 |
Top |
Related drugs of malignant transformation related genes |
| Identification of chemicals and drugs interact with genes involved in malignant transfromation |
| (DGIdb 4.0) |
| Entrez ID | Symbol | Category | Interaction Types | Drug Claim Name | Drug Name | PMIDs |
| Page: 1 |

Copyright 2023-Present -The University of Texas Health Science Center at Houston |