
|
|||||
|
 | |
| |
| |
| |
| |
| |
|
Gene: CCDC69 |
Gene summary for CCDC69 |
| Gene information | Species | Human | Gene symbol | CCDC69 | Gene ID | 26112 |
| Gene name | coiled-coil domain containing 69 | |
| Gene Alias | CCDC69 | |
| Cytomap | 5q33.1 | |
| Gene Type | protein-coding | GO ID | GO:0000226 | UniProtAcc | A6NI79 |
Top |
Malignant transformation analysis |
| Identification of the aberrant gene expression in precancerous and cancerous lesions by comparing the gene expression of stem-like cells in diseased tissues with normal stem cells |
| Entrez ID | Symbol | Replicates | Species | Organ | Tissue | Adj P-value | Log2FC | Malignancy |
| 26112 | CCDC69 | HCC1_Meng | Human | Liver | HCC | 5.41e-12 | -2.74e-02 | 0.0246 |
| 26112 | CCDC69 | HCC1 | Human | Liver | HCC | 1.34e-02 | 1.84e+00 | 0.5336 |
| 26112 | CCDC69 | HCC2 | Human | Liver | HCC | 9.47e-23 | 3.43e+00 | 0.5341 |
| 26112 | CCDC69 | HCC5 | Human | Liver | HCC | 4.69e-22 | 1.38e+00 | 0.4932 |
| 26112 | CCDC69 | Dong_P1 | Human | Prostate | Tumor | 3.73e-02 | 5.89e-02 | 0.035 |
| 26112 | CCDC69 | GSM5353218_PA_PB1B_Pool_1_2_S74_L003 | Human | Prostate | Tumor | 1.35e-06 | 8.73e-01 | 0.1479 |
| 26112 | CCDC69 | GSM5353220_PA_PB1B_Pool_3_S51_L002 | Human | Prostate | Tumor | 2.62e-04 | 6.79e-01 | 0.1531 |
| Page: 1 |
| Tissue | Expression Dynamics | Abbreviation |
| Liver |  | HCC: Hepatocellular carcinoma |
| NAFLD: Non-alcoholic fatty liver disease | ||
| Prostate | 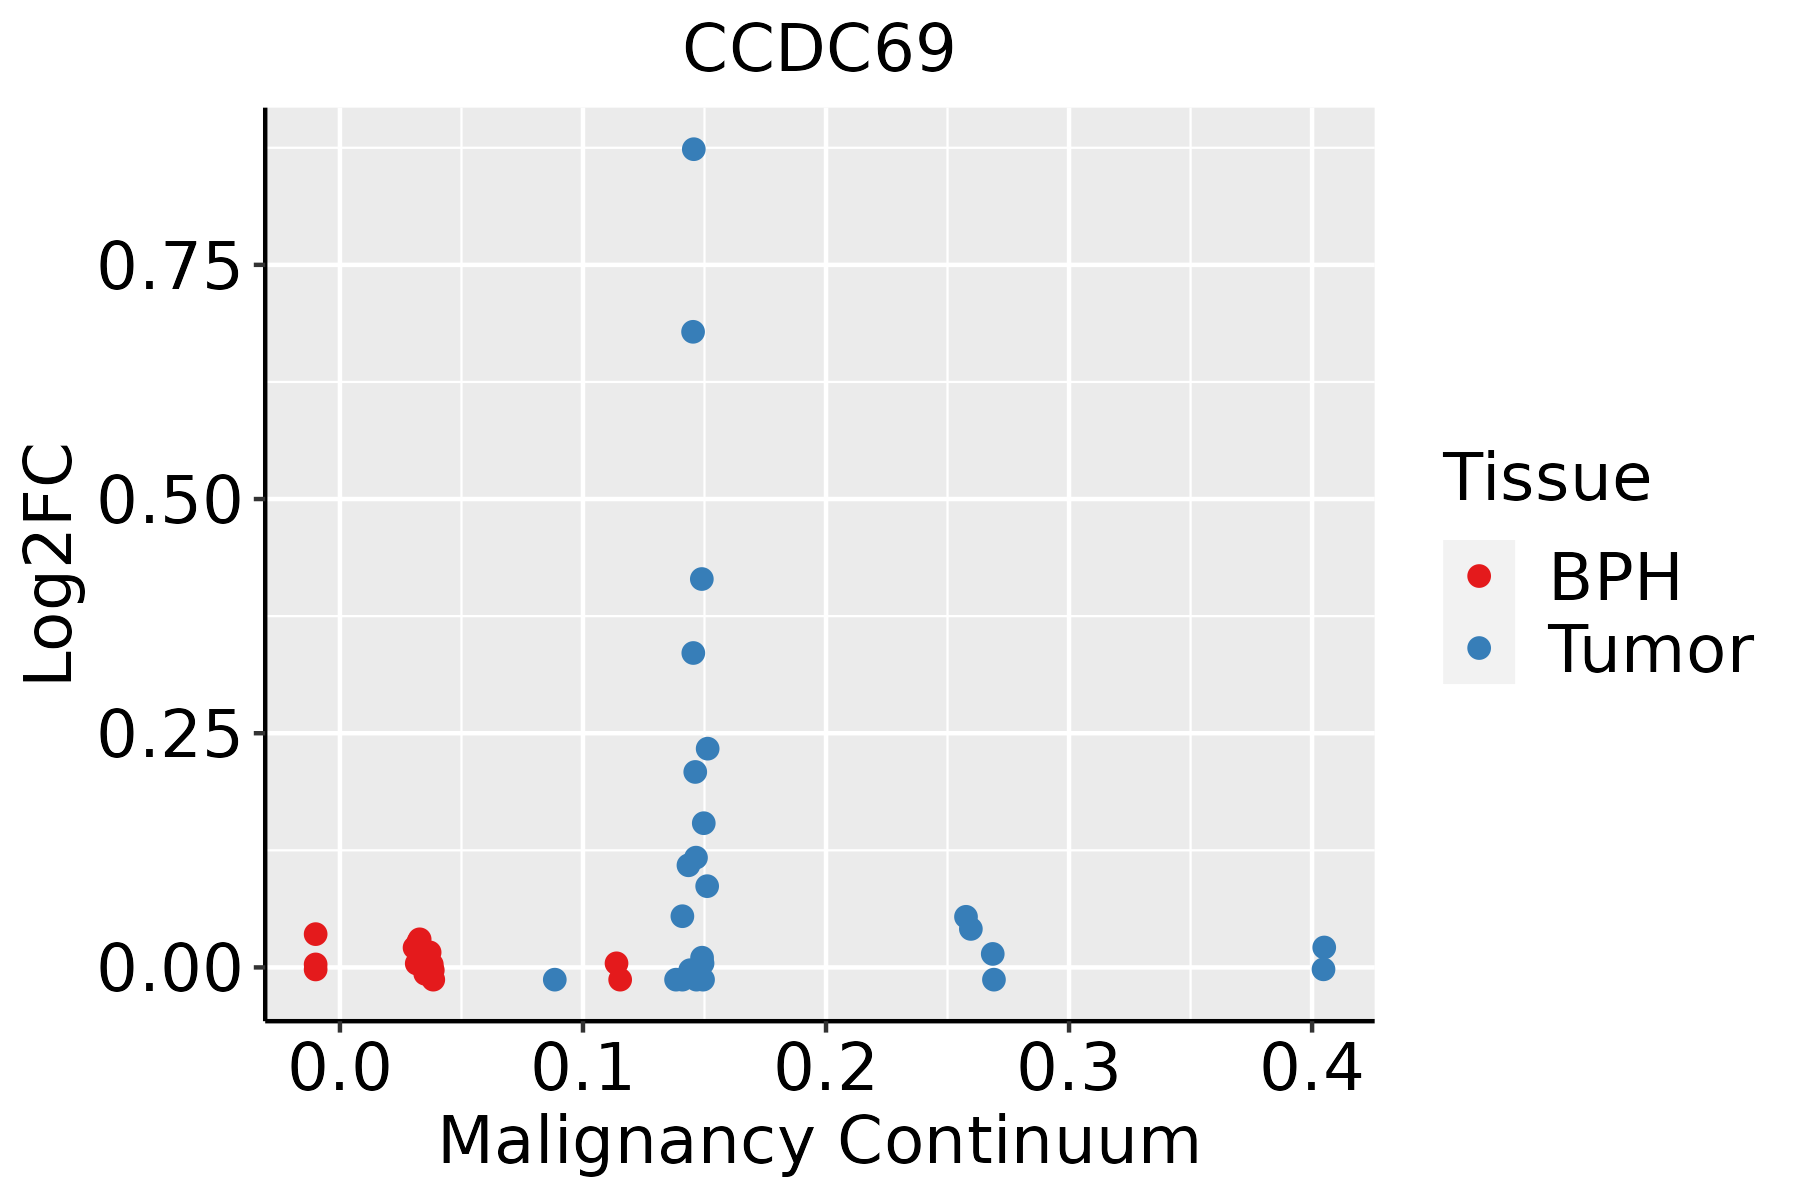 | BPH: Benign Prostatic Hyperplasia |
| ∗log2FC in expression of this searched gene in stem-like cells from each diseased tissue sample relative to stem-like cells in normal samples in each tissue plotted against the malignancy continuum. Samples are colored based on if they are from different disease stage. |
Top |
Malignant transformation related pathway analysis |
| Find out the enriched GO biological processes and KEGG pathways involved in transition from healthy to precancer to cancer |
| Tissue | Disease Stage | Enriched GO biological Processes |
| Colorectum | AD |  |
| Colorectum | SER |  |
| Colorectum | MSS |  |
| Colorectum | MSI-H |  |
| Colorectum | FAP |  |
| ∗Top 15 enriched GO BP terms are showed in the bar plot of each disease state in each tissue. Each row represents a significant GO biological process which is colored according to the -log10(p.adjust). |
| Page: 1 2 3 4 5 6 7 8 9 |
| GO ID | Tissue | Disease Stage | Description | Gene Ratio | Bg Ratio | pvalue | p.adjust | Count |
| GO:000705111 | Liver | HCC | spindle organization | 116/7958 | 184/18723 | 1.40e-08 | 3.40e-07 | 116 |
| GO:005122511 | Liver | HCC | spindle assembly | 75/7958 | 117/18723 | 1.92e-06 | 2.67e-05 | 75 |
| GO:000705112 | Prostate | Tumor | spindle organization | 48/3246 | 184/18723 | 1.80e-03 | 1.06e-02 | 48 |
| Page: 1 |
| Pathway ID | Tissue | Disease Stage | Description | Gene Ratio | Bg Ratio | pvalue | p.adjust | qvalue | Count |
| Page: 1 |
Top |
Cell-cell communication analysis |
| Identification of potential cell-cell interactions between two cell types and their ligand-receptor pairs for different disease states |
| Ligand | Receptor | LRpair | Pathway | Tissue | Disease Stage |
| Page: 1 |
Top |
Single-cell gene regulatory network inference analysis |
| Find out the significant the regulons (TFs) and the target genes of each regulon across cell types for different disease states |
| TF | Cell Type | Tissue | Disease Stage | Target Gene | RSS | Regulon Activity |
| ∗The dot plots of a searched regulon are shown for all cell subpopulations in each disease state of each tissue based on the regulon specific score inferred using pySCENIC and by calculating the average expression. |
| Page: 1 |
Top |
Somatic mutation of malignant transformation related genes |
| Annotation of somatic variants for genes involved in malignant transformation |
| Hugo Symbol | Variant Class | Variant Classification | dbSNP RS | HGVSc | HGVSp | HGVSp Short | SWISSPROT | BIOTYPE | SIFT | PolyPhen | Tumor Sample Barcode | Tissue | Histology | Sex | Age | Stage | Therapy Types | Drugs | Outcome |
| CCDC69 | SNV | Missense_Mutation | novel | c.871N>A | p.Val291Ile | p.V291I | A6NI79 | protein_coding | deleterious(0.01) | possibly_damaging(0.536) | TCGA-EW-A1PB-01 | Breast | breast invasive carcinoma | Female | >=65 | III/IV | Unknown | Unknown | SD |
| CCDC69 | insertion | Nonsense_Mutation | novel | c.406_407insTGTTTTAAAAAAAAGTCTTACAG | p.Arg136MetfsTer3 | p.R136Mfs*3 | A6NI79 | protein_coding | TCGA-BH-A0HF-01 | Breast | breast invasive carcinoma | Female | >=65 | I/II | Hormone Therapy | arimidex | SD | ||
| CCDC69 | SNV | Missense_Mutation | rs151212037 | c.742C>T | p.Arg248Cys | p.R248C | A6NI79 | protein_coding | deleterious(0) | possibly_damaging(0.799) | TCGA-2W-A8YY-01 | Cervix | cervical & endocervical cancer | Female | <65 | I/II | Chemotherapy | cisplatin | CR |
| CCDC69 | SNV | Missense_Mutation | novel | c.146C>A | p.Ala49Glu | p.A49E | A6NI79 | protein_coding | tolerated(0.56) | benign(0) | TCGA-AA-3977-01 | Colorectum | colon adenocarcinoma | Male | >=65 | I/II | Unknown | Unknown | SD |
| CCDC69 | SNV | Missense_Mutation | c.838G>A | p.Ala280Thr | p.A280T | A6NI79 | protein_coding | tolerated(0.76) | benign(0.011) | TCGA-CM-4746-01 | Colorectum | colon adenocarcinoma | Male | <65 | I/II | Unknown | Unknown | SD | |
| CCDC69 | SNV | Missense_Mutation | c.365C>A | p.Ser122Tyr | p.S122Y | A6NI79 | protein_coding | deleterious(0) | possibly_damaging(0.858) | TCGA-A5-A1OF-01 | Endometrium | uterine corpus endometrioid carcinoma | Female | <65 | I/II | Unknown | Unknown | SD | |
| CCDC69 | SNV | Missense_Mutation | c.621G>T | p.Glu207Asp | p.E207D | A6NI79 | protein_coding | tolerated(0.06) | benign(0.38) | TCGA-AP-A0LM-01 | Endometrium | uterine corpus endometrioid carcinoma | Female | <65 | III/IV | Chemotherapy | cisplatin | SD | |
| CCDC69 | SNV | Missense_Mutation | novel | c.359N>T | p.Thr120Ile | p.T120I | A6NI79 | protein_coding | tolerated(0.07) | benign(0.001) | TCGA-AX-A0J0-01 | Endometrium | uterine corpus endometrioid carcinoma | Female | <65 | I/II | Unknown | Unknown | SD |
| CCDC69 | SNV | Missense_Mutation | novel | c.284N>T | p.Arg95Met | p.R95M | A6NI79 | protein_coding | deleterious(0.03) | benign(0.146) | TCGA-B5-A1MX-01 | Endometrium | uterine corpus endometrioid carcinoma | Female | <65 | I/II | Hormone Therapy | megace | SD |
| CCDC69 | SNV | Missense_Mutation | rs150024530 | c.824N>T | p.Ala275Val | p.A275V | A6NI79 | protein_coding | deleterious(0.01) | possibly_damaging(0.447) | TCGA-D1-A1NY-01 | Endometrium | uterine corpus endometrioid carcinoma | Female | >=65 | I/II | Chemotherapy | carboplatin | SD |
| Page: 1 2 3 |
Top |
Related drugs of malignant transformation related genes |
| Identification of chemicals and drugs interact with genes involved in malignant transfromation |
| (DGIdb 4.0) |
| Entrez ID | Symbol | Category | Interaction Types | Drug Claim Name | Drug Name | PMIDs |
| Page: 1 |

Copyright 2023-Present -The University of Texas Health Science Center at Houston |