
|
|||||
|
 | |
| |
| |
| |
| |
| |
|
Gene: CCDC66 |
Gene summary for CCDC66 |
| Gene information | Species | Human | Gene symbol | CCDC66 | Gene ID | 285331 |
| Gene name | coiled-coil domain containing 66 | |
| Gene Alias | CCDC66 | |
| Cytomap | 3p14.3 | |
| Gene Type | protein-coding | GO ID | GO:0000226 | UniProtAcc | A2RUB6 |
Top |
Malignant transformation analysis |
| Identification of the aberrant gene expression in precancerous and cancerous lesions by comparing the gene expression of stem-like cells in diseased tissues with normal stem cells |
| Entrez ID | Symbol | Replicates | Species | Organ | Tissue | Adj P-value | Log2FC | Malignancy |
| 285331 | CCDC66 | C21 | Human | Oral cavity | OSCC | 6.61e-07 | 2.34e-01 | 0.2678 |
| 285331 | CCDC66 | C38 | Human | Oral cavity | OSCC | 9.68e-04 | 5.88e-01 | 0.172 |
| 285331 | CCDC66 | C43 | Human | Oral cavity | OSCC | 1.66e-04 | 1.65e-01 | 0.1704 |
| 285331 | CCDC66 | C46 | Human | Oral cavity | OSCC | 4.83e-37 | 8.40e-01 | 0.1673 |
| 285331 | CCDC66 | C08 | Human | Oral cavity | OSCC | 1.55e-02 | 1.85e-01 | 0.1919 |
| 285331 | CCDC66 | C09 | Human | Oral cavity | OSCC | 3.24e-06 | 2.39e-01 | 0.1431 |
| 285331 | CCDC66 | LN46 | Human | Oral cavity | OSCC | 6.78e-14 | 7.29e-01 | 0.1666 |
| 285331 | CCDC66 | SYSMH2 | Human | Oral cavity | OSCC | 1.51e-06 | 2.33e-01 | 0.2326 |
| 285331 | CCDC66 | SYSMH3 | Human | Oral cavity | OSCC | 1.70e-13 | 4.82e-01 | 0.2442 |
| 285331 | CCDC66 | SYSMH6 | Human | Oral cavity | OSCC | 2.19e-05 | 2.12e-01 | 0.1275 |
| 285331 | CCDC66 | male-WTA | Human | Thyroid | PTC | 1.21e-11 | 1.21e-01 | 0.1037 |
| 285331 | CCDC66 | PTC01 | Human | Thyroid | PTC | 3.12e-16 | 2.70e-01 | 0.1899 |
| 285331 | CCDC66 | PTC03 | Human | Thyroid | PTC | 5.39e-12 | 3.61e-01 | 0.1784 |
| 285331 | CCDC66 | PTC04 | Human | Thyroid | PTC | 4.38e-21 | 3.17e-01 | 0.1927 |
| 285331 | CCDC66 | PTC05 | Human | Thyroid | PTC | 7.84e-19 | 6.51e-01 | 0.2065 |
| 285331 | CCDC66 | PTC06 | Human | Thyroid | PTC | 7.68e-29 | 5.42e-01 | 0.2057 |
| 285331 | CCDC66 | PTC07 | Human | Thyroid | PTC | 5.85e-33 | 5.83e-01 | 0.2044 |
| 285331 | CCDC66 | ATC09 | Human | Thyroid | ATC | 4.80e-06 | 2.64e-01 | 0.2871 |
| 285331 | CCDC66 | ATC12 | Human | Thyroid | ATC | 1.47e-18 | 3.99e-01 | 0.34 |
| 285331 | CCDC66 | ATC13 | Human | Thyroid | ATC | 3.91e-41 | 7.35e-01 | 0.34 |
| Page: 1 2 |
| Tissue | Expression Dynamics | Abbreviation |
| Oral Cavity | 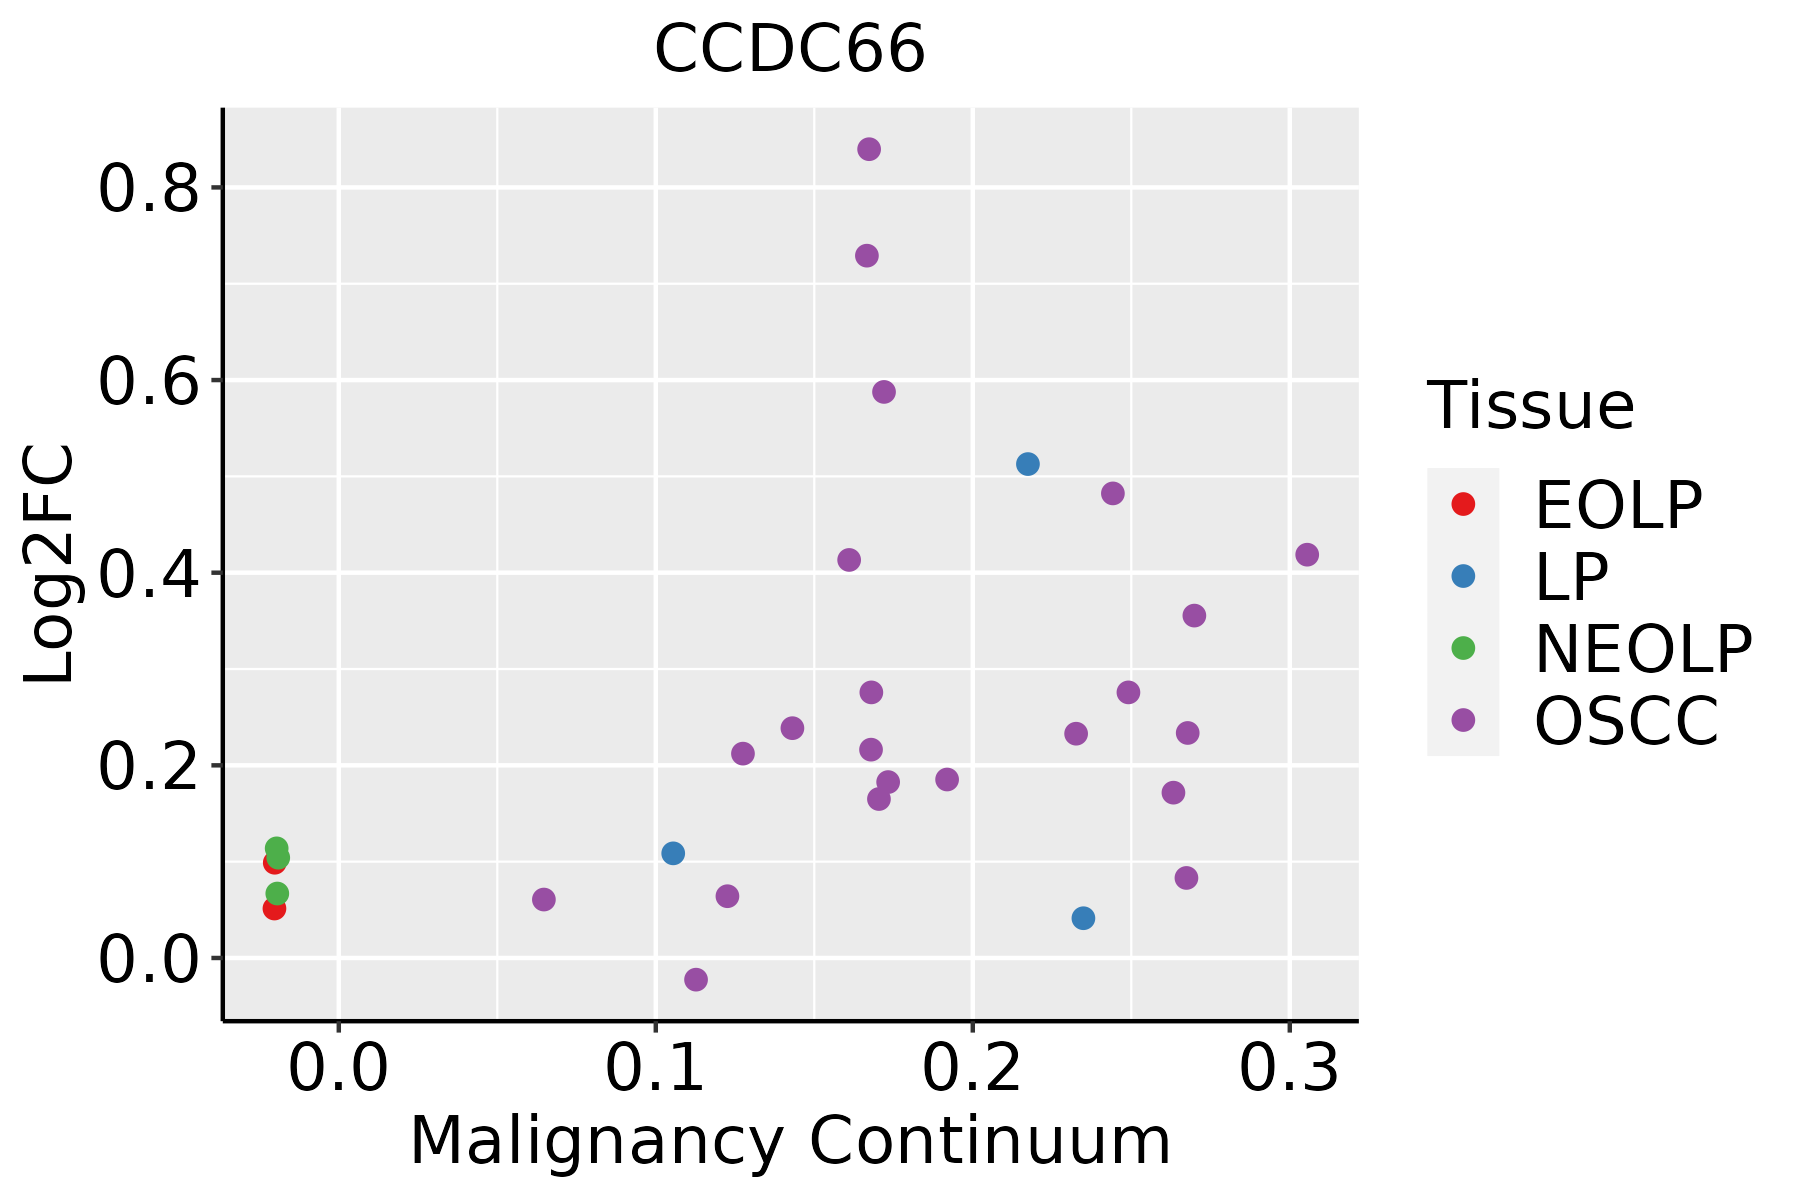 | EOLP: Erosive Oral lichen planus |
| LP: leukoplakia | ||
| NEOLP: Non-erosive oral lichen planus | ||
| OSCC: Oral squamous cell carcinoma | ||
| Thyroid |  | ATC: Anaplastic thyroid cancer |
| HT: Hashimoto's thyroiditis | ||
| PTC: Papillary thyroid cancer |
| ∗log2FC in expression of this searched gene in stem-like cells from each diseased tissue sample relative to stem-like cells in normal samples in each tissue plotted against the malignancy continuum. Samples are colored based on if they are from different disease stage. |
Top |
Malignant transformation related pathway analysis |
| Find out the enriched GO biological processes and KEGG pathways involved in transition from healthy to precancer to cancer |
| Tissue | Disease Stage | Enriched GO biological Processes |
| Colorectum | AD |  |
| Colorectum | SER |  |
| Colorectum | MSS |  |
| Colorectum | MSI-H |  |
| Colorectum | FAP |  |
| ∗Top 15 enriched GO BP terms are showed in the bar plot of each disease state in each tissue. Each row represents a significant GO biological process which is colored according to the -log10(p.adjust). |
| Page: 1 2 3 4 5 6 7 8 9 |
| GO ID | Tissue | Disease Stage | Description | Gene Ratio | Bg Ratio | pvalue | p.adjust | Count |
| GO:000931416 | Oral cavity | OSCC | response to radiation | 241/7305 | 456/18723 | 9.76e-10 | 2.40e-08 | 241 |
| GO:00094164 | Oral cavity | OSCC | response to light stimulus | 159/7305 | 320/18723 | 5.98e-05 | 4.92e-04 | 159 |
| GO:0009314111 | Thyroid | PTC | response to radiation | 195/5968 | 456/18723 | 5.10e-07 | 8.27e-06 | 195 |
| GO:00094167 | Thyroid | PTC | response to light stimulus | 127/5968 | 320/18723 | 1.76e-03 | 9.58e-03 | 127 |
| GO:000931426 | Thyroid | ATC | response to radiation | 210/6293 | 456/18723 | 1.69e-08 | 3.39e-07 | 210 |
| GO:000941613 | Thyroid | ATC | response to light stimulus | 139/6293 | 320/18723 | 1.42e-04 | 9.88e-04 | 139 |
| Page: 1 |
| Pathway ID | Tissue | Disease Stage | Description | Gene Ratio | Bg Ratio | pvalue | p.adjust | qvalue | Count |
| Page: 1 |
Top |
Cell-cell communication analysis |
| Identification of potential cell-cell interactions between two cell types and their ligand-receptor pairs for different disease states |
| Ligand | Receptor | LRpair | Pathway | Tissue | Disease Stage |
| Page: 1 |
Top |
Single-cell gene regulatory network inference analysis |
| Find out the significant the regulons (TFs) and the target genes of each regulon across cell types for different disease states |
| TF | Cell Type | Tissue | Disease Stage | Target Gene | RSS | Regulon Activity |
| ∗The dot plots of a searched regulon are shown for all cell subpopulations in each disease state of each tissue based on the regulon specific score inferred using pySCENIC and by calculating the average expression. |
| Page: 1 |
Top |
Somatic mutation of malignant transformation related genes |
| Annotation of somatic variants for genes involved in malignant transformation |
| Hugo Symbol | Variant Class | Variant Classification | dbSNP RS | HGVSc | HGVSp | HGVSp Short | SWISSPROT | BIOTYPE | SIFT | PolyPhen | Tumor Sample Barcode | Tissue | Histology | Sex | Age | Stage | Therapy Types | Drugs | Outcome |
| CCDC66 | SNV | Missense_Mutation | novel | c.1992N>C | p.Gln664His | p.Q664H | A2RUB6 | protein_coding | tolerated(0.34) | benign(0.012) | TCGA-A2-A0ER-01 | Breast | breast invasive carcinoma | Female | <65 | I/II | Chemotherapy | cytoxan | SD |
| CCDC66 | SNV | Missense_Mutation | c.131N>T | p.Cys44Phe | p.C44F | A2RUB6 | protein_coding | tolerated(0.7) | benign(0.076) | TCGA-A2-A25A-01 | Breast | breast invasive carcinoma | Female | <65 | I/II | Unspecific | Cytoxan | SD | |
| CCDC66 | SNV | Missense_Mutation | novel | c.341C>A | p.Ala114Glu | p.A114E | A2RUB6 | protein_coding | tolerated(0.6) | benign(0.007) | TCGA-A8-A07L-01 | Breast | breast invasive carcinoma | Female | <65 | III/IV | Chemotherapy | CR | |
| CCDC66 | SNV | Missense_Mutation | novel | c.2611N>A | p.Asp871Asn | p.D871N | A2RUB6 | protein_coding | deleterious(0.03) | benign(0.062) | TCGA-A8-A09A-01 | Breast | breast invasive carcinoma | Female | <65 | I/II | Hormone Therapy | tamoxiphen | SD |
| CCDC66 | SNV | Missense_Mutation | c.817N>C | p.Glu273Gln | p.E273Q | A2RUB6 | protein_coding | deleterious(0) | probably_damaging(0.998) | TCGA-A8-A0A9-01 | Breast | breast invasive carcinoma | Female | >=65 | I/II | Hormone Therapy | anastrozole | SD | |
| CCDC66 | SNV | Missense_Mutation | novel | c.1135C>G | p.Gln379Glu | p.Q379E | A2RUB6 | protein_coding | deleterious(0) | benign(0.225) | TCGA-AR-A0U2-01 | Breast | breast invasive carcinoma | Female | <65 | III/IV | Hormone Therapy | tamoxiphen | PD |
| CCDC66 | SNV | Missense_Mutation | novel | c.1795N>G | p.Thr599Ala | p.T599A | A2RUB6 | protein_coding | tolerated(0.74) | benign(0.005) | TCGA-D8-A1Y1-01 | Breast | breast invasive carcinoma | Female | >=65 | III/IV | Hormone Therapy | tamoxiphen | PD |
| CCDC66 | SNV | Missense_Mutation | c.1120C>A | p.Pro374Thr | p.P374T | A2RUB6 | protein_coding | tolerated(0.06) | benign(0.054) | TCGA-E9-A1NE-01 | Breast | breast invasive carcinoma | Female | <65 | I/II | Chemotherapy | doxorubicin | CR | |
| CCDC66 | insertion | Frame_Shift_Ins | novel | c.876_877insA | p.Ser295IlefsTer2 | p.S295Ifs*2 | A2RUB6 | protein_coding | TCGA-D8-A1XK-01 | Breast | breast invasive carcinoma | Female | <65 | I/II | Chemotherapy | doxorubicine+cyclophosphamide | SD | ||
| CCDC66 | SNV | Missense_Mutation | novel | c.523N>C | p.Glu175Gln | p.E175Q | A2RUB6 | protein_coding | tolerated(0.09) | benign(0.07) | TCGA-GH-A9DA-01 | Cervix | cervical & endocervical cancer | Female | <65 | I/II | Unknown | Unknown | SD |
| Page: 1 2 3 4 5 6 7 8 9 10 |
Top |
Related drugs of malignant transformation related genes |
| Identification of chemicals and drugs interact with genes involved in malignant transfromation |
| (DGIdb 4.0) |
| Entrez ID | Symbol | Category | Interaction Types | Drug Claim Name | Drug Name | PMIDs |
| Page: 1 |

Copyright 2023-Present -The University of Texas Health Science Center at Houston |