Schematic overview of the cellular and molecular mechanisms involved in the cancer progression, including the proposed cellular and molecular mechanisms in cancer cells trajectory. AT1: alveolar type 1 cells; AT2: alveolar type 2 cells; AAH: atypical adenomatous hyperplasia; AIS: adenocarcinoma in situ; MIA: minimally invasive adenocarcinoma; IA: invasive adenocarcinoma; EMT: epithelial-mesenchymal transition

Home

Download

Statistics

Help

Contact

Center for Computational Systems Medicine
leaf

Gene summary

leaf

Malignant transformation analysis

leaf

Malignant transformation related pathway analysis

leaf

Cell-cell communication analysis

leaf

Single-cell gene regulatory network inference analysis

leaf

Somatic mutation of malignant transformation related genes

leaf

Related drugs of malignant transformation related genes

Gene: CCDC57

Gene summary for CCDC57

check button Gene summary.

Gene informationSpeciesHuman
Gene symbol

CCDC57

Gene ID

284001

Gene namecoiled-coil domain containing 57
Gene AliasCCDC57
Cytomap17q25.3
Gene Typeprotein-coding
GO ID

GO:0000086

UniProtAcc

Q2TAC2


Top

Malignant transformation analysis

check button Identification of the aberrant gene expression in precancerous and cancerous lesions by comparing the gene expression of stem-like cells in diseased tissues with normal stem cells
check button Malignant transformation involving gene list.
Entrez IDSymbolReplicatesSpeciesOrganTissueAdj P-valueLog2FCMalignancy
284001CCDC57GSM4909281HumanBreastIDC2.15e-03-1.81e-010.21
284001CCDC57GSM4909285HumanBreastIDC1.75e-03-1.73e-010.21
284001CCDC57GSM4909286HumanBreastIDC1.33e-031.53e-010.1081
284001CCDC57GSM4909293HumanBreastIDC9.34e-144.19e-010.1581
284001CCDC57GSM4909306HumanBreastIDC7.50e-033.27e-010.1564
284001CCDC57GSM4909308HumanBreastIDC4.46e-021.95e-010.158
284001CCDC57GSM4909311HumanBreastIDC2.73e-10-1.16e-010.1534
284001CCDC57GSM4909312HumanBreastIDC6.35e-04-1.27e-010.1552
284001CCDC57GSM4909319HumanBreastIDC2.00e-211.58e-010.1563
284001CCDC57brca1HumanBreastPrecancer1.06e-03-1.84e-01-0.0338
284001CCDC57M1HumanBreastIDC6.85e-491.12e+000.1577
284001CCDC57NCCBC14HumanBreastDCIS7.77e-03-2.19e-020.2021
284001CCDC57P1HumanBreastIDC4.50e-155.17e-010.1527
284001CCDC57DCIS2HumanBreastDCIS2.00e-526.64e-020.0085
284001CCDC57LZE4THumanEsophagusESCC6.86e-072.33e-010.0811
284001CCDC57LZE7THumanEsophagusESCC8.24e-064.25e-010.0667
284001CCDC57LZE8THumanEsophagusESCC1.21e-051.99e-010.067
284001CCDC57LZE20THumanEsophagusESCC3.04e-041.20e-010.0662
284001CCDC57LZE21D1HumanEsophagusHGIN7.88e-044.19e-010.0632
284001CCDC57LZE22D1HumanEsophagusHGIN2.71e-092.60e-010.0595
Page: 1 2 3 4 5 6 

check button Transcriptomic changes along malignancy continuum.
TissueExpression DynamicsAbbreviation
BreastThe image shows the transcriptomic changes along malignancy continuum.log2FC in expression of this searched gene in stem-like cells from each diseased tissue sample relative to stem-like cells in normal samples in each tissue plotted against the malignancy continuum. Samples are colored based on if they are from different disease stage.IDC: Invasive ductal carcinoma
DCIS: Ductal carcinoma in situ
Precancer(BRCA1-mut): Precancerous lesion from BRCA1 mutation carriers
EsophagusThe image shows the transcriptomic changes along malignancy continuum.log2FC in expression of this searched gene in stem-like cells from each diseased tissue sample relative to stem-like cells in normal samples in each tissue plotted against the malignancy continuum. Samples are colored based on if they are from different disease stage.
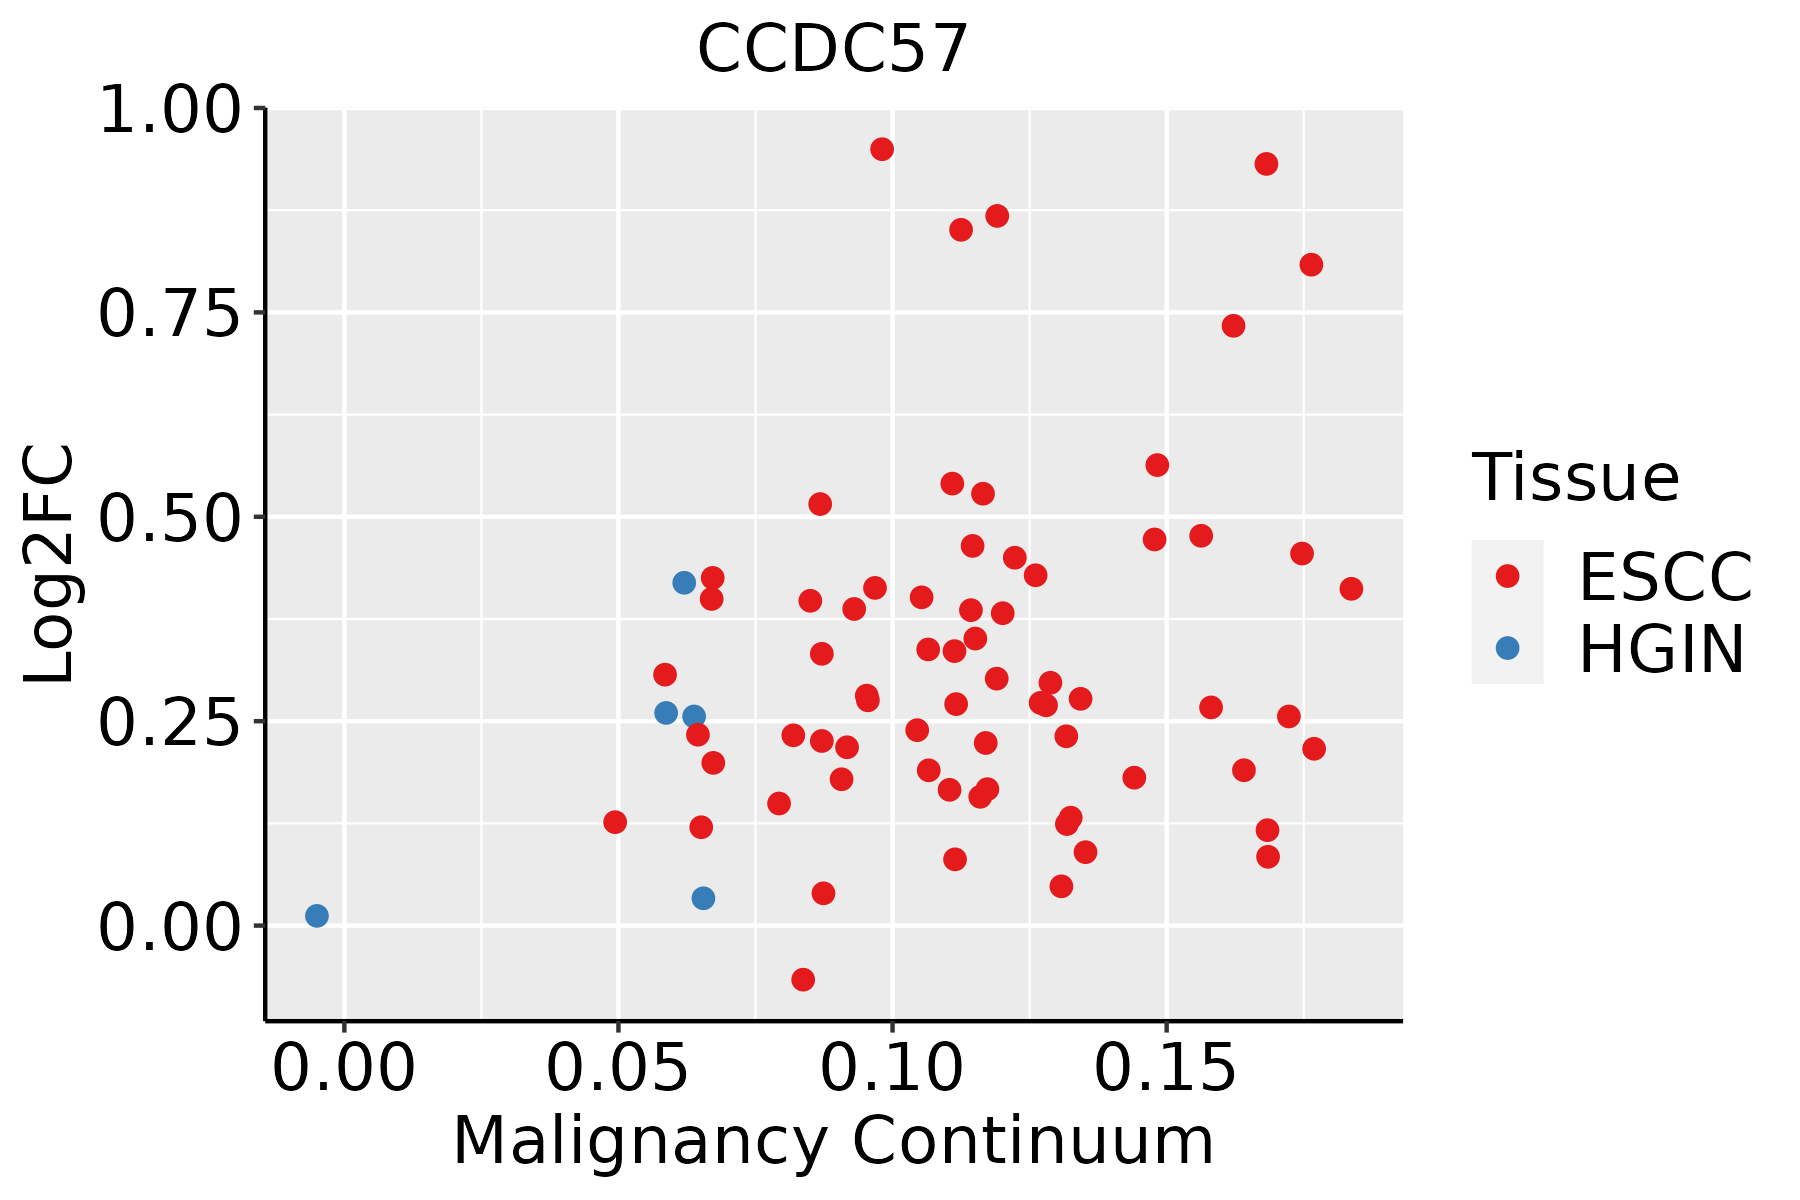
ESCC: Esophageal squamous cell carcinoma
HGIN: High-grade intraepithelial neoplasias
LGIN: Low-grade intraepithelial neoplasias
LiverThe image shows the transcriptomic changes along malignancy continuum.log2FC in expression of this searched gene in stem-like cells from each diseased tissue sample relative to stem-like cells in normal samples in each tissue plotted against the malignancy continuum. Samples are colored based on if they are from different disease stage.
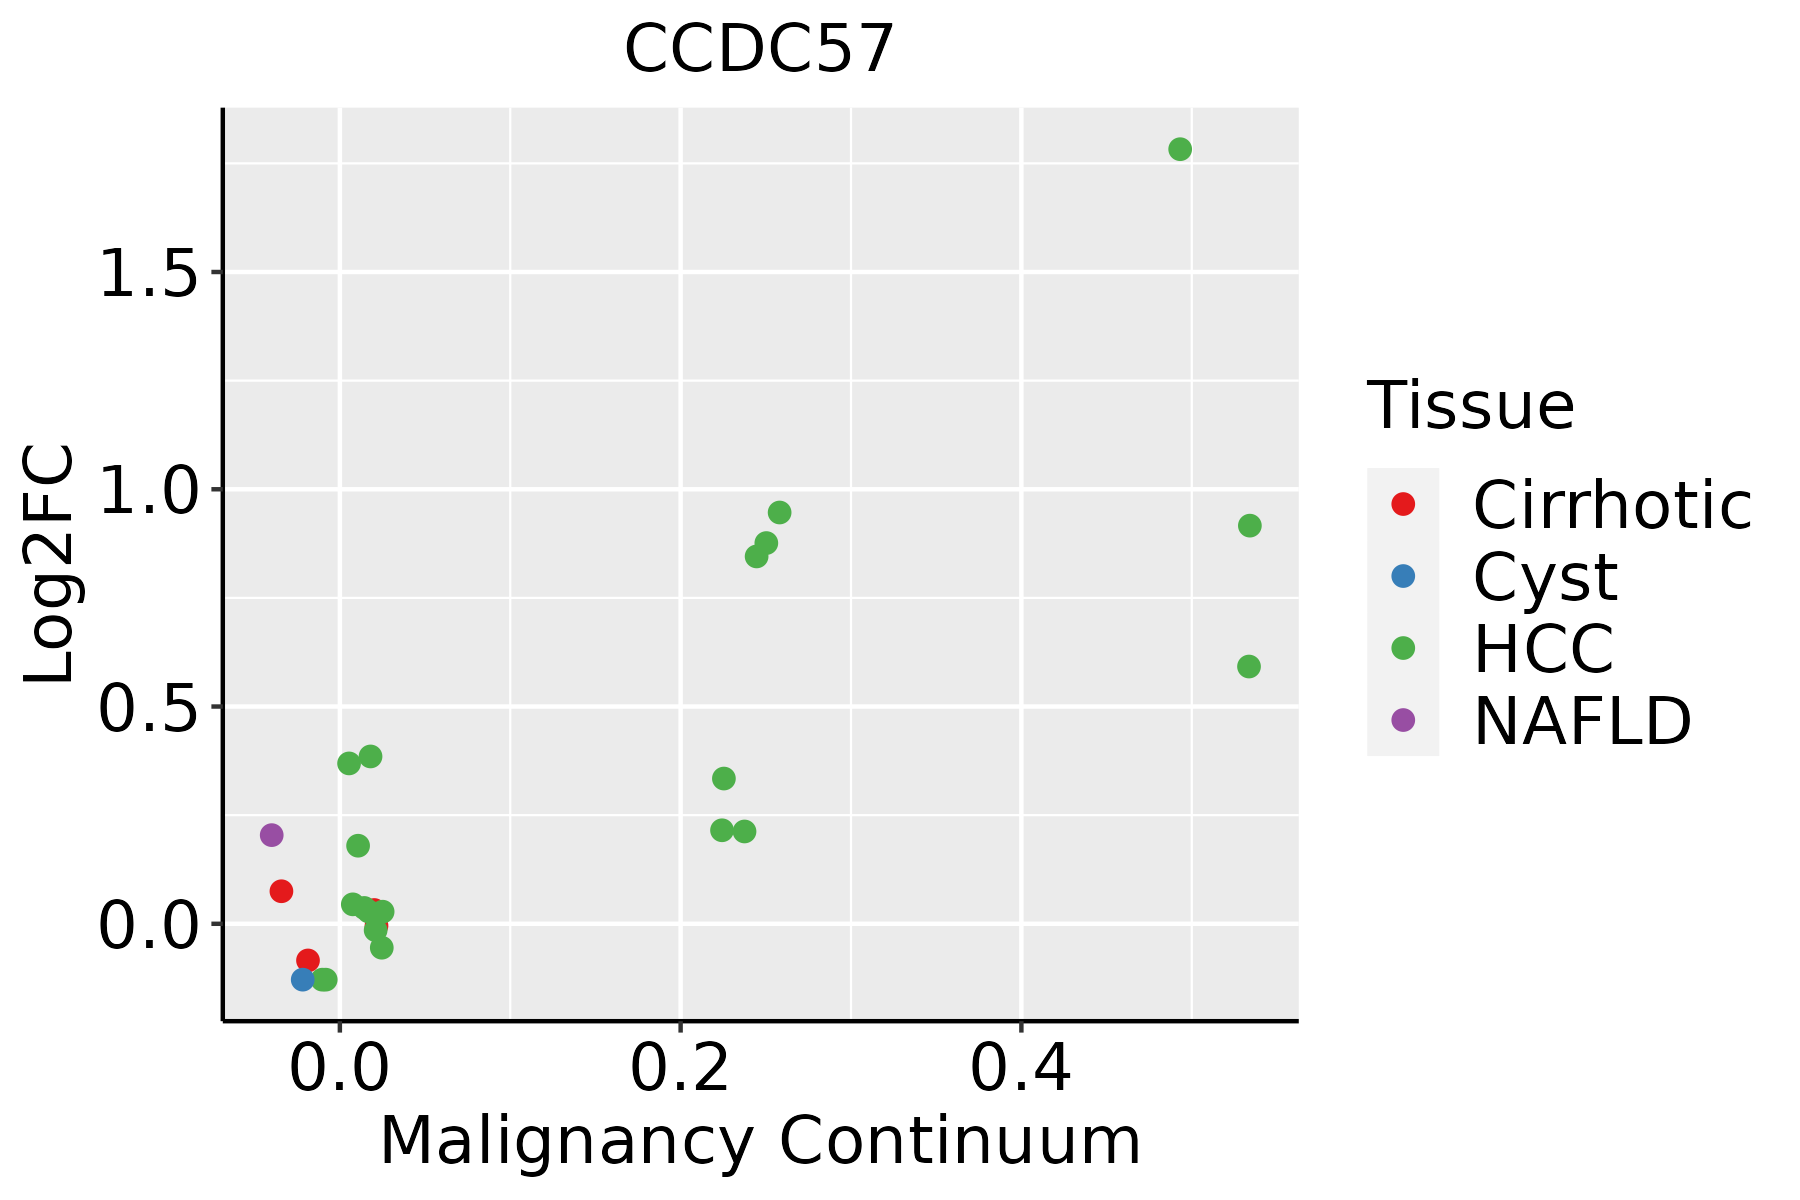
HCC: Hepatocellular carcinoma
NAFLD: Non-alcoholic fatty liver disease
LungThe image shows the transcriptomic changes along malignancy continuum.log2FC in expression of this searched gene in stem-like cells from each diseased tissue sample relative to stem-like cells in normal samples in each tissue plotted against the malignancy continuum. Samples are colored based on if they are from different disease stage.
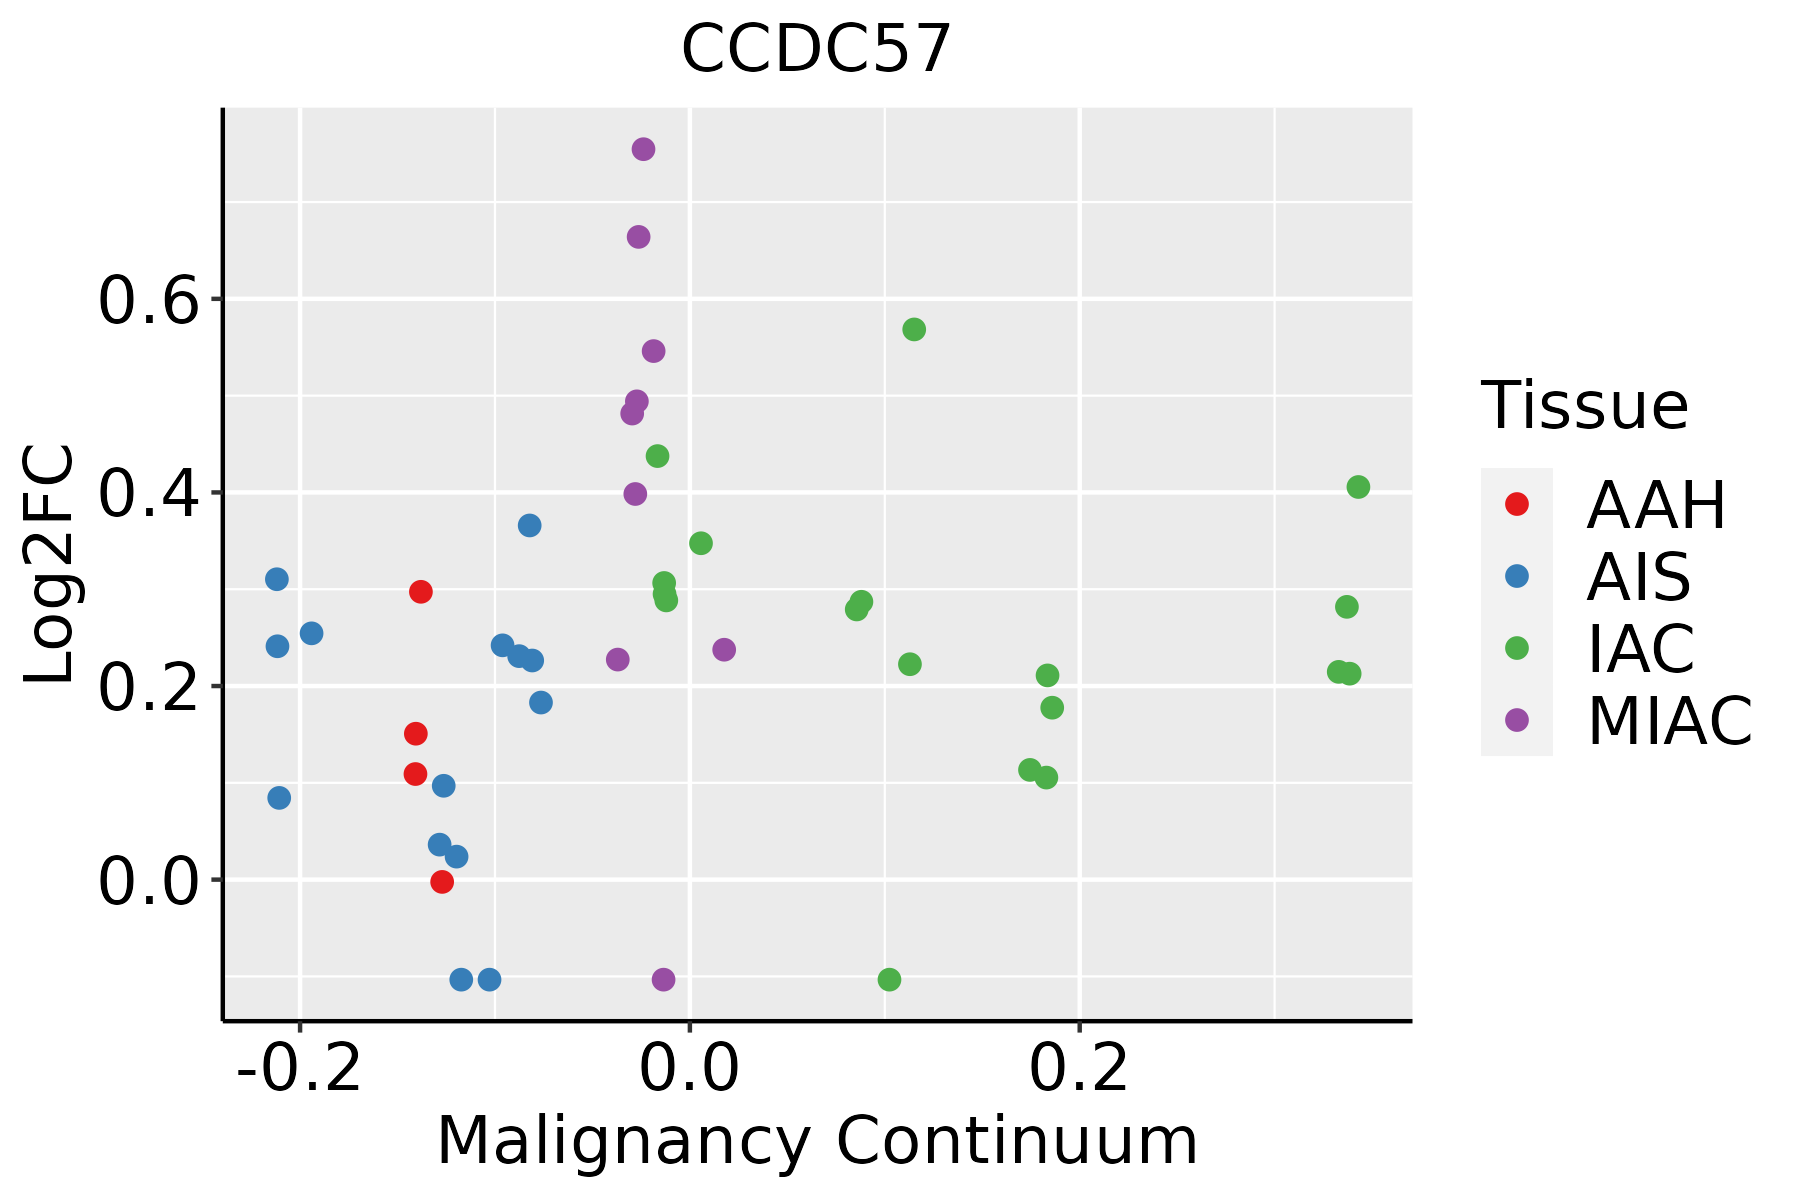
AAH: Atypical adenomatous hyperplasia
AIS: Adenocarcinoma in situ
IAC: Invasive lung adenocarcinoma
MIA: Minimally invasive adenocarcinoma
Oral CavityThe image shows the transcriptomic changes along malignancy continuum.log2FC in expression of this searched gene in stem-like cells from each diseased tissue sample relative to stem-like cells in normal samples in each tissue plotted against the malignancy continuum. Samples are colored based on if they are from different disease stage.
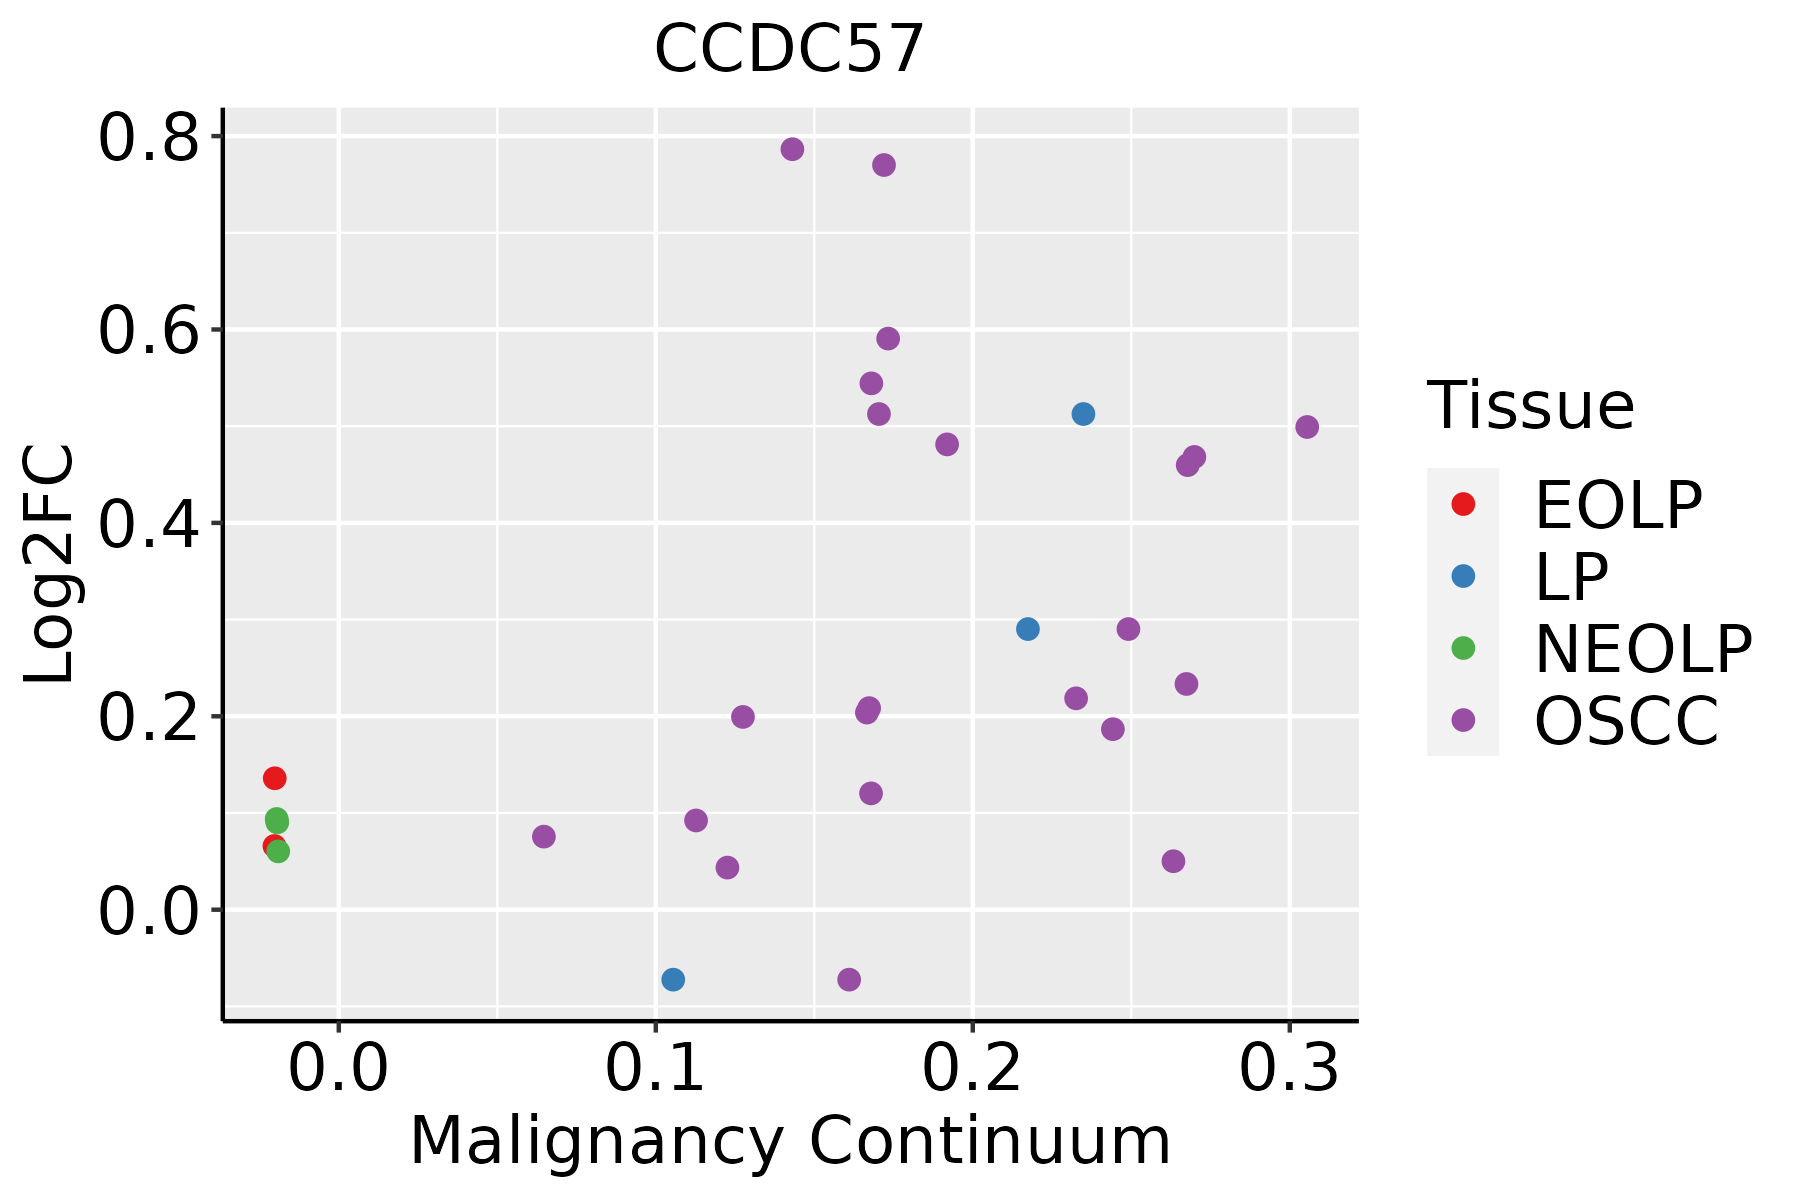
EOLP: Erosive Oral lichen planus
LP: leukoplakia
NEOLP: Non-erosive oral lichen planus
OSCC: Oral squamous cell carcinoma
ProstateThe image shows the transcriptomic changes along malignancy continuum.log2FC in expression of this searched gene in stem-like cells from each diseased tissue sample relative to stem-like cells in normal samples in each tissue plotted against the malignancy continuum. Samples are colored based on if they are from different disease stage.
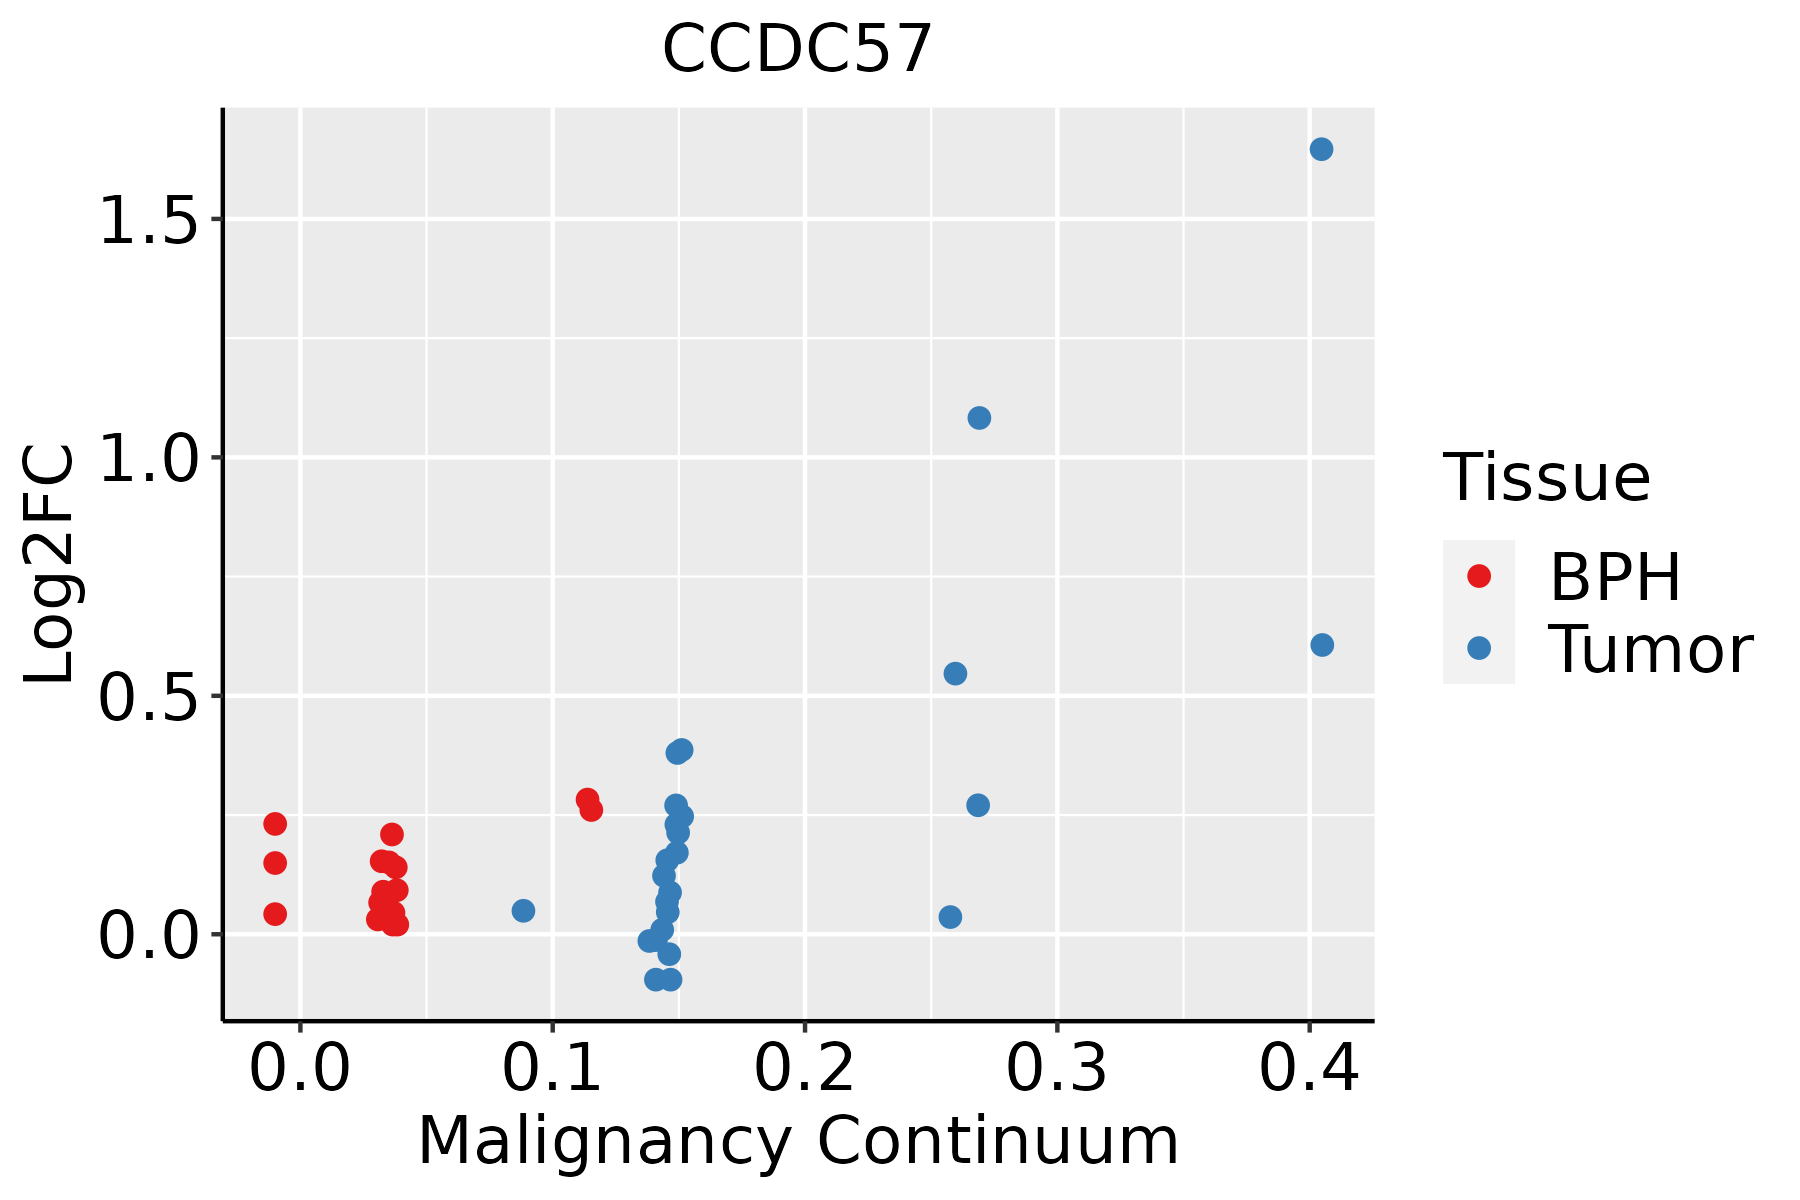
BPH: Benign Prostatic Hyperplasia
∗log2FC in expression of this searched gene in stem-like cells from each diseased tissue sample relative to stem-like cells in normal samples in each tissue plotted against the malignancy continuum. Samples are colored based on if they are from different disease stage.

Top

Malignant transformation related pathway analysis

check buttonFind out the enriched GO biological processes and KEGG pathways involved in transition from healthy to precancer to cancer
check button Figure of enriched GO biological processes.
TissueDisease StageEnriched GO biological Processes
ColorectumADGO analysis - Figure of enriched GO biological processes: Top 15 enriched GO BP terms are showed in the bar plot of each disease state in each tissue. Each row represents a significant GO biological process which is colored according to the -log10(p.adjust).
ColorectumSERGO analysis - Figure of enriched GO biological processes: Top 15 enriched GO BP terms are showed in the bar plot of each disease state in each tissue. Each row represents a significant GO biological process which is colored according to the -log10(p.adjust).
ColorectumMSSGO analysis - Figure of enriched GO biological processes: Top 15 enriched GO BP terms are showed in the bar plot of each disease state in each tissue. Each row represents a significant GO biological process which is colored according to the -log10(p.adjust).
ColorectumMSI-HGO analysis - Figure of enriched GO biological processes: Top 15 enriched GO BP terms are showed in the bar plot of each disease state in each tissue. Each row represents a significant GO biological process which is colored according to the -log10(p.adjust).
ColorectumFAPGO analysis - Figure of enriched GO biological processes: Top 15 enriched GO BP terms are showed in the bar plot of each disease state in each tissue. Each row represents a significant GO biological process which is colored according to the -log10(p.adjust).
∗Top 15 enriched GO BP terms are showed in the bar plot of each disease state in each tissue. Each row represents a significant GO biological process which is colored according to the -log10(p.adjust).
Page: 1 2 3 4 5 6 7 8 9 

check button Enriched GO biological processes.
GO IDTissueDisease StageDescriptionGene RatioBg Ratiopvaluep.adjustCount
GO:00512589BreastIDCprotein polymerization38/1434297/187231.26e-031.34e-0238
GO:00073465BreastIDCregulation of mitotic cell cycle51/1434457/187234.30e-033.35e-0251
GO:00459315BreastIDCpositive regulation of mitotic cell cycle18/1434121/187234.90e-033.73e-0218
GO:005125814BreastDCISprotein polymerization39/1390297/187233.64e-045.15e-0339
GO:000734612BreastDCISregulation of mitotic cell cycle52/1390457/187231.38e-031.43e-0252
GO:004593112BreastDCISpositive regulation of mitotic cell cycle19/1390121/187231.47e-031.49e-0219
GO:00447724BreastDCISmitotic cell cycle phase transition46/1390424/187236.16e-034.39e-0246
GO:000734610EsophagusHGINregulation of mitotic cell cycle98/2587457/187234.39e-061.42e-0498
GO:00447729EsophagusHGINmitotic cell cycle phase transition89/2587424/187232.80e-057.21e-0489
GO:005125826EsophagusHGINprotein polymerization66/2587297/187234.96e-051.19e-0366
GO:004593110EsophagusHGINpositive regulation of mitotic cell cycle28/2587121/187233.72e-033.39e-0228
GO:004477216EsophagusESCCmitotic cell cycle phase transition281/8552424/187234.63e-184.45e-16281
GO:000734615EsophagusESCCregulation of mitotic cell cycle293/8552457/187238.00e-165.64e-14293
GO:004578710EsophagusESCCpositive regulation of cell cycle196/8552313/187239.27e-102.24e-08196
GO:00448394EsophagusESCCcell cycle G2/M phase transition103/8552148/187233.09e-096.67e-08103
GO:00000864EsophagusESCCG2/M transition of mitotic cell cycle96/8552137/187236.00e-091.23e-0796
GO:0051258111EsophagusESCCprotein polymerization183/8552297/187231.94e-083.75e-07183
GO:004593116EsophagusESCCpositive regulation of mitotic cell cycle83/8552121/187232.78e-074.08e-0683
GO:00070982EsophagusESCCcentrosome cycle85/8552130/187234.41e-064.69e-0585
GO:00310233EsophagusESCCmicrotubule organizing center organization92/8552143/187235.04e-065.31e-0592
Page: 1 2 3 4 

check button Enriched KEGG pathways.
Pathway IDTissueDisease StageDescriptionGene RatioBg Ratiopvaluep.adjustqvalueCount
Page: 1 

Top

Cell-cell communication analysis

check buttonIdentification of potential cell-cell interactions between two cell types and their ligand-receptor pairs for different disease states
LigandReceptorLRpairPathwayTissueDisease Stage
Page: 1 

Top

Single-cell gene regulatory network inference analysis

check buttonFind out the significant the regulons (TFs) and the target genes of each regulon across cell types for different disease states
TFCell TypeTissueDisease StageTarget GeneRSSRegulon Activity
∗The dot plots of a searched regulon are shown for all cell subpopulations in each disease state of each tissue based on the regulon specific score inferred using pySCENIC and by calculating the average expression.
Page: 1 

Top

Somatic mutation of malignant transformation related genes

check buttonAnnotation of somatic variants for genes involved in malignant transformation
Hugo SymbolVariant ClassVariant ClassificationdbSNP RSHGVScHGVSpHGVSp ShortSWISSPROTBIOTYPESIFTPolyPhenTumor Sample BarcodeTissueHistologySexAgeStageTherapy TypesDrugsOutcome
CCDC57SNVMissense_Mutationnovelc.678N>Cp.Glu226Aspp.E226DQ2TAC2protein_codingdeleterious(0.03)possibly_damaging(0.809)TCGA-3C-AALI-01Breastbreast invasive carcinomaFemale<65I/IIUnspecificPoly EComplete Response
CCDC57SNVMissense_Mutationnovelc.454N>Gp.Leu152Valp.L152VQ2TAC2protein_codingtolerated(0.07)possibly_damaging(0.519)TCGA-5L-AAT1-01Breastbreast invasive carcinomaFemale<65III/IVHormone TherapyletrozolSD
CCDC57SNVMissense_Mutationrs531085389c.1595N>Ap.Arg532Glnp.R532QQ2TAC2protein_codingdeleterious(0.02)probably_damaging(0.996)TCGA-AN-A046-01Breastbreast invasive carcinomaFemale>=65I/IIUnknownUnknownSD
CCDC57SNVMissense_Mutationrs755409077c.1600N>Ap.Ala534Thrp.A534TQ2TAC2protein_codingtolerated(0.1)benign(0.007)TCGA-AR-A251-01Breastbreast invasive carcinomaFemale<65III/IVChemotherapydoxorubicinSD
CCDC57SNVMissense_Mutationc.254N>Tp.Glu85Valp.E85VQ2TAC2protein_codingdeleterious(0)probably_damaging(0.992)TCGA-BH-A18S-01Breastbreast invasive carcinomaFemale>=65I/IIUnknownUnknownSD
CCDC57SNVMissense_Mutationc.1754A>Tp.Glu585Valp.E585VQ2TAC2protein_codingdeleterious(0)possibly_damaging(0.776)TCGA-E9-A1RB-01Breastbreast invasive carcinomaFemale<65I/IIChemotherapymethotrexateSD
CCDC57insertionIn_Frame_Insnovelc.1381_1382insAACTCCCGACCTCAGGTGATCTGCCCACCTCGGCCTp.Ala461delinsGluLeuProThrSerGlyAspLeuProThrSerAlaSerp.A461delinsELPTSGDLPTSASQ2TAC2protein_codingTCGA-A2-A04Y-01Breastbreast invasive carcinomaFemale<65I/IIChemotherapycytoxanSD
CCDC57deletionFrame_Shift_Delnovelc.845delAp.Lys282ArgfsTer21p.K282Rfs*21Q2TAC2protein_codingTCGA-EW-A2FV-01Breastbreast invasive carcinomaFemale<65III/IVChemotherapydocetaxelSD
CCDC57SNVMissense_Mutationrs866591635c.1024N>Ap.Ala342Thrp.A342TQ2TAC2protein_codingtolerated(0.35)benign(0.021)TCGA-2W-A8YY-01Cervixcervical & endocervical cancerFemale<65I/IIChemotherapycisplatinCR
CCDC57SNVMissense_Mutationnovelc.319C>Gp.Ile107Metp.I107Mprotein_codingdeleterious_low_confidence(0.01)benign(0.02)TCGA-EK-A3GN-01Cervixcervical & endocervical cancerFemale<65III/IVUnknownUnknownSD
Page: 1 2 3 4 5 6 7 8 

Top

Related drugs of malignant transformation related genes

check buttonIdentification of chemicals and drugs interact with genes involved in malignant transfromation
(DGIdb 4.0)
Entrez IDSymbolCategoryInteraction TypesDrug Claim NameDrug NamePMIDs
Page: 1