
|
|||||
|
 | |
| |
| |
| |
| |
| |
|
Gene: CCDC50 |
Gene summary for CCDC50 |
| Gene information | Species | Human | Gene symbol | CCDC50 | Gene ID | 152137 |
| Gene name | coiled-coil domain containing 50 | |
| Gene Alias | C3orf6 | |
| Cytomap | 3q28 | |
| Gene Type | protein-coding | GO ID | GO:0003008 | UniProtAcc | Q8IVM0 |
Top |
Malignant transformation analysis |
| Identification of the aberrant gene expression in precancerous and cancerous lesions by comparing the gene expression of stem-like cells in diseased tissues with normal stem cells |
| Entrez ID | Symbol | Replicates | Species | Organ | Tissue | Adj P-value | Log2FC | Malignancy |
| 152137 | CCDC50 | LZE4T | Human | Esophagus | ESCC | 3.62e-06 | 1.95e-01 | 0.0811 |
| 152137 | CCDC50 | LZE20T | Human | Esophagus | ESCC | 2.51e-05 | 8.63e-02 | 0.0662 |
| 152137 | CCDC50 | LZE24T | Human | Esophagus | ESCC | 9.45e-06 | 3.49e-01 | 0.0596 |
| 152137 | CCDC50 | P1T-E | Human | Esophagus | ESCC | 4.28e-11 | 4.43e-01 | 0.0875 |
| 152137 | CCDC50 | P2T-E | Human | Esophagus | ESCC | 9.89e-61 | 1.16e+00 | 0.1177 |
| 152137 | CCDC50 | P4T-E | Human | Esophagus | ESCC | 2.07e-22 | 7.06e-01 | 0.1323 |
| 152137 | CCDC50 | P5T-E | Human | Esophagus | ESCC | 1.48e-27 | 7.68e-01 | 0.1327 |
| 152137 | CCDC50 | P8T-E | Human | Esophagus | ESCC | 3.73e-34 | 6.36e-01 | 0.0889 |
| 152137 | CCDC50 | P9T-E | Human | Esophagus | ESCC | 8.26e-06 | 2.39e-01 | 0.1131 |
| 152137 | CCDC50 | P10T-E | Human | Esophagus | ESCC | 1.62e-25 | 4.52e-01 | 0.116 |
| 152137 | CCDC50 | P11T-E | Human | Esophagus | ESCC | 4.69e-13 | 5.31e-01 | 0.1426 |
| 152137 | CCDC50 | P12T-E | Human | Esophagus | ESCC | 2.10e-16 | 3.63e-01 | 0.1122 |
| 152137 | CCDC50 | P15T-E | Human | Esophagus | ESCC | 5.99e-10 | 2.49e-01 | 0.1149 |
| 152137 | CCDC50 | P16T-E | Human | Esophagus | ESCC | 3.63e-23 | 4.76e-01 | 0.1153 |
| 152137 | CCDC50 | P17T-E | Human | Esophagus | ESCC | 2.59e-04 | 2.98e-01 | 0.1278 |
| 152137 | CCDC50 | P19T-E | Human | Esophagus | ESCC | 3.30e-06 | 1.01e+00 | 0.1662 |
| 152137 | CCDC50 | P20T-E | Human | Esophagus | ESCC | 2.00e-11 | 2.93e-01 | 0.1124 |
| 152137 | CCDC50 | P21T-E | Human | Esophagus | ESCC | 3.71e-19 | 5.20e-01 | 0.1617 |
| 152137 | CCDC50 | P22T-E | Human | Esophagus | ESCC | 1.82e-45 | 7.87e-01 | 0.1236 |
| 152137 | CCDC50 | P23T-E | Human | Esophagus | ESCC | 6.72e-25 | 6.45e-01 | 0.108 |
| Page: 1 2 3 4 5 6 |
| Tissue | Expression Dynamics | Abbreviation |
| Esophagus |  | ESCC: Esophageal squamous cell carcinoma |
| HGIN: High-grade intraepithelial neoplasias | ||
| LGIN: Low-grade intraepithelial neoplasias | ||
| Liver | 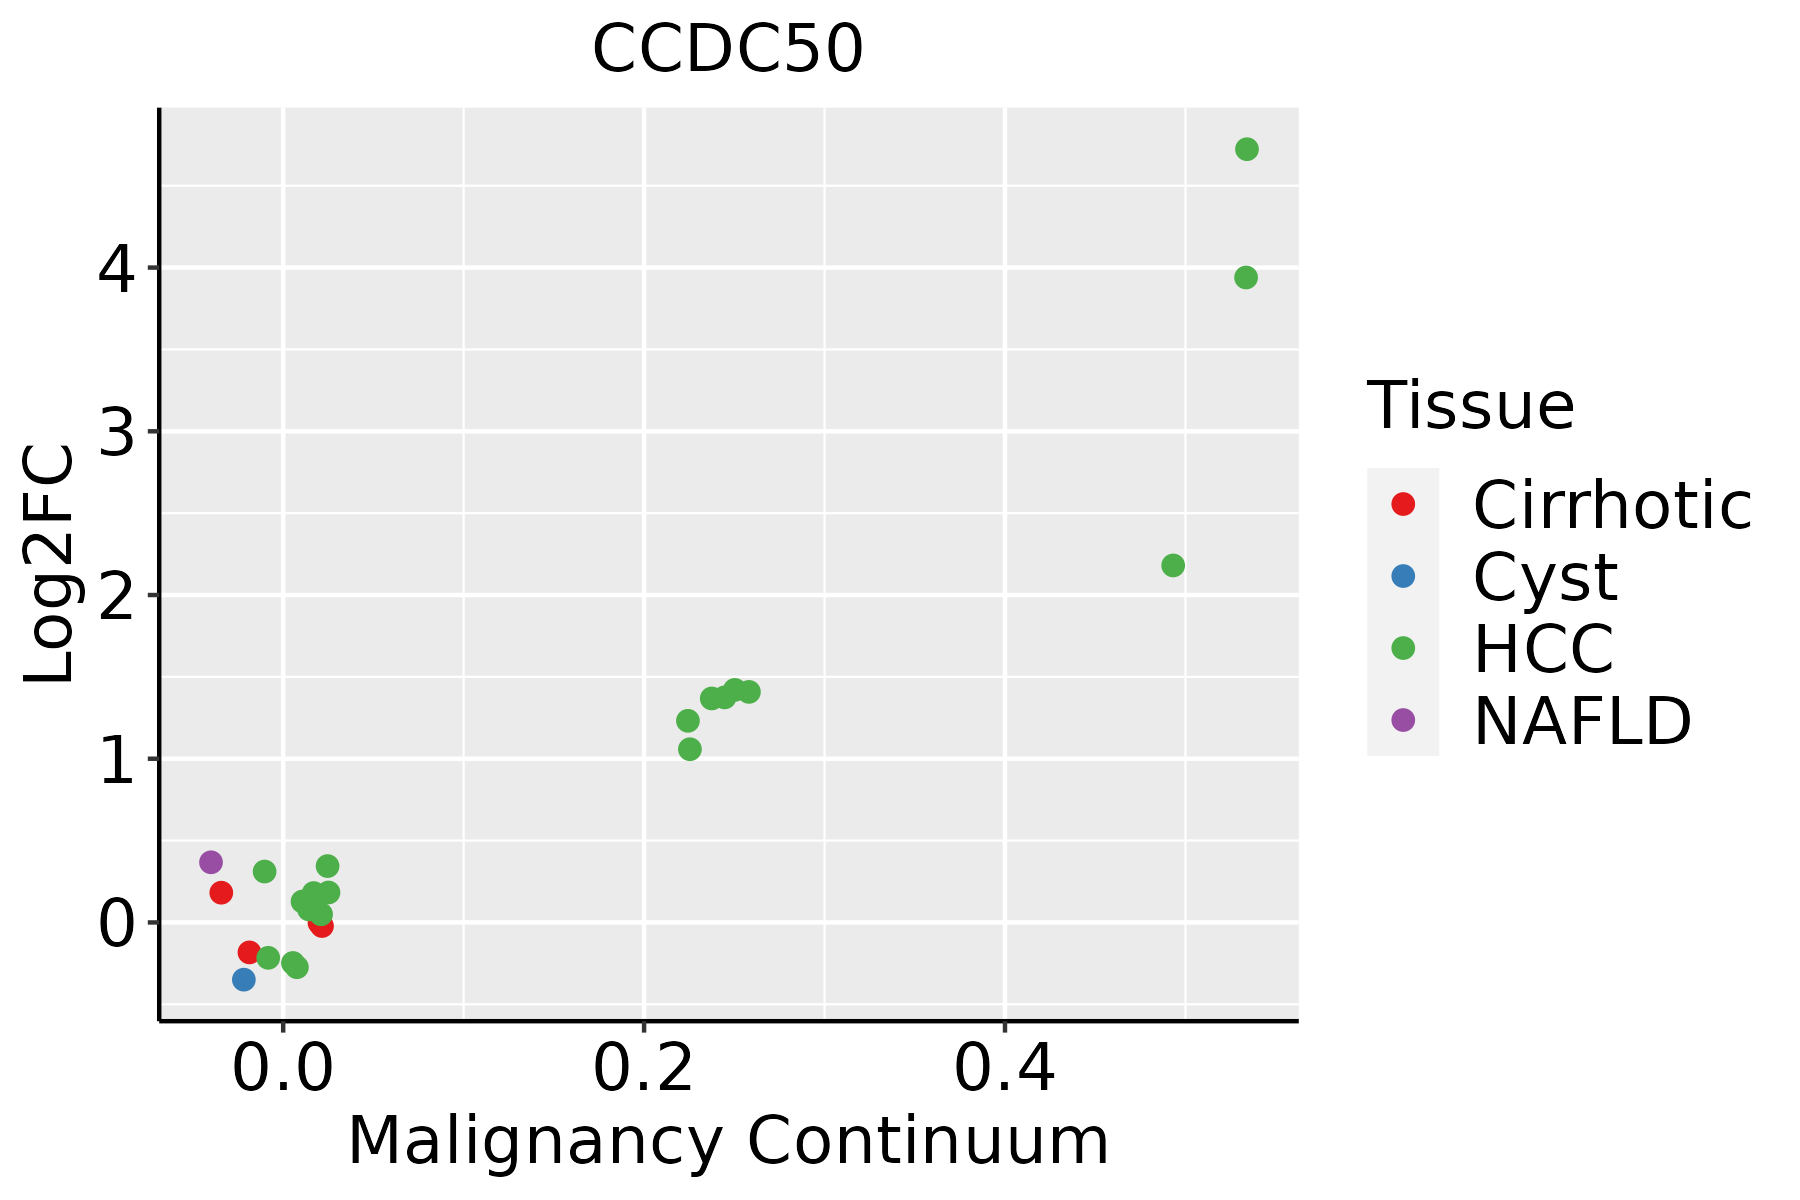 | HCC: Hepatocellular carcinoma |
| NAFLD: Non-alcoholic fatty liver disease | ||
| Oral Cavity |  | EOLP: Erosive Oral lichen planus |
| LP: leukoplakia | ||
| NEOLP: Non-erosive oral lichen planus | ||
| OSCC: Oral squamous cell carcinoma | ||
| Skin | 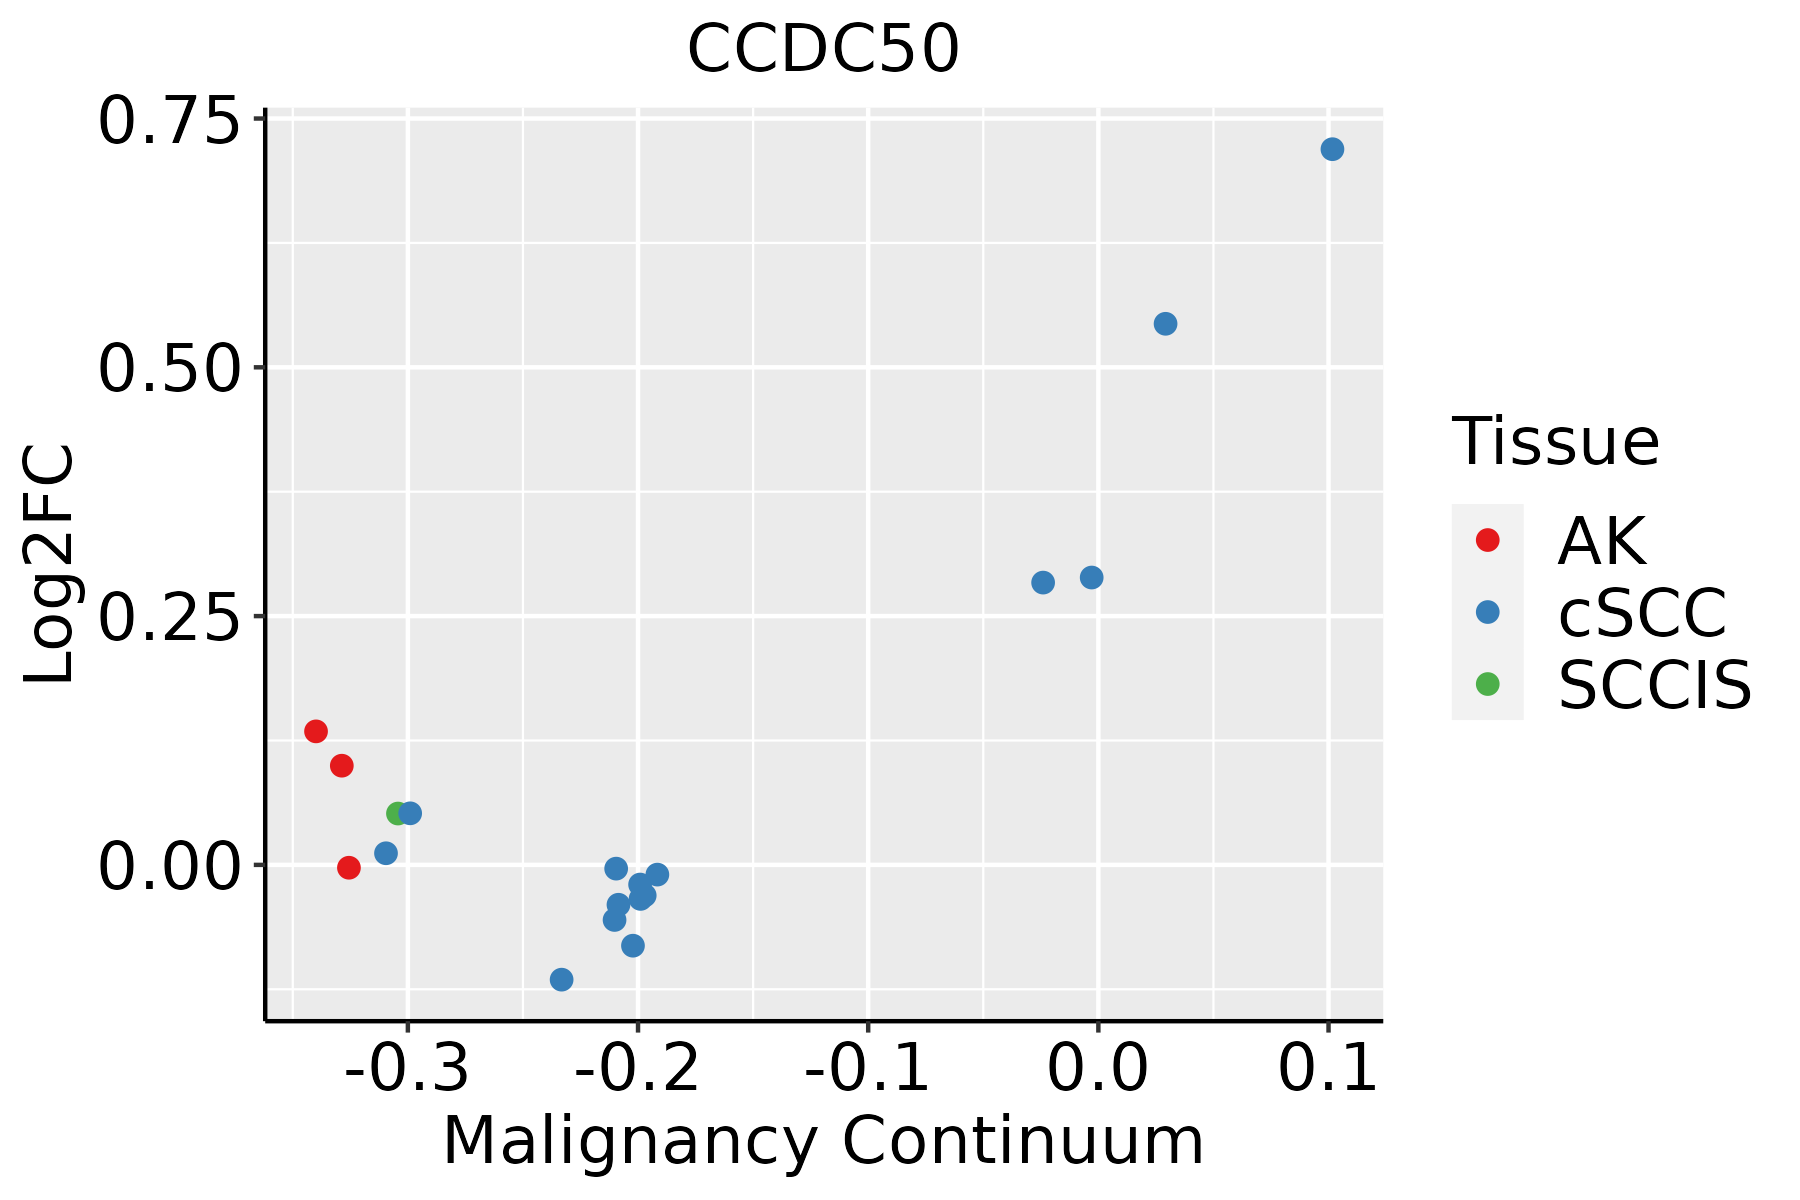 | AK: Actinic keratosis |
| cSCC: Cutaneous squamous cell carcinoma | ||
| SCCIS:squamous cell carcinoma in situ | ||
| Thyroid | 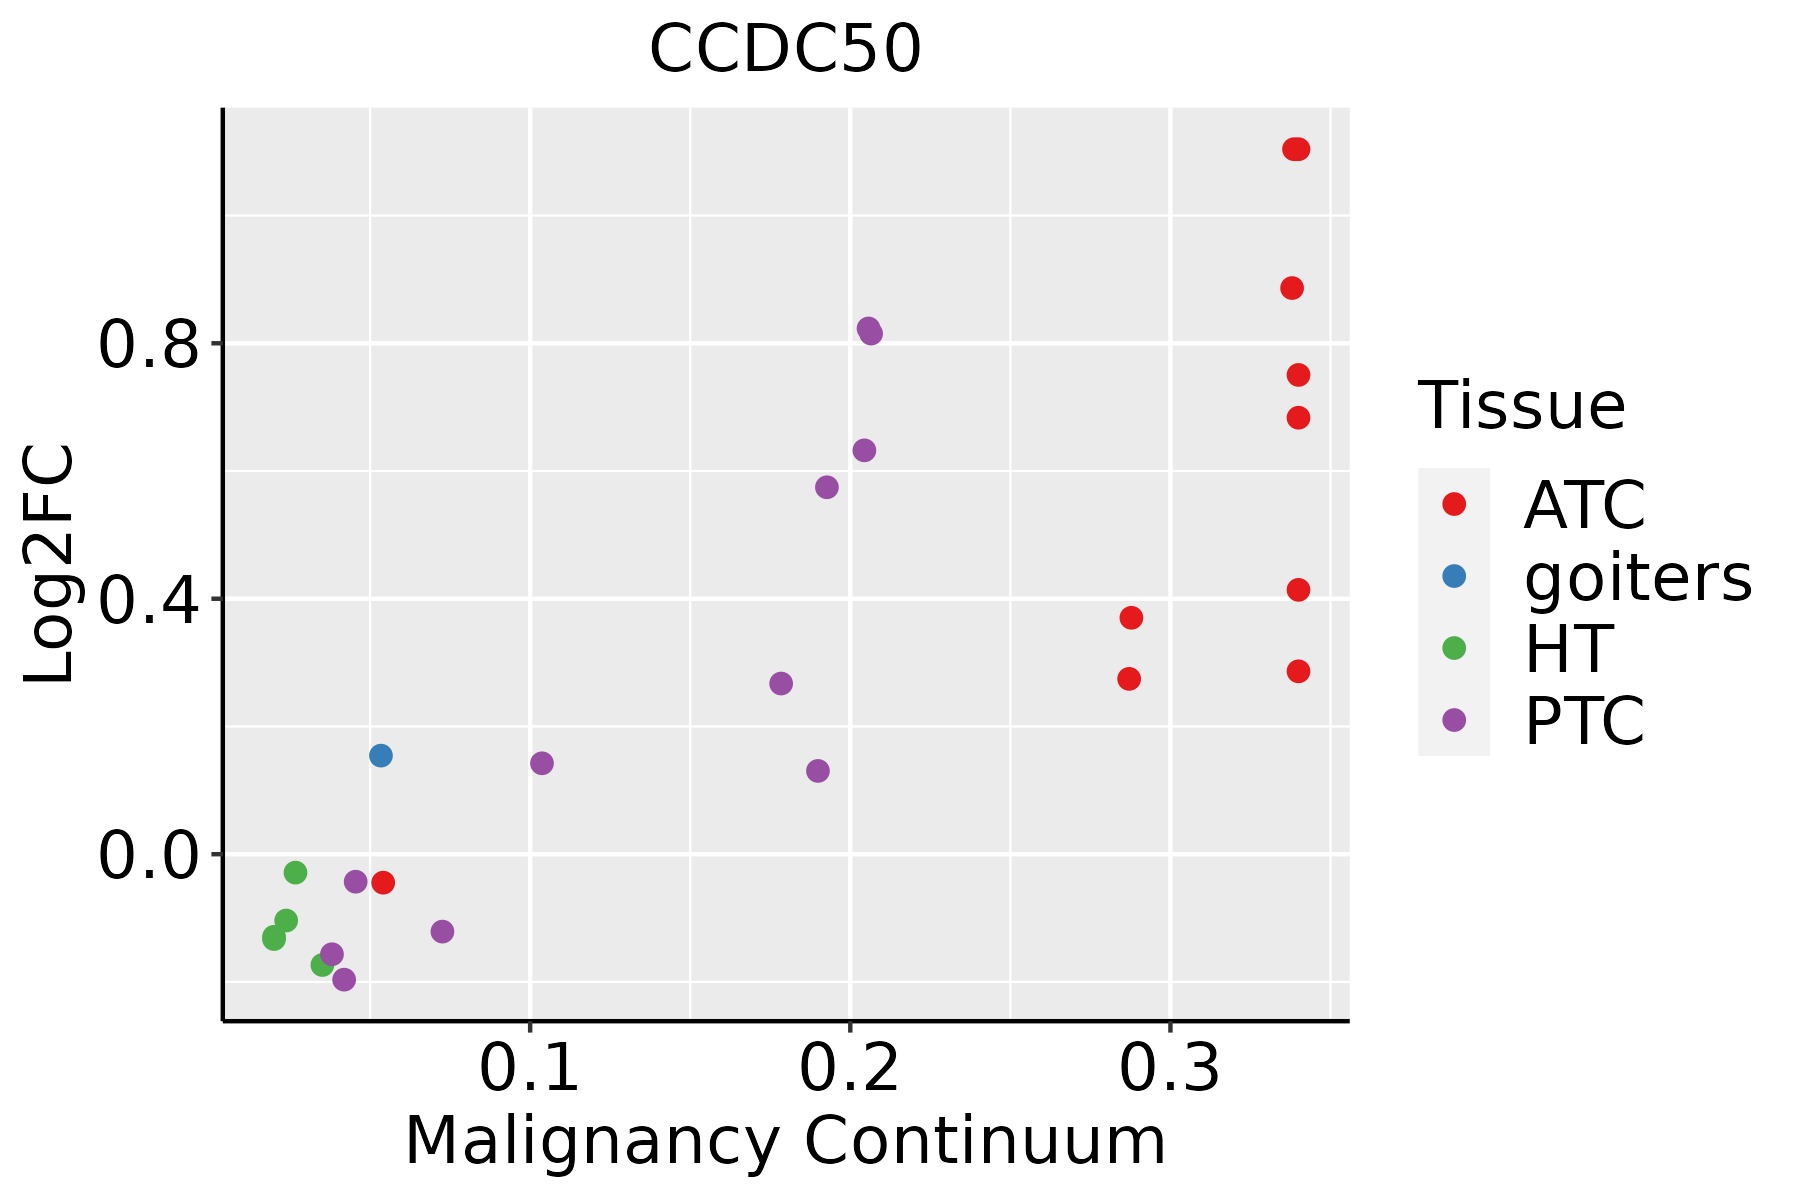 | ATC: Anaplastic thyroid cancer |
| HT: Hashimoto's thyroiditis | ||
| PTC: Papillary thyroid cancer |
| ∗log2FC in expression of this searched gene in stem-like cells from each diseased tissue sample relative to stem-like cells in normal samples in each tissue plotted against the malignancy continuum. Samples are colored based on if they are from different disease stage. |
Top |
Malignant transformation related pathway analysis |
| Find out the enriched GO biological processes and KEGG pathways involved in transition from healthy to precancer to cancer |
| Tissue | Disease Stage | Enriched GO biological Processes |
| Colorectum | AD |  |
| Colorectum | SER |  |
| Colorectum | MSS |  |
| Colorectum | MSI-H |  |
| Colorectum | FAP |  |
| ∗Top 15 enriched GO BP terms are showed in the bar plot of each disease state in each tissue. Each row represents a significant GO biological process which is colored according to the -log10(p.adjust). |
| Page: 1 2 3 4 5 6 7 8 9 |
| GO ID | Tissue | Disease Stage | Description | Gene Ratio | Bg Ratio | pvalue | p.adjust | Count |
| Page: 1 |
| Pathway ID | Tissue | Disease Stage | Description | Gene Ratio | Bg Ratio | pvalue | p.adjust | qvalue | Count |
| Page: 1 |
Top |
Cell-cell communication analysis |
| Identification of potential cell-cell interactions between two cell types and their ligand-receptor pairs for different disease states |
| Ligand | Receptor | LRpair | Pathway | Tissue | Disease Stage |
| Page: 1 |
Top |
Single-cell gene regulatory network inference analysis |
| Find out the significant the regulons (TFs) and the target genes of each regulon across cell types for different disease states |
| TF | Cell Type | Tissue | Disease Stage | Target Gene | RSS | Regulon Activity |
| ∗The dot plots of a searched regulon are shown for all cell subpopulations in each disease state of each tissue based on the regulon specific score inferred using pySCENIC and by calculating the average expression. |
| Page: 1 |
Top |
Somatic mutation of malignant transformation related genes |
| Annotation of somatic variants for genes involved in malignant transformation |
| Hugo Symbol | Variant Class | Variant Classification | dbSNP RS | HGVSc | HGVSp | HGVSp Short | SWISSPROT | BIOTYPE | SIFT | PolyPhen | Tumor Sample Barcode | Tissue | Histology | Sex | Age | Stage | Therapy Types | Drugs | Outcome |
| CCDC50 | SNV | Missense_Mutation | novel | c.778N>A | p.His260Asn | p.H260N | Q8IVM0 | protein_coding | tolerated(0.12) | benign(0.003) | TCGA-AC-A3QQ-01 | Breast | breast invasive carcinoma | Female | <65 | I/II | Unknown | Unknown | SD |
| CCDC50 | SNV | Missense_Mutation | c.431N>G | p.Tyr144Cys | p.Y144C | Q8IVM0 | protein_coding | tolerated(0.05) | benign(0.018) | TCGA-BH-A18G-01 | Breast | breast invasive carcinoma | Female | >=65 | I/II | Unknown | Unknown | SD | |
| CCDC50 | SNV | Missense_Mutation | novel | c.605N>A | p.Arg202Lys | p.R202K | Q8IVM0 | protein_coding | tolerated(0.62) | benign(0) | TCGA-BH-A6R8-01 | Breast | breast invasive carcinoma | Female | <65 | I/II | Unknown | Unknown | SD |
| CCDC50 | SNV | Missense_Mutation | c.843A>T | p.Gln281His | p.Q281H | Q8IVM0 | protein_coding | tolerated(0.31) | possibly_damaging(0.471) | TCGA-E2-A15S-01 | Breast | breast invasive carcinoma | Female | <65 | I/II | Chemotherapy | doxorubicin | SD | |
| CCDC50 | SNV | Missense_Mutation | rs761262340 | c.1042N>A | p.Glu348Lys | p.E348K | Q8IVM0 | protein_coding | deleterious(0.02) | probably_damaging(0.996) | TCGA-E9-A1NA-01 | Breast | breast invasive carcinoma | Female | <65 | I/II | Chemotherapy | cyclophosphamide | SD |
| CCDC50 | SNV | Missense_Mutation | c.23A>T | p.Gln8Leu | p.Q8L | Q8IVM0 | protein_coding | deleterious(0.02) | benign(0.279) | TCGA-E9-A24A-01 | Breast | breast invasive carcinoma | Female | >=65 | I/II | Hormone Therapy | tamoxiphen | SD | |
| CCDC50 | insertion | In_Frame_Ins | novel | c.779_780insTGT | p.His260_Gln261insVal | p.H260_Q261insV | Q8IVM0 | protein_coding | TCGA-AC-A3QQ-01 | Breast | breast invasive carcinoma | Female | <65 | I/II | Unknown | Unknown | SD | ||
| CCDC50 | insertion | Frame_Shift_Ins | novel | c.749_750insATATGAGCATCCAGCTTGTTTCTGCATAG | p.Cys251TyrfsTer87 | p.C251Yfs*87 | Q8IVM0 | protein_coding | TCGA-B6-A0IK-01 | Breast | breast invasive carcinoma | Female | <65 | III/IV | Unknown | Unknown | PD | ||
| CCDC50 | insertion | Frame_Shift_Ins | novel | c.1067_1068insA | p.Leu358ThrfsTer22 | p.L358Tfs*22 | Q8IVM0 | protein_coding | TCGA-LL-A73Y-01 | Breast | breast invasive carcinoma | Female | >=65 | I/II | Chemotherapy | taxotere | SD | ||
| CCDC50 | SNV | Missense_Mutation | novel | c.576A>C | p.Glu192Asp | p.E192D | Q8IVM0 | protein_coding | tolerated(0.24) | benign(0.006) | TCGA-2W-A8YY-01 | Cervix | cervical & endocervical cancer | Female | <65 | I/II | Chemotherapy | cisplatin | CR |
| Page: 1 2 3 4 5 6 7 8 |
Top |
Related drugs of malignant transformation related genes |
| Identification of chemicals and drugs interact with genes involved in malignant transfromation |
| (DGIdb 4.0) |
| Entrez ID | Symbol | Category | Interaction Types | Drug Claim Name | Drug Name | PMIDs |
| Page: 1 |

Copyright 2023-Present -The University of Texas Health Science Center at Houston |