
|
|||||
|
 | |
| |
| |
| |
| |
| |
|
Gene: CCDC3 |
Gene summary for CCDC3 |
| Gene information | Species | Human | Gene symbol | CCDC3 | Gene ID | 83643 |
| Gene name | coiled-coil domain containing 3 | |
| Gene Alias | CCDC3 | |
| Cytomap | 10p13 | |
| Gene Type | protein-coding | GO ID | GO:0001959 | UniProtAcc | Q9BQI4 |
Top |
Malignant transformation analysis |
| Identification of the aberrant gene expression in precancerous and cancerous lesions by comparing the gene expression of stem-like cells in diseased tissues with normal stem cells |
| Entrez ID | Symbol | Replicates | Species | Organ | Tissue | Adj P-value | Log2FC | Malignancy |
| 83643 | CCDC3 | P2T-E | Human | Esophagus | ESCC | 4.03e-04 | 1.86e-01 | 0.1177 |
| 83643 | CCDC3 | P4T-E | Human | Esophagus | ESCC | 2.21e-07 | 2.11e-01 | 0.1323 |
| 83643 | CCDC3 | P12T-E | Human | Esophagus | ESCC | 4.61e-27 | 8.27e-01 | 0.1122 |
| 83643 | CCDC3 | P15T-E | Human | Esophagus | ESCC | 3.88e-04 | 1.44e-01 | 0.1149 |
| 83643 | CCDC3 | P21T-E | Human | Esophagus | ESCC | 2.75e-30 | 8.11e-01 | 0.1617 |
| 83643 | CCDC3 | P22T-E | Human | Esophagus | ESCC | 1.50e-07 | 8.42e-02 | 0.1236 |
| 83643 | CCDC3 | P27T-E | Human | Esophagus | ESCC | 6.35e-13 | 3.62e-01 | 0.1055 |
| 83643 | CCDC3 | P28T-E | Human | Esophagus | ESCC | 3.21e-04 | 7.33e-02 | 0.1149 |
| 83643 | CCDC3 | P30T-E | Human | Esophagus | ESCC | 4.18e-02 | 2.50e-01 | 0.137 |
| 83643 | CCDC3 | P31T-E | Human | Esophagus | ESCC | 1.80e-14 | 3.95e-01 | 0.1251 |
| 83643 | CCDC3 | P32T-E | Human | Esophagus | ESCC | 5.07e-03 | 2.16e-01 | 0.1666 |
| 83643 | CCDC3 | P37T-E | Human | Esophagus | ESCC | 1.68e-12 | 3.30e-01 | 0.1371 |
| 83643 | CCDC3 | P40T-E | Human | Esophagus | ESCC | 7.55e-06 | 2.59e-01 | 0.109 |
| 83643 | CCDC3 | P42T-E | Human | Esophagus | ESCC | 1.76e-02 | 1.21e-01 | 0.1175 |
| 83643 | CCDC3 | P52T-E | Human | Esophagus | ESCC | 5.91e-07 | 1.54e-01 | 0.1555 |
| 83643 | CCDC3 | P65T-E | Human | Esophagus | ESCC | 1.71e-03 | 6.94e-02 | 0.0978 |
| 83643 | CCDC3 | P74T-E | Human | Esophagus | ESCC | 1.64e-07 | 2.45e-01 | 0.1479 |
| 83643 | CCDC3 | P79T-E | Human | Esophagus | ESCC | 4.04e-02 | 1.32e-02 | 0.1154 |
| 83643 | CCDC3 | P83T-E | Human | Esophagus | ESCC | 1.79e-20 | 6.64e-01 | 0.1738 |
| 83643 | CCDC3 | P91T-E | Human | Esophagus | ESCC | 8.27e-05 | 5.88e-01 | 0.1828 |
| Page: 1 2 3 |
| Tissue | Expression Dynamics | Abbreviation |
| Esophagus | 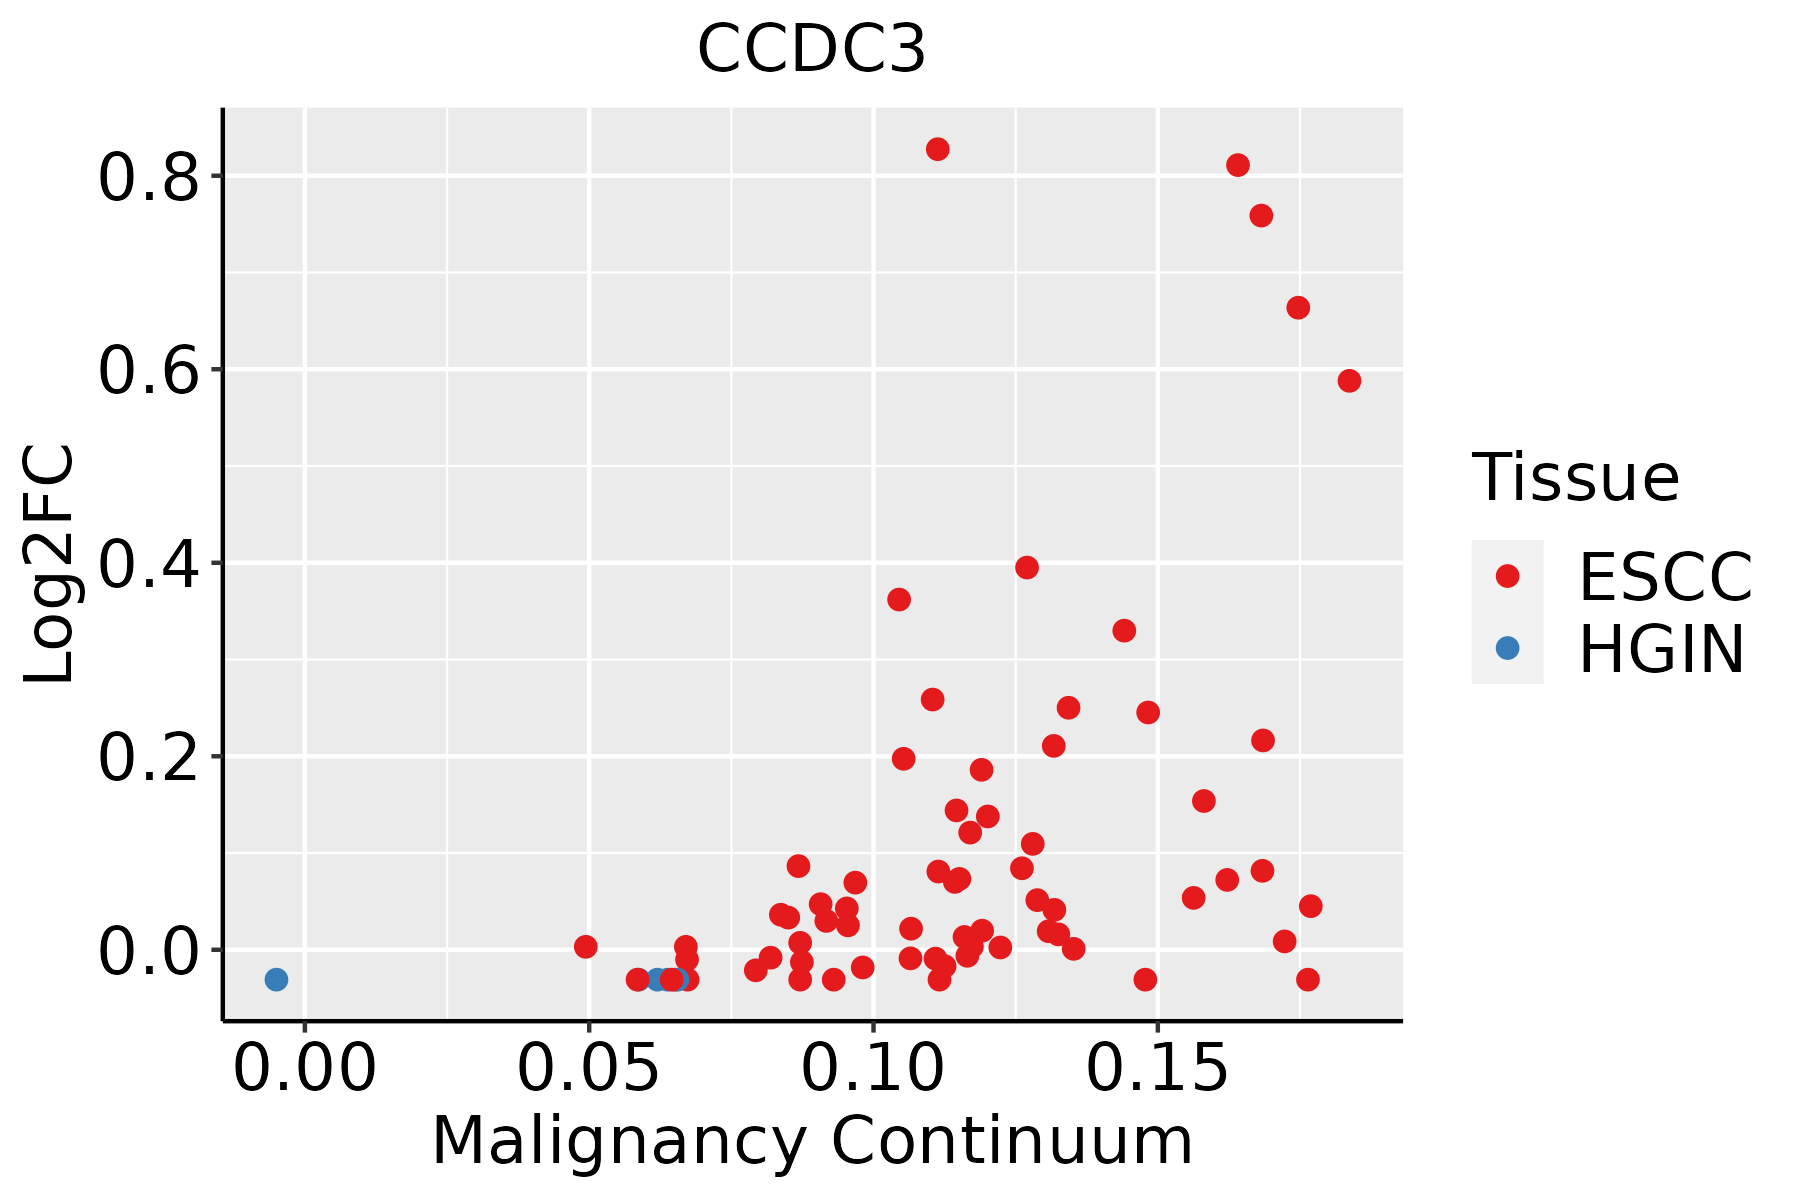 | ESCC: Esophageal squamous cell carcinoma |
| HGIN: High-grade intraepithelial neoplasias | ||
| LGIN: Low-grade intraepithelial neoplasias | ||
| Oral Cavity | 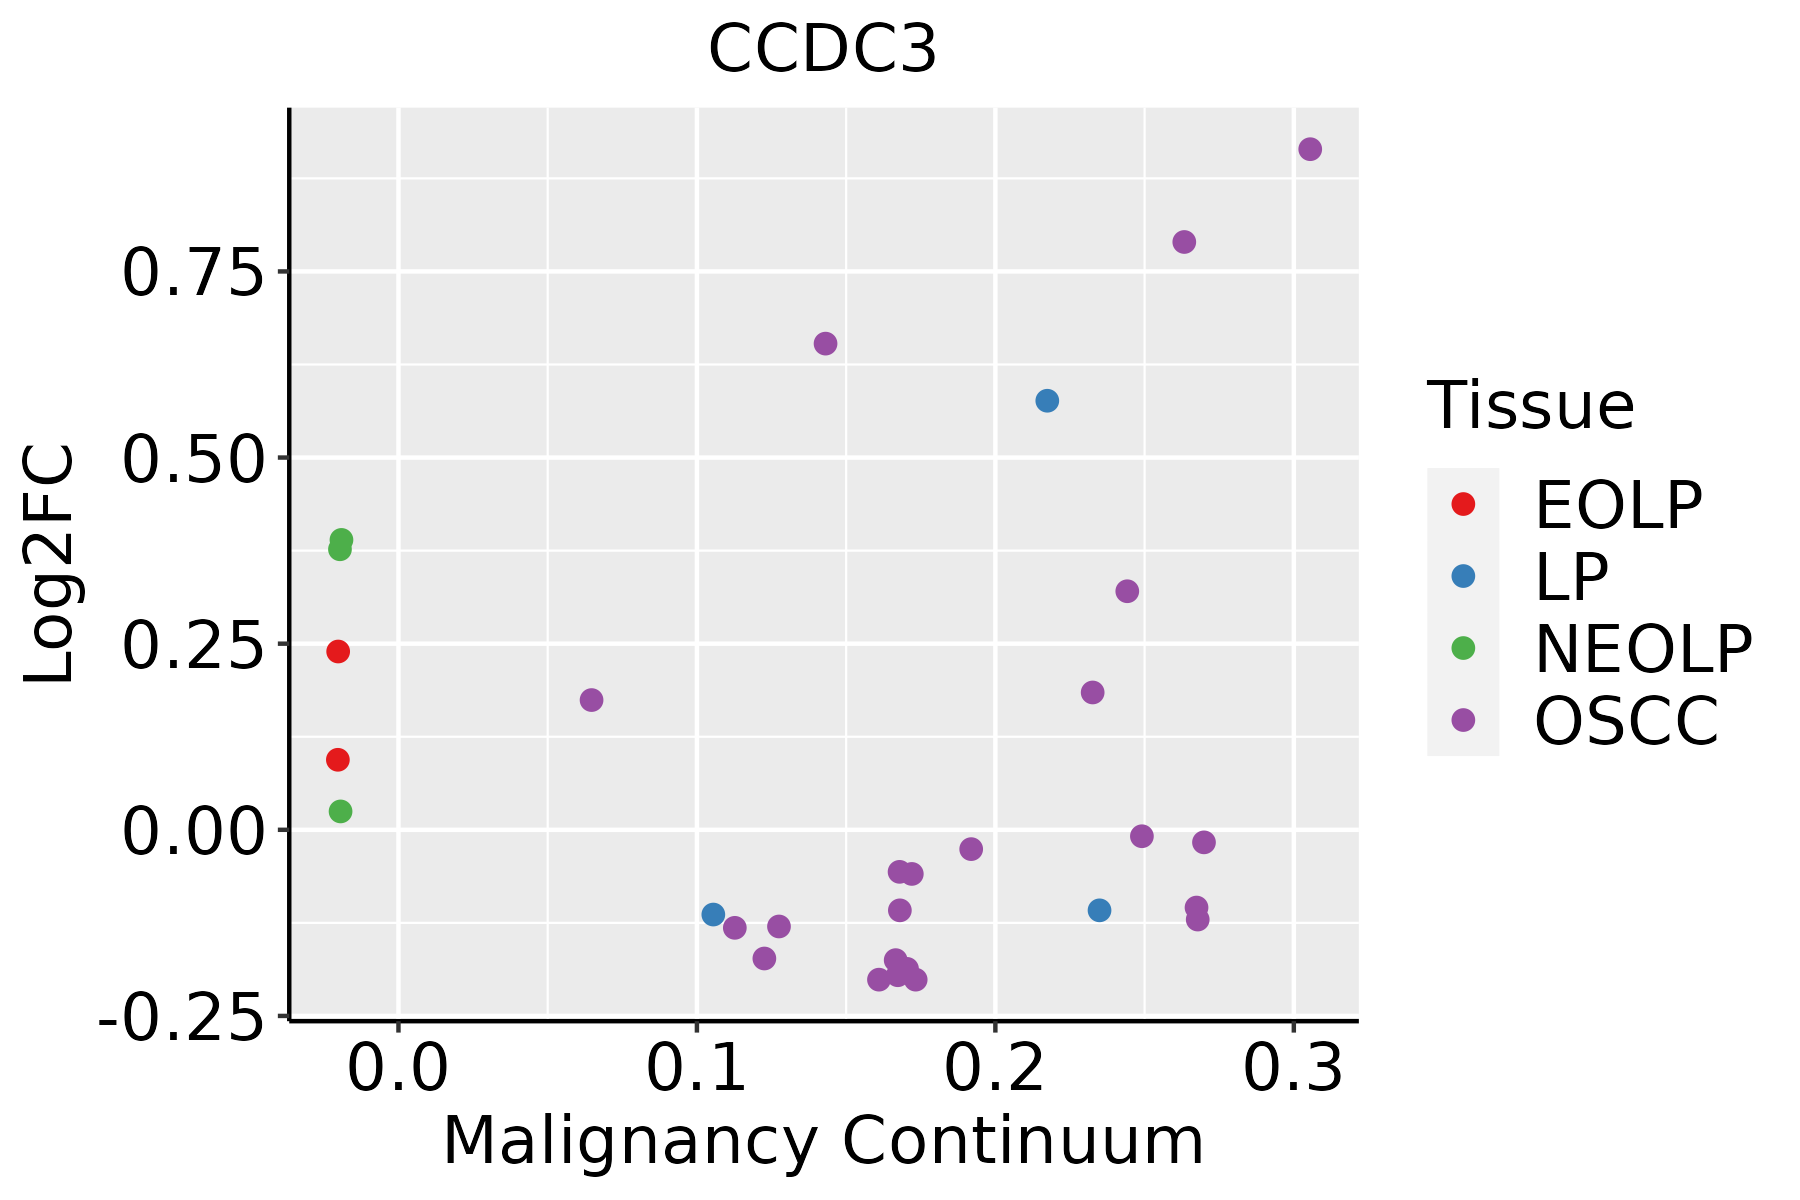 | EOLP: Erosive Oral lichen planus |
| LP: leukoplakia | ||
| NEOLP: Non-erosive oral lichen planus | ||
| OSCC: Oral squamous cell carcinoma | ||
| Skin | 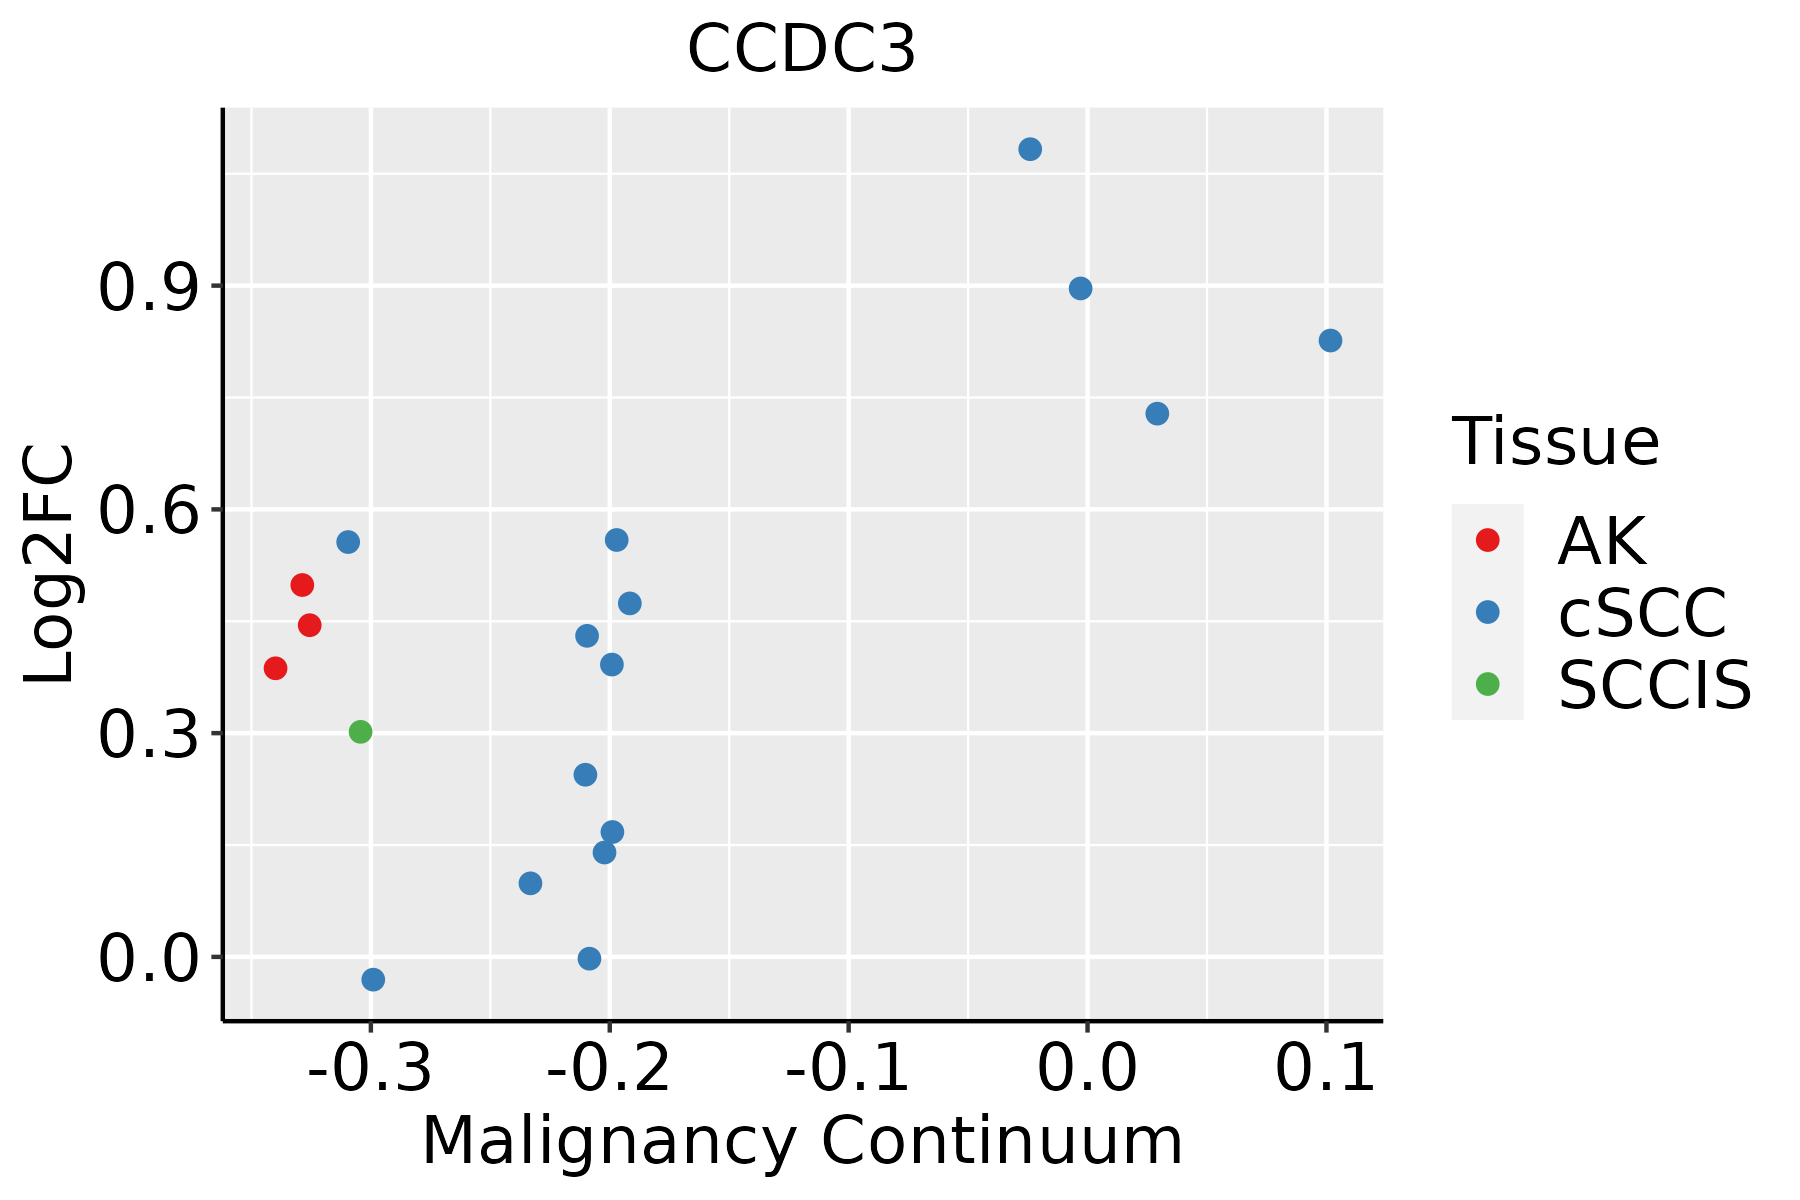 | AK: Actinic keratosis |
| cSCC: Cutaneous squamous cell carcinoma | ||
| SCCIS:squamous cell carcinoma in situ |
| ∗log2FC in expression of this searched gene in stem-like cells from each diseased tissue sample relative to stem-like cells in normal samples in each tissue plotted against the malignancy continuum. Samples are colored based on if they are from different disease stage. |
Top |
Malignant transformation related pathway analysis |
| Find out the enriched GO biological processes and KEGG pathways involved in transition from healthy to precancer to cancer |
| Tissue | Disease Stage | Enriched GO biological Processes |
| Colorectum | AD |  |
| Colorectum | SER |  |
| Colorectum | MSS |  |
| Colorectum | MSI-H |  |
| Colorectum | FAP |  |
| ∗Top 15 enriched GO BP terms are showed in the bar plot of each disease state in each tissue. Each row represents a significant GO biological process which is colored according to the -log10(p.adjust). |
| Page: 1 2 3 4 5 6 7 8 9 |
| GO ID | Tissue | Disease Stage | Description | Gene Ratio | Bg Ratio | pvalue | p.adjust | Count |
| GO:00607595 | Esophagus | ESCC | regulation of response to cytokine stimulus | 103/8552 | 162/18723 | 3.14e-06 | 3.53e-05 | 103 |
| GO:003320914 | Esophagus | ESCC | tumor necrosis factor-mediated signaling pathway | 67/8552 | 99/18723 | 7.87e-06 | 7.72e-05 | 67 |
| GO:00019595 | Esophagus | ESCC | regulation of cytokine-mediated signaling pathway | 95/8552 | 150/18723 | 9.48e-06 | 9.04e-05 | 95 |
| GO:003461220 | Esophagus | ESCC | response to tumor necrosis factor | 149/8552 | 253/18723 | 1.47e-05 | 1.33e-04 | 149 |
| GO:00454449 | Esophagus | ESCC | fat cell differentiation | 135/8552 | 229/18723 | 3.38e-05 | 2.78e-04 | 135 |
| GO:00456007 | Esophagus | ESCC | positive regulation of fat cell differentiation | 46/8552 | 66/18723 | 6.72e-05 | 5.11e-04 | 46 |
| GO:007135620 | Esophagus | ESCC | cellular response to tumor necrosis factor | 132/8552 | 229/18723 | 1.69e-04 | 1.11e-03 | 132 |
| GO:00108033 | Esophagus | ESCC | regulation of tumor necrosis factor-mediated signaling pathway | 31/8552 | 47/18723 | 4.01e-03 | 1.62e-02 | 31 |
| GO:00455984 | Esophagus | ESCC | regulation of fat cell differentiation | 79/8552 | 139/18723 | 5.23e-03 | 1.97e-02 | 79 |
| GO:00192168 | Esophagus | ESCC | regulation of lipid metabolic process | 172/8552 | 331/18723 | 1.20e-02 | 4.02e-02 | 172 |
| GO:003461218 | Oral cavity | OSCC | response to tumor necrosis factor | 143/7305 | 253/18723 | 1.09e-08 | 2.23e-07 | 143 |
| GO:007135618 | Oral cavity | OSCC | cellular response to tumor necrosis factor | 128/7305 | 229/18723 | 1.49e-07 | 2.49e-06 | 128 |
| GO:00019594 | Oral cavity | OSCC | regulation of cytokine-mediated signaling pathway | 87/7305 | 150/18723 | 1.82e-06 | 2.35e-05 | 87 |
| GO:00607594 | Oral cavity | OSCC | regulation of response to cytokine stimulus | 92/7305 | 162/18723 | 3.25e-06 | 3.90e-05 | 92 |
| GO:00332099 | Oral cavity | OSCC | tumor necrosis factor-mediated signaling pathway | 61/7305 | 99/18723 | 4.31e-06 | 4.98e-05 | 61 |
| GO:00454448 | Oral cavity | OSCC | fat cell differentiation | 120/7305 | 229/18723 | 2.48e-05 | 2.32e-04 | 120 |
| GO:00455983 | Oral cavity | OSCC | regulation of fat cell differentiation | 77/7305 | 139/18723 | 6.36e-05 | 5.18e-04 | 77 |
| GO:00456006 | Oral cavity | OSCC | positive regulation of fat cell differentiation | 41/7305 | 66/18723 | 1.20e-04 | 8.60e-04 | 41 |
| GO:00192214 | Oral cavity | OSCC | cytokine-mediated signaling pathway | 222/7305 | 472/18723 | 2.02e-04 | 1.35e-03 | 222 |
| GO:00468906 | Oral cavity | OSCC | regulation of lipid biosynthetic process | 85/7305 | 171/18723 | 2.79e-03 | 1.21e-02 | 85 |
| Page: 1 2 3 |
| Pathway ID | Tissue | Disease Stage | Description | Gene Ratio | Bg Ratio | pvalue | p.adjust | qvalue | Count |
| Page: 1 |
Top |
Cell-cell communication analysis |
| Identification of potential cell-cell interactions between two cell types and their ligand-receptor pairs for different disease states |
| Ligand | Receptor | LRpair | Pathway | Tissue | Disease Stage |
| Page: 1 |
Top |
Single-cell gene regulatory network inference analysis |
| Find out the significant the regulons (TFs) and the target genes of each regulon across cell types for different disease states |
| TF | Cell Type | Tissue | Disease Stage | Target Gene | RSS | Regulon Activity |
| ∗The dot plots of a searched regulon are shown for all cell subpopulations in each disease state of each tissue based on the regulon specific score inferred using pySCENIC and by calculating the average expression. |
| Page: 1 |
Top |
Somatic mutation of malignant transformation related genes |
| Annotation of somatic variants for genes involved in malignant transformation |
| Hugo Symbol | Variant Class | Variant Classification | dbSNP RS | HGVSc | HGVSp | HGVSp Short | SWISSPROT | BIOTYPE | SIFT | PolyPhen | Tumor Sample Barcode | Tissue | Histology | Sex | Age | Stage | Therapy Types | Drugs | Outcome |
| CCDC3 | SNV | Missense_Mutation | novel | c.418N>A | p.Gln140Lys | p.Q140K | Q9BQI4 | protein_coding | deleterious(0) | probably_damaging(0.968) | TCGA-AN-A046-01 | Breast | breast invasive carcinoma | Female | >=65 | I/II | Unknown | Unknown | SD |
| CCDC3 | SNV | Missense_Mutation | rs772617089 | c.757N>A | p.Ala253Thr | p.A253T | Q9BQI4 | protein_coding | tolerated_low_confidence(0.2) | benign(0.034) | TCGA-BH-A0HW-01 | Breast | breast invasive carcinoma | Female | <65 | I/II | Chemotherapy | doxorubicin | SD |
| CCDC3 | SNV | Missense_Mutation | novel | c.184N>A | p.Leu62Met | p.L62M | Q9BQI4 | protein_coding | deleterious_low_confidence(0.01) | benign(0.241) | TCGA-EW-A3U0-01 | Breast | breast invasive carcinoma | Female | <65 | III/IV | Chemotherapy | cisplatin | CR |
| CCDC3 | SNV | Missense_Mutation | rs368910799 | c.758C>T | p.Ala253Val | p.A253V | Q9BQI4 | protein_coding | tolerated_low_confidence(0.11) | benign(0.202) | TCGA-EK-A3GK-01 | Cervix | cervical & endocervical cancer | Female | <65 | I/II | Unknown | Unknown | SD |
| CCDC3 | SNV | Missense_Mutation | novel | c.741N>T | p.Glu247Asp | p.E247D | Q9BQI4 | protein_coding | deleterious_low_confidence(0.01) | benign(0.068) | TCGA-AA-A00N-01 | Colorectum | colon adenocarcinoma | Male | >=65 | I/II | Unknown | Unknown | PD |
| CCDC3 | SNV | Missense_Mutation | rs754059035 | c.778N>T | p.Arg260Trp | p.R260W | Q9BQI4 | protein_coding | tolerated_low_confidence(0.14) | benign(0.006) | TCGA-CM-6678-01 | Colorectum | colon adenocarcinoma | Female | <65 | I/II | Chemotherapy | fluorouracil | SD |
| CCDC3 | SNV | Missense_Mutation | rs754059035 | c.778N>T | p.Arg260Trp | p.R260W | Q9BQI4 | protein_coding | tolerated_low_confidence(0.14) | benign(0.006) | TCGA-CM-6680-01 | Colorectum | colon adenocarcinoma | Female | >=65 | III/IV | Unknown | Unknown | SD |
| CCDC3 | SNV | Missense_Mutation | rs756883939 | c.736N>G | p.Ser246Gly | p.S246G | Q9BQI4 | protein_coding | tolerated_low_confidence(0.27) | benign(0) | TCGA-G4-6628-01 | Colorectum | colon adenocarcinoma | Male | >=65 | I/II | Unknown | Unknown | SD |
| CCDC3 | SNV | Missense_Mutation | c.790N>T | p.Arg264Cys | p.R264C | Q9BQI4 | protein_coding | deleterious_low_confidence(0.03) | benign(0.241) | TCGA-QG-A5YX-01 | Colorectum | colon adenocarcinoma | Female | <65 | I/II | Chemotherapy | xeloda | CR | |
| CCDC3 | SNV | Missense_Mutation | rs759482623 | c.491N>T | p.Ser164Leu | p.S164L | Q9BQI4 | protein_coding | deleterious_low_confidence(0) | benign(0.371) | TCGA-AG-3892-01 | Colorectum | rectum adenocarcinoma | Female | <65 | I/II | Unknown | Unknown | SD |
| Page: 1 2 3 4 |
Top |
Related drugs of malignant transformation related genes |
| Identification of chemicals and drugs interact with genes involved in malignant transfromation |
| (DGIdb 4.0) |
| Entrez ID | Symbol | Category | Interaction Types | Drug Claim Name | Drug Name | PMIDs |
| Page: 1 |

Copyright 2023-Present -The University of Texas Health Science Center at Houston |