
|
|||||
|
 | |
| |
| |
| |
| |
| |
|
Gene: CCDC28B |
Gene summary for CCDC28B |
| Gene information | Species | Human | Gene symbol | CCDC28B | Gene ID | 79140 |
| Gene name | coiled-coil domain containing 28B | |
| Gene Alias | CCDC28B | |
| Cytomap | 1p35.2 | |
| Gene Type | protein-coding | GO ID | GO:0006996 | UniProtAcc | Q9BUN5 |
Top |
Malignant transformation analysis |
| Identification of the aberrant gene expression in precancerous and cancerous lesions by comparing the gene expression of stem-like cells in diseased tissues with normal stem cells |
| Entrez ID | Symbol | Replicates | Species | Organ | Tissue | Adj P-value | Log2FC | Malignancy |
| 79140 | CCDC28B | P2T-E | Human | Esophagus | ESCC | 9.75e-24 | 4.99e-01 | 0.1177 |
| 79140 | CCDC28B | P4T-E | Human | Esophagus | ESCC | 6.08e-18 | 3.95e-01 | 0.1323 |
| 79140 | CCDC28B | P5T-E | Human | Esophagus | ESCC | 2.15e-06 | 1.32e-01 | 0.1327 |
| 79140 | CCDC28B | P9T-E | Human | Esophagus | ESCC | 1.88e-04 | 8.65e-02 | 0.1131 |
| 79140 | CCDC28B | P10T-E | Human | Esophagus | ESCC | 9.35e-10 | 2.02e-01 | 0.116 |
| 79140 | CCDC28B | P16T-E | Human | Esophagus | ESCC | 1.23e-20 | 3.52e-01 | 0.1153 |
| 79140 | CCDC28B | P17T-E | Human | Esophagus | ESCC | 1.77e-05 | 1.92e-01 | 0.1278 |
| 79140 | CCDC28B | P19T-E | Human | Esophagus | ESCC | 1.12e-04 | 3.31e-01 | 0.1662 |
| 79140 | CCDC28B | P21T-E | Human | Esophagus | ESCC | 1.13e-16 | 3.26e-01 | 0.1617 |
| 79140 | CCDC28B | P23T-E | Human | Esophagus | ESCC | 1.91e-06 | 1.92e-01 | 0.108 |
| 79140 | CCDC28B | P24T-E | Human | Esophagus | ESCC | 7.65e-06 | 1.61e-01 | 0.1287 |
| 79140 | CCDC28B | P26T-E | Human | Esophagus | ESCC | 1.24e-08 | 2.38e-01 | 0.1276 |
| 79140 | CCDC28B | P27T-E | Human | Esophagus | ESCC | 7.31e-14 | 2.70e-01 | 0.1055 |
| 79140 | CCDC28B | P31T-E | Human | Esophagus | ESCC | 6.93e-09 | 1.69e-01 | 0.1251 |
| 79140 | CCDC28B | P32T-E | Human | Esophagus | ESCC | 6.59e-08 | 2.04e-01 | 0.1666 |
| 79140 | CCDC28B | P36T-E | Human | Esophagus | ESCC | 8.66e-03 | 1.44e-01 | 0.1187 |
| 79140 | CCDC28B | P37T-E | Human | Esophagus | ESCC | 5.17e-08 | 2.47e-01 | 0.1371 |
| 79140 | CCDC28B | P40T-E | Human | Esophagus | ESCC | 7.38e-05 | 1.98e-01 | 0.109 |
| 79140 | CCDC28B | P42T-E | Human | Esophagus | ESCC | 6.65e-06 | 2.04e-01 | 0.1175 |
| 79140 | CCDC28B | P48T-E | Human | Esophagus | ESCC | 3.75e-03 | 7.02e-02 | 0.0959 |
| Page: 1 2 3 4 |
| Tissue | Expression Dynamics | Abbreviation |
| Esophagus |  | ESCC: Esophageal squamous cell carcinoma |
| HGIN: High-grade intraepithelial neoplasias | ||
| LGIN: Low-grade intraepithelial neoplasias | ||
| Liver | 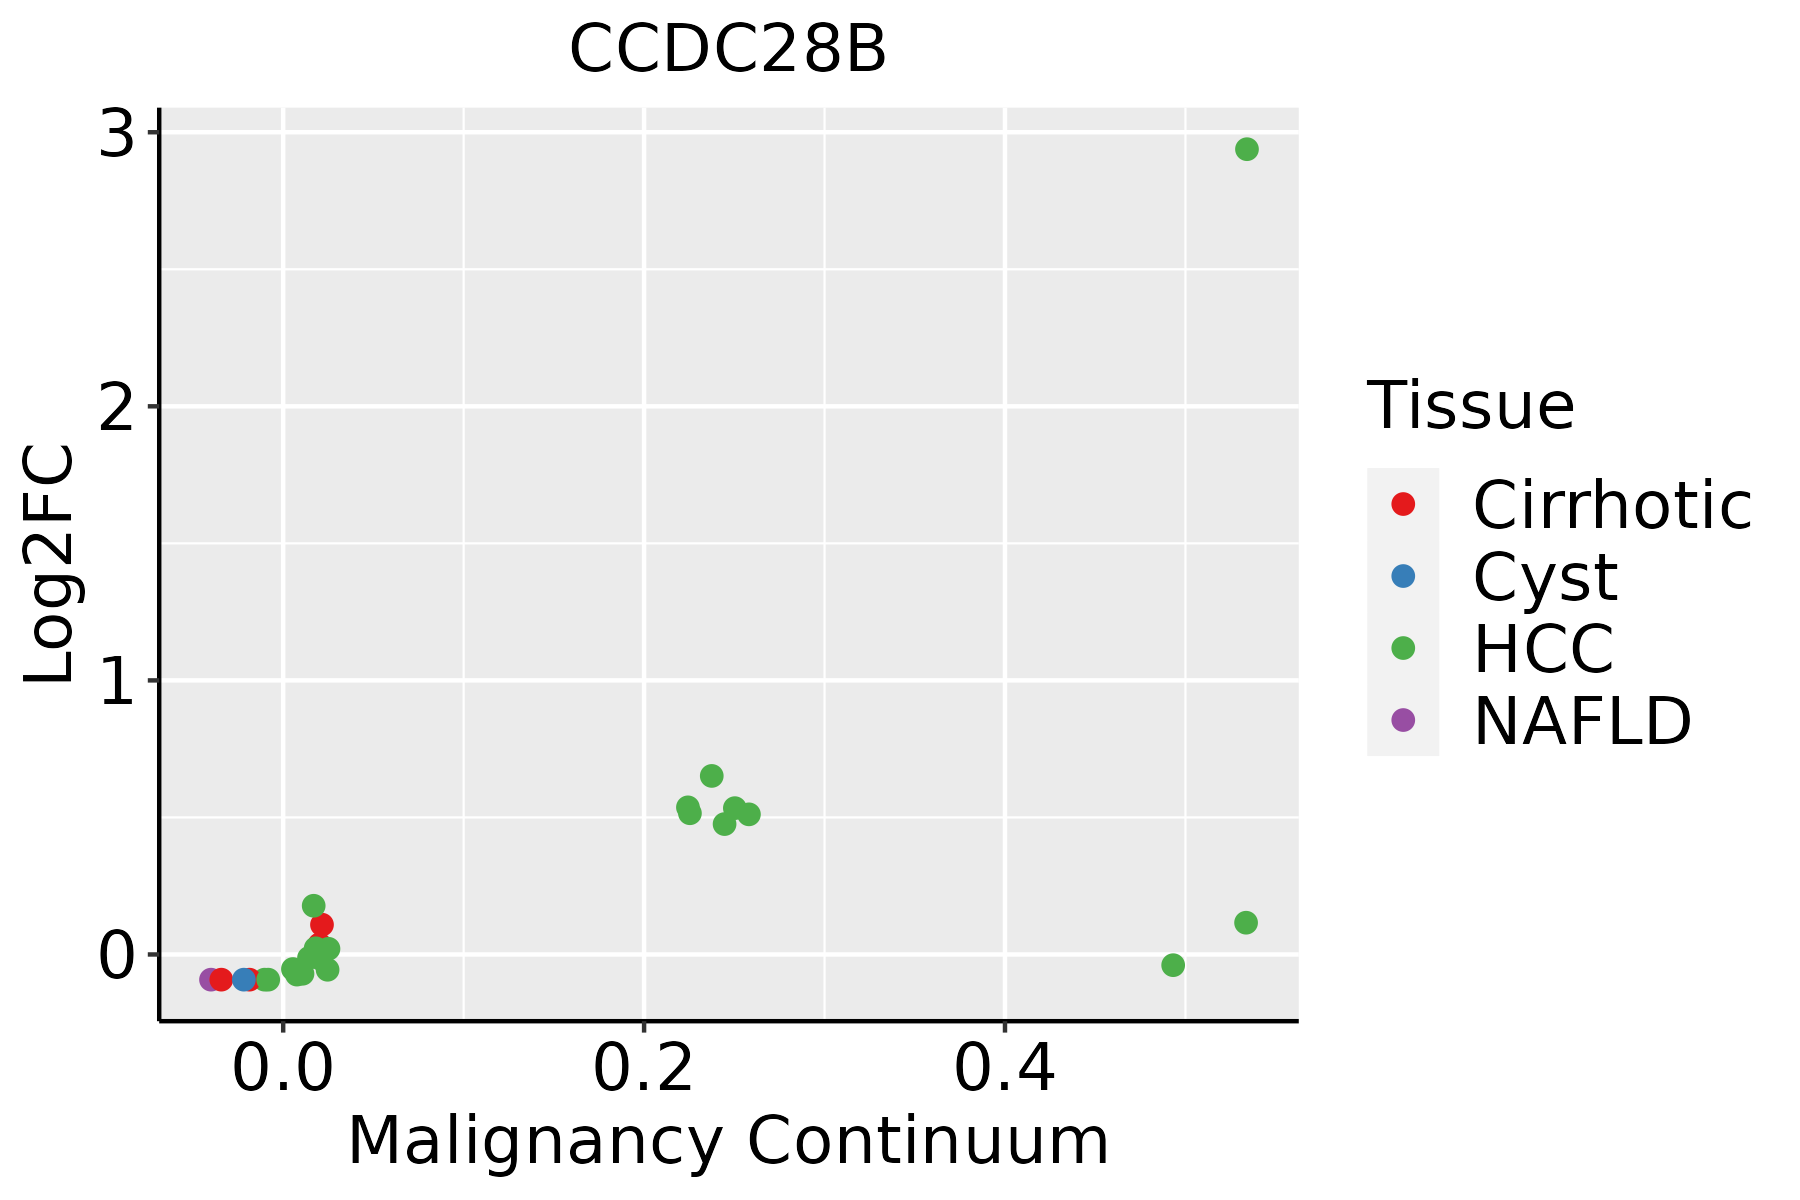 | HCC: Hepatocellular carcinoma |
| NAFLD: Non-alcoholic fatty liver disease | ||
| Oral Cavity |  | EOLP: Erosive Oral lichen planus |
| LP: leukoplakia | ||
| NEOLP: Non-erosive oral lichen planus | ||
| OSCC: Oral squamous cell carcinoma | ||
| Thyroid | 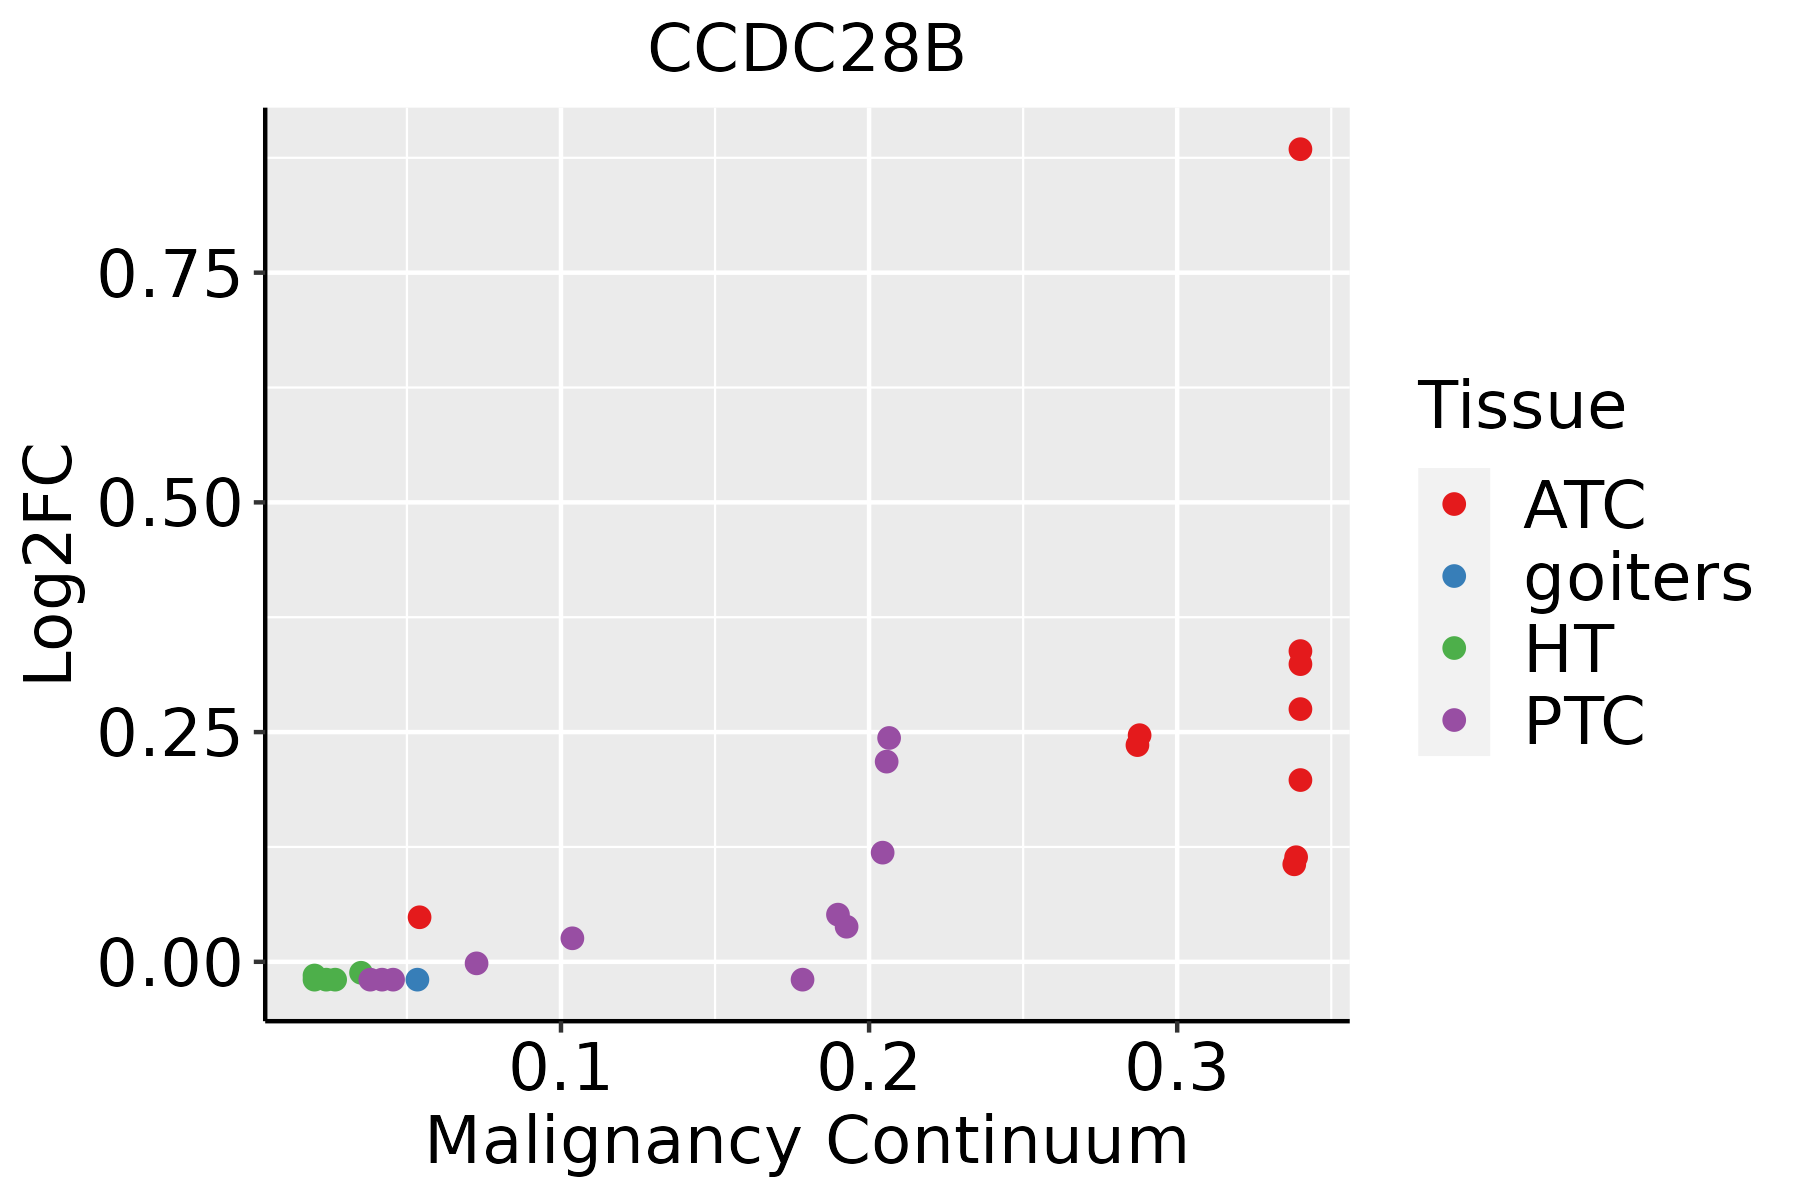 | ATC: Anaplastic thyroid cancer |
| HT: Hashimoto's thyroiditis | ||
| PTC: Papillary thyroid cancer |
| ∗log2FC in expression of this searched gene in stem-like cells from each diseased tissue sample relative to stem-like cells in normal samples in each tissue plotted against the malignancy continuum. Samples are colored based on if they are from different disease stage. |
Top |
Malignant transformation related pathway analysis |
| Find out the enriched GO biological processes and KEGG pathways involved in transition from healthy to precancer to cancer |
| Tissue | Disease Stage | Enriched GO biological Processes |
| Colorectum | AD |  |
| Colorectum | SER |  |
| Colorectum | MSS |  |
| Colorectum | MSI-H |  |
| Colorectum | FAP |  |
| ∗Top 15 enriched GO BP terms are showed in the bar plot of each disease state in each tissue. Each row represents a significant GO biological process which is colored according to the -log10(p.adjust). |
| Page: 1 2 3 4 5 6 7 8 9 |
| GO ID | Tissue | Disease Stage | Description | Gene Ratio | Bg Ratio | pvalue | p.adjust | Count |
| Page: 1 |
| Pathway ID | Tissue | Disease Stage | Description | Gene Ratio | Bg Ratio | pvalue | p.adjust | qvalue | Count |
| Page: 1 |
Top |
Cell-cell communication analysis |
| Identification of potential cell-cell interactions between two cell types and their ligand-receptor pairs for different disease states |
| Ligand | Receptor | LRpair | Pathway | Tissue | Disease Stage |
| Page: 1 |
Top |
Single-cell gene regulatory network inference analysis |
| Find out the significant the regulons (TFs) and the target genes of each regulon across cell types for different disease states |
| TF | Cell Type | Tissue | Disease Stage | Target Gene | RSS | Regulon Activity |
| ∗The dot plots of a searched regulon are shown for all cell subpopulations in each disease state of each tissue based on the regulon specific score inferred using pySCENIC and by calculating the average expression. |
| Page: 1 |
Top |
Somatic mutation of malignant transformation related genes |
| Annotation of somatic variants for genes involved in malignant transformation |
| Hugo Symbol | Variant Class | Variant Classification | dbSNP RS | HGVSc | HGVSp | HGVSp Short | SWISSPROT | BIOTYPE | SIFT | PolyPhen | Tumor Sample Barcode | Tissue | Histology | Sex | Age | Stage | Therapy Types | Drugs | Outcome |
| CCDC28B | SNV | Missense_Mutation | c.211N>T | p.Gly71Cys | p.G71C | Q9BUN5 | protein_coding | tolerated(0.05) | probably_damaging(0.964) | TCGA-BH-A0AW-01 | Breast | breast invasive carcinoma | Female | <65 | I/II | Chemotherapy | carboplatin | SD | |
| CCDC28B | insertion | In_Frame_Ins | novel | c.427_428insGGCTCATGCCTGCAACCCCAGCACTTTGGGAGGCCA | p.Glu143delinsGlyLeuMetProAlaThrProAlaLeuTrpGluAlaLys | p.E143delinsGLMPATPALWEAK | Q9BUN5 | protein_coding | TCGA-AN-A0FX-01 | Breast | breast invasive carcinoma | Female | <65 | I/II | Unknown | Unknown | SD | ||
| CCDC28B | SNV | Missense_Mutation | rs766218771 | c.250N>A | p.Glu84Lys | p.E84K | Q9BUN5 | protein_coding | deleterious(0.02) | benign(0.431) | TCGA-JX-A3Q0-01 | Cervix | cervical & endocervical cancer | Female | <65 | III/IV | Unknown | Unknown | SD |
| CCDC28B | SNV | Missense_Mutation | c.301N>T | p.Asp101Tyr | p.D101Y | Q9BUN5 | protein_coding | deleterious(0) | probably_damaging(0.987) | TCGA-LP-A5U3-01 | Cervix | cervical & endocervical cancer | Female | <65 | I/II | Unknown | Unknown | SD | |
| CCDC28B | SNV | Missense_Mutation | c.469N>T | p.Pro157Ser | p.P157S | Q9BUN5 | protein_coding | tolerated(0.16) | benign(0.031) | TCGA-AA-3811-01 | Colorectum | colon adenocarcinoma | Female | >=65 | III/IV | Unknown | Unknown | PD | |
| CCDC28B | SNV | Missense_Mutation | rs145792550 | c.211G>A | p.Gly71Ser | p.G71S | Q9BUN5 | protein_coding | tolerated(0.19) | benign(0.074) | TCGA-AA-3994-01 | Colorectum | colon adenocarcinoma | Male | >=65 | III/IV | Chemotherapy | capecitabine | CR |
| CCDC28B | SNV | Missense_Mutation | c.358N>A | p.Glu120Lys | p.E120K | Q9BUN5 | protein_coding | deleterious(0.01) | probably_damaging(0.996) | TCGA-CA-5796-01 | Colorectum | colon adenocarcinoma | Female | <65 | I/II | Chemotherapy | oxaliplatin | CR | |
| CCDC28B | SNV | Missense_Mutation | c.209N>A | p.Ser70Asn | p.S70N | Q9BUN5 | protein_coding | tolerated(0.15) | benign(0.04) | TCGA-QG-A5Z2-01 | Colorectum | colon adenocarcinoma | Male | <65 | I/II | Unknown | Unknown | SD | |
| CCDC28B | SNV | Missense_Mutation | novel | c.569G>A | p.Arg190His | p.R190H | Q9BUN5 | protein_coding | tolerated_low_confidence(0.21) | benign(0.043) | TCGA-AG-A002-01 | Colorectum | rectum adenocarcinoma | Male | <65 | I/II | Unknown | Unknown | SD |
| CCDC28B | SNV | Missense_Mutation | rs754536130 | c.103N>A | p.Gly35Ser | p.G35S | Q9BUN5 | protein_coding | tolerated_low_confidence(0.17) | benign(0.281) | TCGA-A5-A0G2-01 | Endometrium | uterine corpus endometrioid carcinoma | Female | <65 | III/IV | Unknown | Unknown | SD |
| Page: 1 2 3 |
Top |
Related drugs of malignant transformation related genes |
| Identification of chemicals and drugs interact with genes involved in malignant transfromation |
| (DGIdb 4.0) |
| Entrez ID | Symbol | Category | Interaction Types | Drug Claim Name | Drug Name | PMIDs |
| Page: 1 |

Copyright 2023-Present -The University of Texas Health Science Center at Houston |