Schematic overview of the cellular and molecular mechanisms involved in the cancer progression, including the proposed cellular and molecular mechanisms in cancer cells trajectory. AT1: alveolar type 1 cells; AT2: alveolar type 2 cells; AAH: atypical adenomatous hyperplasia; AIS: adenocarcinoma in situ; MIA: minimally invasive adenocarcinoma; IA: invasive adenocarcinoma; EMT: epithelial-mesenchymal transition

Home

Download

Statistics

Help

Contact

Center for Computational Systems Medicine
leaf

Gene summary

leaf

Malignant transformation analysis

leaf

Malignant transformation related pathway analysis

leaf

Cell-cell communication analysis

leaf

Single-cell gene regulatory network inference analysis

leaf

Somatic mutation of malignant transformation related genes

leaf

Related drugs of malignant transformation related genes

Gene: CCDC186

Gene summary for CCDC186

check button Gene summary.

Gene informationSpeciesHuman
Gene symbol

CCDC186

Gene ID

55088

Gene namecoiled-coil domain containing 186
Gene AliasC10orf118
Cytomap10q25.3
Gene Typeprotein-coding
GO ID

GO:0001678

UniProtAcc

Q496Y1


Top

Malignant transformation analysis

check button Identification of the aberrant gene expression in precancerous and cancerous lesions by comparing the gene expression of stem-like cells in diseased tissues with normal stem cells
check button Malignant transformation involving gene list.
Entrez IDSymbolReplicatesSpeciesOrganTissueAdj P-valueLog2FCMalignancy
55088CCDC186LZE2THumanEsophagusESCC1.55e-022.89e-010.082
55088CCDC186LZE4THumanEsophagusESCC7.36e-143.54e-010.0811
55088CCDC186LZE5THumanEsophagusESCC1.34e-034.97e-010.0514
55088CCDC186LZE7THumanEsophagusESCC9.04e-084.56e-010.0667
55088CCDC186LZE8THumanEsophagusESCC5.34e-112.00e-010.067
55088CCDC186LZE20THumanEsophagusESCC1.35e-091.15e-010.0662
55088CCDC186LZE24THumanEsophagusESCC3.42e-297.79e-010.0596
55088CCDC186LZE21THumanEsophagusESCC3.69e-022.73e-010.0655
55088CCDC186P1T-EHumanEsophagusESCC7.85e-115.47e-010.0875
55088CCDC186P2T-EHumanEsophagusESCC5.43e-347.20e-010.1177
55088CCDC186P4T-EHumanEsophagusESCC2.65e-256.13e-010.1323
55088CCDC186P5T-EHumanEsophagusESCC7.22e-225.57e-010.1327
55088CCDC186P8T-EHumanEsophagusESCC3.17e-244.85e-010.0889
55088CCDC186P9T-EHumanEsophagusESCC2.16e-091.68e-010.1131
55088CCDC186P10T-EHumanEsophagusESCC4.62e-191.55e-010.116
55088CCDC186P11T-EHumanEsophagusESCC2.69e-075.40e-010.1426
55088CCDC186P12T-EHumanEsophagusESCC1.83e-387.56e-010.1122
55088CCDC186P15T-EHumanEsophagusESCC9.23e-194.27e-010.1149
55088CCDC186P16T-EHumanEsophagusESCC1.18e-336.43e-010.1153
55088CCDC186P17T-EHumanEsophagusESCC4.35e-113.45e-010.1278
Page: 1 2 3 4 5 6 7 

check button Transcriptomic changes along malignancy continuum.
TissueExpression DynamicsAbbreviation
EsophagusThe image shows the transcriptomic changes along malignancy continuum.log2FC in expression of this searched gene in stem-like cells from each diseased tissue sample relative to stem-like cells in normal samples in each tissue plotted against the malignancy continuum. Samples are colored based on if they are from different disease stage.ESCC: Esophageal squamous cell carcinoma
HGIN: High-grade intraepithelial neoplasias
LGIN: Low-grade intraepithelial neoplasias
LiverThe image shows the transcriptomic changes along malignancy continuum.log2FC in expression of this searched gene in stem-like cells from each diseased tissue sample relative to stem-like cells in normal samples in each tissue plotted against the malignancy continuum. Samples are colored based on if they are from different disease stage.
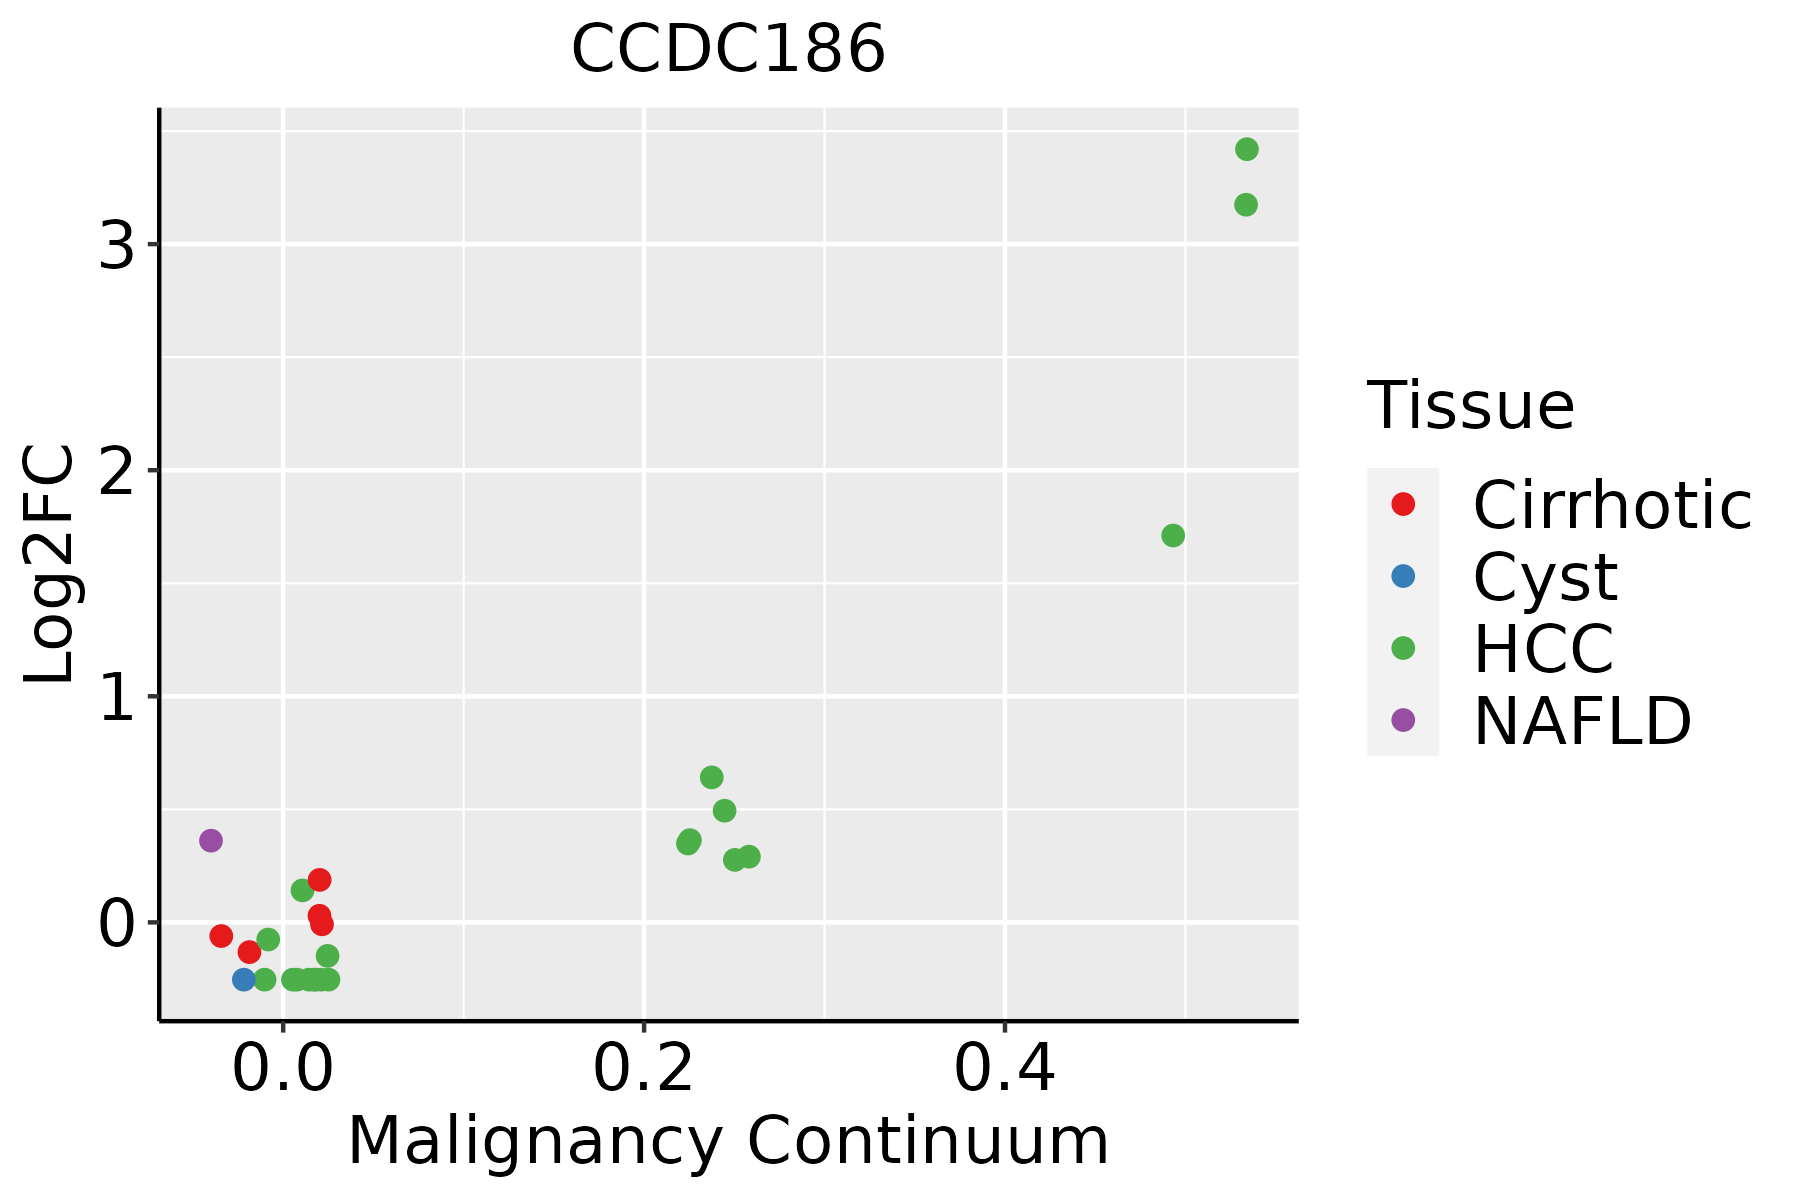
HCC: Hepatocellular carcinoma
NAFLD: Non-alcoholic fatty liver disease
Oral CavityThe image shows the transcriptomic changes along malignancy continuum.log2FC in expression of this searched gene in stem-like cells from each diseased tissue sample relative to stem-like cells in normal samples in each tissue plotted against the malignancy continuum. Samples are colored based on if they are from different disease stage.
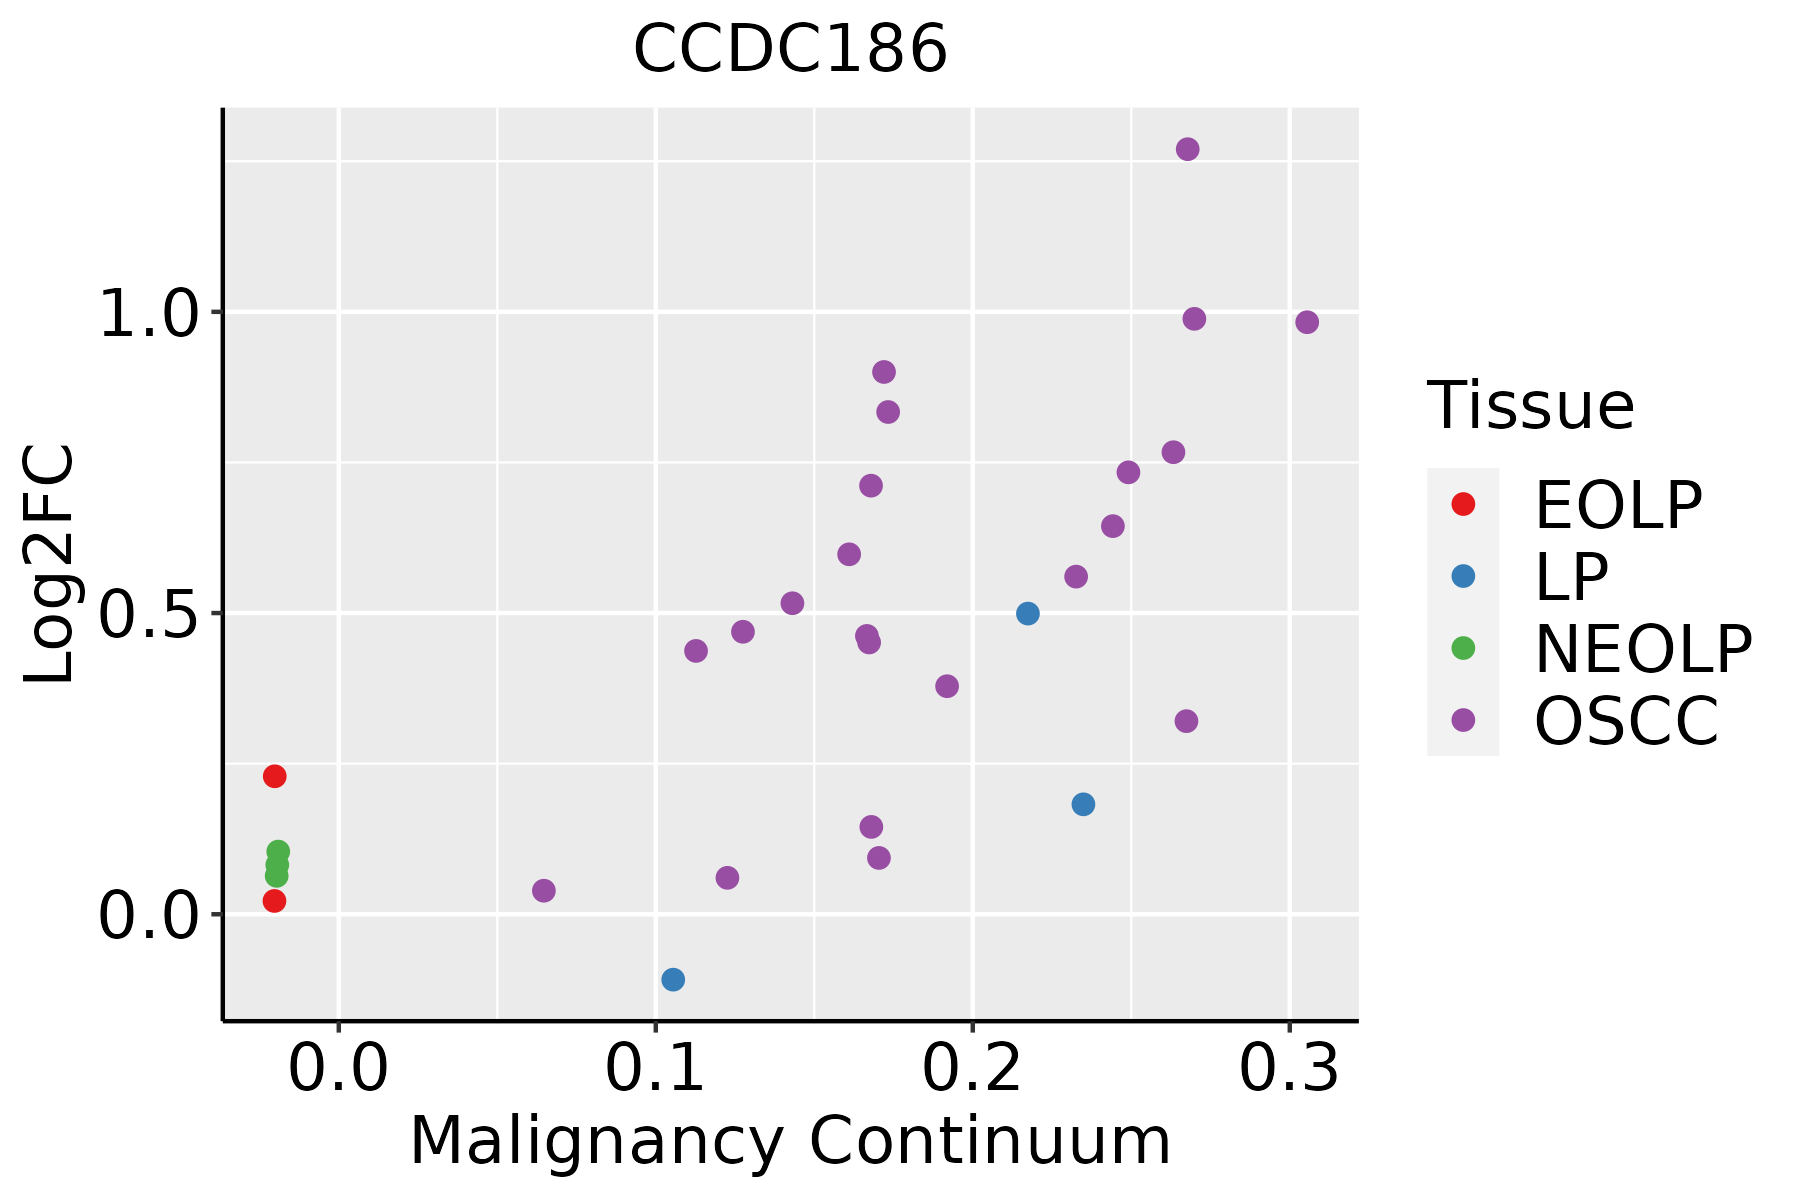
EOLP: Erosive Oral lichen planus
LP: leukoplakia
NEOLP: Non-erosive oral lichen planus
OSCC: Oral squamous cell carcinoma
ProstateThe image shows the transcriptomic changes along malignancy continuum.log2FC in expression of this searched gene in stem-like cells from each diseased tissue sample relative to stem-like cells in normal samples in each tissue plotted against the malignancy continuum. Samples are colored based on if they are from different disease stage.BPH: Benign Prostatic Hyperplasia
ThyroidThe image shows the transcriptomic changes along malignancy continuum.log2FC in expression of this searched gene in stem-like cells from each diseased tissue sample relative to stem-like cells in normal samples in each tissue plotted against the malignancy continuum. Samples are colored based on if they are from different disease stage.ATC: Anaplastic thyroid cancer
HT: Hashimoto's thyroiditis
PTC: Papillary thyroid cancer
∗log2FC in expression of this searched gene in stem-like cells from each diseased tissue sample relative to stem-like cells in normal samples in each tissue plotted against the malignancy continuum. Samples are colored based on if they are from different disease stage.

Top

Malignant transformation related pathway analysis

check buttonFind out the enriched GO biological processes and KEGG pathways involved in transition from healthy to precancer to cancer
check button Figure of enriched GO biological processes.
TissueDisease StageEnriched GO biological Processes
ColorectumADGO analysis - Figure of enriched GO biological processes: Top 15 enriched GO BP terms are showed in the bar plot of each disease state in each tissue. Each row represents a significant GO biological process which is colored according to the -log10(p.adjust).
ColorectumSERGO analysis - Figure of enriched GO biological processes: Top 15 enriched GO BP terms are showed in the bar plot of each disease state in each tissue. Each row represents a significant GO biological process which is colored according to the -log10(p.adjust).
ColorectumMSSGO analysis - Figure of enriched GO biological processes: Top 15 enriched GO BP terms are showed in the bar plot of each disease state in each tissue. Each row represents a significant GO biological process which is colored according to the -log10(p.adjust).
ColorectumMSI-HGO analysis - Figure of enriched GO biological processes: Top 15 enriched GO BP terms are showed in the bar plot of each disease state in each tissue. Each row represents a significant GO biological process which is colored according to the -log10(p.adjust).
ColorectumFAPGO analysis - Figure of enriched GO biological processes: Top 15 enriched GO BP terms are showed in the bar plot of each disease state in each tissue. Each row represents a significant GO biological process which is colored according to the -log10(p.adjust).
∗Top 15 enriched GO BP terms are showed in the bar plot of each disease state in each tissue. Each row represents a significant GO biological process which is colored according to the -log10(p.adjust).
Page: 1 2 3 4 5 6 7 8 9 

check button Enriched GO biological processes.
GO IDTissueDisease StageDescriptionGene RatioBg Ratiopvaluep.adjustCount
GO:005165617EsophagusESCCestablishment of organelle localization273/8552390/187239.13e-231.81e-20273
GO:005165016EsophagusESCCestablishment of vesicle localization114/8552161/187238.20e-112.53e-09114
GO:003070518EsophagusESCCcytoskeleton-dependent intracellular transport133/8552195/187231.48e-104.27e-09133
GO:005164815EsophagusESCCvesicle localization119/8552177/187235.16e-091.08e-07119
GO:00995185EsophagusESCCvesicle cytoskeletal trafficking50/855273/187236.75e-055.12e-0450
GO:000930617EsophagusESCCprotein secretion190/8552359/187233.22e-031.34e-02190
GO:003559217EsophagusESCCestablishment of protein localization to extracellular region190/8552360/187233.77e-031.53e-02190
GO:007169210EsophagusESCCprotein localization to extracellular region193/8552368/187235.01e-031.92e-02193
GO:0009743111EsophagusESCCresponse to carbohydrate135/8552253/187238.16e-032.89e-02135
GO:00097437LiverNAFLDresponse to carbohydrate45/1882253/187231.07e-042.11e-0345
GO:00425936LiverNAFLDglucose homeostasis45/1882258/187231.71e-043.08e-0345
GO:00335006LiverNAFLDcarbohydrate homeostasis45/1882259/187231.87e-043.29e-0345
GO:00342847LiverNAFLDresponse to monosaccharide37/1882225/187231.86e-031.91e-0237
GO:00307055LiverNAFLDcytoskeleton-dependent intracellular transport33/1882195/187231.98e-031.98e-0233
GO:00097467LiverNAFLDresponse to hexose36/1882219/187232.14e-032.08e-0236
GO:00516565LiverNAFLDestablishment of organelle localization57/1882390/187232.52e-032.34e-0257
GO:00516485LiverNAFLDvesicle localization30/1882177/187233.01e-032.72e-0230
GO:00355926LiverNAFLDestablishment of protein localization to extracellular region52/1882360/187234.80e-033.81e-0252
GO:00516505LiverNAFLDestablishment of vesicle localization27/1882161/187235.47e-034.20e-0227
GO:00016786LiverNAFLDcellular glucose homeostasis28/1882172/187237.15e-034.96e-0228
Page: 1 2 3 4 5 6 7 8 

check button Enriched KEGG pathways.
Pathway IDTissueDisease StageDescriptionGene RatioBg Ratiopvaluep.adjustqvalueCount
Page: 1 

Top

Cell-cell communication analysis

check buttonIdentification of potential cell-cell interactions between two cell types and their ligand-receptor pairs for different disease states
LigandReceptorLRpairPathwayTissueDisease Stage
Page: 1 

Top

Single-cell gene regulatory network inference analysis

check buttonFind out the significant the regulons (TFs) and the target genes of each regulon across cell types for different disease states
TFCell TypeTissueDisease StageTarget GeneRSSRegulon Activity
∗The dot plots of a searched regulon are shown for all cell subpopulations in each disease state of each tissue based on the regulon specific score inferred using pySCENIC and by calculating the average expression.
Page: 1 

Top

Somatic mutation of malignant transformation related genes

check buttonAnnotation of somatic variants for genes involved in malignant transformation
Hugo SymbolVariant ClassVariant ClassificationdbSNP RSHGVScHGVSpHGVSp ShortSWISSPROTBIOTYPESIFTPolyPhenTumor Sample BarcodeTissueHistologySexAgeStageTherapy TypesDrugsOutcome
CCDC186SNVMissense_Mutationc.775N>Cp.Glu259Glnp.E259QQ7Z3E2protein_codingtolerated(0.11)probably_damaging(0.997)TCGA-A1-A0SI-01Breastbreast invasive carcinomaFemale<65I/IIUnknownUnknownSD
CCDC186SNVMissense_Mutationrs758664195c.1943N>Ap.Arg648Glnp.R648QQ7Z3E2protein_codingtolerated(0.06)benign(0.007)TCGA-AN-A046-01Breastbreast invasive carcinomaFemale>=65I/IIUnknownUnknownSD
CCDC186SNVMissense_Mutationrs757447418c.1292N>Ap.Arg431Glnp.R431QQ7Z3E2protein_codingdeleterious(0)probably_damaging(0.997)TCGA-AN-A046-01Breastbreast invasive carcinomaFemale>=65I/IIUnknownUnknownSD
CCDC186SNVMissense_Mutationnovelc.999N>Tp.Glu333Aspp.E333DQ7Z3E2protein_codingtolerated(0.05)probably_damaging(0.996)TCGA-AN-A046-01Breastbreast invasive carcinomaFemale>=65I/IIUnknownUnknownSD
CCDC186SNVMissense_Mutationnovelc.2191N>Tp.Asn731Tyrp.N731YQ7Z3E2protein_codingdeleterious(0)probably_damaging(0.971)TCGA-AQ-A54N-01Breastbreast invasive carcinomaFemale<65I/IIUnknownUnknownSD
CCDC186insertionNonsense_Mutationnovelc.1758_1759insTAATACAAATATATTCAGATATTTGCCATAGAGTTTAGTTTGTTTTTAp.Ser586_Glu587insTerp.S586_E587ins*Q7Z3E2protein_codingTCGA-AR-A0TY-01Breastbreast invasive carcinomaFemale<65I/IIUnspecificPaclitaxelPD
CCDC186SNVMissense_Mutationrs759611860c.829G>Ap.Val277Ilep.V277IQ7Z3E2protein_codingtolerated(0.32)benign(0)TCGA-2W-A8YY-01Cervixcervical & endocervical cancerFemale<65I/IIChemotherapycisplatinCR
CCDC186SNVMissense_Mutationc.583N>Cp.Glu195Glnp.E195QQ7Z3E2protein_codingdeleterious_low_confidence(0.01)possibly_damaging(0.714)TCGA-C5-A3HE-01Cervixcervical & endocervical cancerFemale<65I/IIUnknownUnknownPD
CCDC186SNVMissense_Mutationc.1522C>Gp.Leu508Valp.L508VQ7Z3E2protein_codingdeleterious(0)probably_damaging(0.996)TCGA-IR-A3LA-01Cervixcervical & endocervical cancerFemale<65I/IIChemotherapycisplatinCR
CCDC186SNVMissense_Mutationnovelc.410C>Tp.Ser137Leup.S137LQ7Z3E2protein_codingdeleterious_low_confidence(0.02)benign(0.133)TCGA-JW-A5VL-01Cervixcervical & endocervical cancerFemale<65I/IIUnknownUnknownSD
Page: 1 2 3 4 5 6 7 8 9 

Top

Related drugs of malignant transformation related genes

check buttonIdentification of chemicals and drugs interact with genes involved in malignant transfromation
(DGIdb 4.0)
Entrez IDSymbolCategoryInteraction TypesDrug Claim NameDrug NamePMIDs
Page: 1