
|
|||||
|
 | |
| |
| |
| |
| |
| |
|
Gene: CCDC130 |
Gene summary for CCDC130 |
| Gene information | Species | Human | Gene symbol | CCDC130 | Gene ID | 81576 |
| Gene name | YJU2 splicing factor homolog B | |
| Gene Alias | CCDC130 | |
| Cytomap | 19p13.13 | |
| Gene Type | protein-coding | GO ID | GO:0006139 | UniProtAcc | B7Z1U2 |
Top |
Malignant transformation analysis |
| Identification of the aberrant gene expression in precancerous and cancerous lesions by comparing the gene expression of stem-like cells in diseased tissues with normal stem cells |
| Entrez ID | Symbol | Replicates | Species | Organ | Tissue | Adj P-value | Log2FC | Malignancy |
| 81576 | CCDC130 | LZE2T | Human | Esophagus | ESCC | 4.39e-02 | 2.75e-01 | 0.082 |
| 81576 | CCDC130 | LZE4T | Human | Esophagus | ESCC | 3.43e-13 | 3.65e-01 | 0.0811 |
| 81576 | CCDC130 | LZE5T | Human | Esophagus | ESCC | 3.56e-02 | 2.18e-01 | 0.0514 |
| 81576 | CCDC130 | LZE7T | Human | Esophagus | ESCC | 7.62e-16 | 6.40e-01 | 0.0667 |
| 81576 | CCDC130 | LZE20T | Human | Esophagus | ESCC | 5.75e-08 | 1.53e-01 | 0.0662 |
| 81576 | CCDC130 | LZE21D1 | Human | Esophagus | HGIN | 4.06e-07 | 4.23e-01 | 0.0632 |
| 81576 | CCDC130 | LZE22D1 | Human | Esophagus | HGIN | 2.81e-05 | 2.23e-01 | 0.0595 |
| 81576 | CCDC130 | LZE22T | Human | Esophagus | ESCC | 8.01e-09 | 4.82e-01 | 0.068 |
| 81576 | CCDC130 | LZE24T | Human | Esophagus | ESCC | 1.41e-26 | 5.55e-01 | 0.0596 |
| 81576 | CCDC130 | LZE21T | Human | Esophagus | ESCC | 7.36e-03 | 2.66e-01 | 0.0655 |
| 81576 | CCDC130 | LZE6T | Human | Esophagus | ESCC | 5.94e-08 | 3.21e-01 | 0.0845 |
| 81576 | CCDC130 | P1T-E | Human | Esophagus | ESCC | 1.75e-19 | 6.09e-01 | 0.0875 |
| 81576 | CCDC130 | P2T-E | Human | Esophagus | ESCC | 8.88e-20 | 3.33e-01 | 0.1177 |
| 81576 | CCDC130 | P4T-E | Human | Esophagus | ESCC | 4.72e-21 | 4.53e-01 | 0.1323 |
| 81576 | CCDC130 | P5T-E | Human | Esophagus | ESCC | 2.22e-27 | 4.52e-01 | 0.1327 |
| 81576 | CCDC130 | P8T-E | Human | Esophagus | ESCC | 1.35e-35 | 5.70e-01 | 0.0889 |
| 81576 | CCDC130 | P9T-E | Human | Esophagus | ESCC | 8.91e-24 | 4.62e-01 | 0.1131 |
| 81576 | CCDC130 | P10T-E | Human | Esophagus | ESCC | 7.47e-41 | 6.69e-01 | 0.116 |
| 81576 | CCDC130 | P11T-E | Human | Esophagus | ESCC | 5.02e-17 | 5.29e-01 | 0.1426 |
| 81576 | CCDC130 | P12T-E | Human | Esophagus | ESCC | 3.66e-31 | 5.39e-01 | 0.1122 |
| Page: 1 2 3 4 5 |
| Tissue | Expression Dynamics | Abbreviation |
| Esophagus | 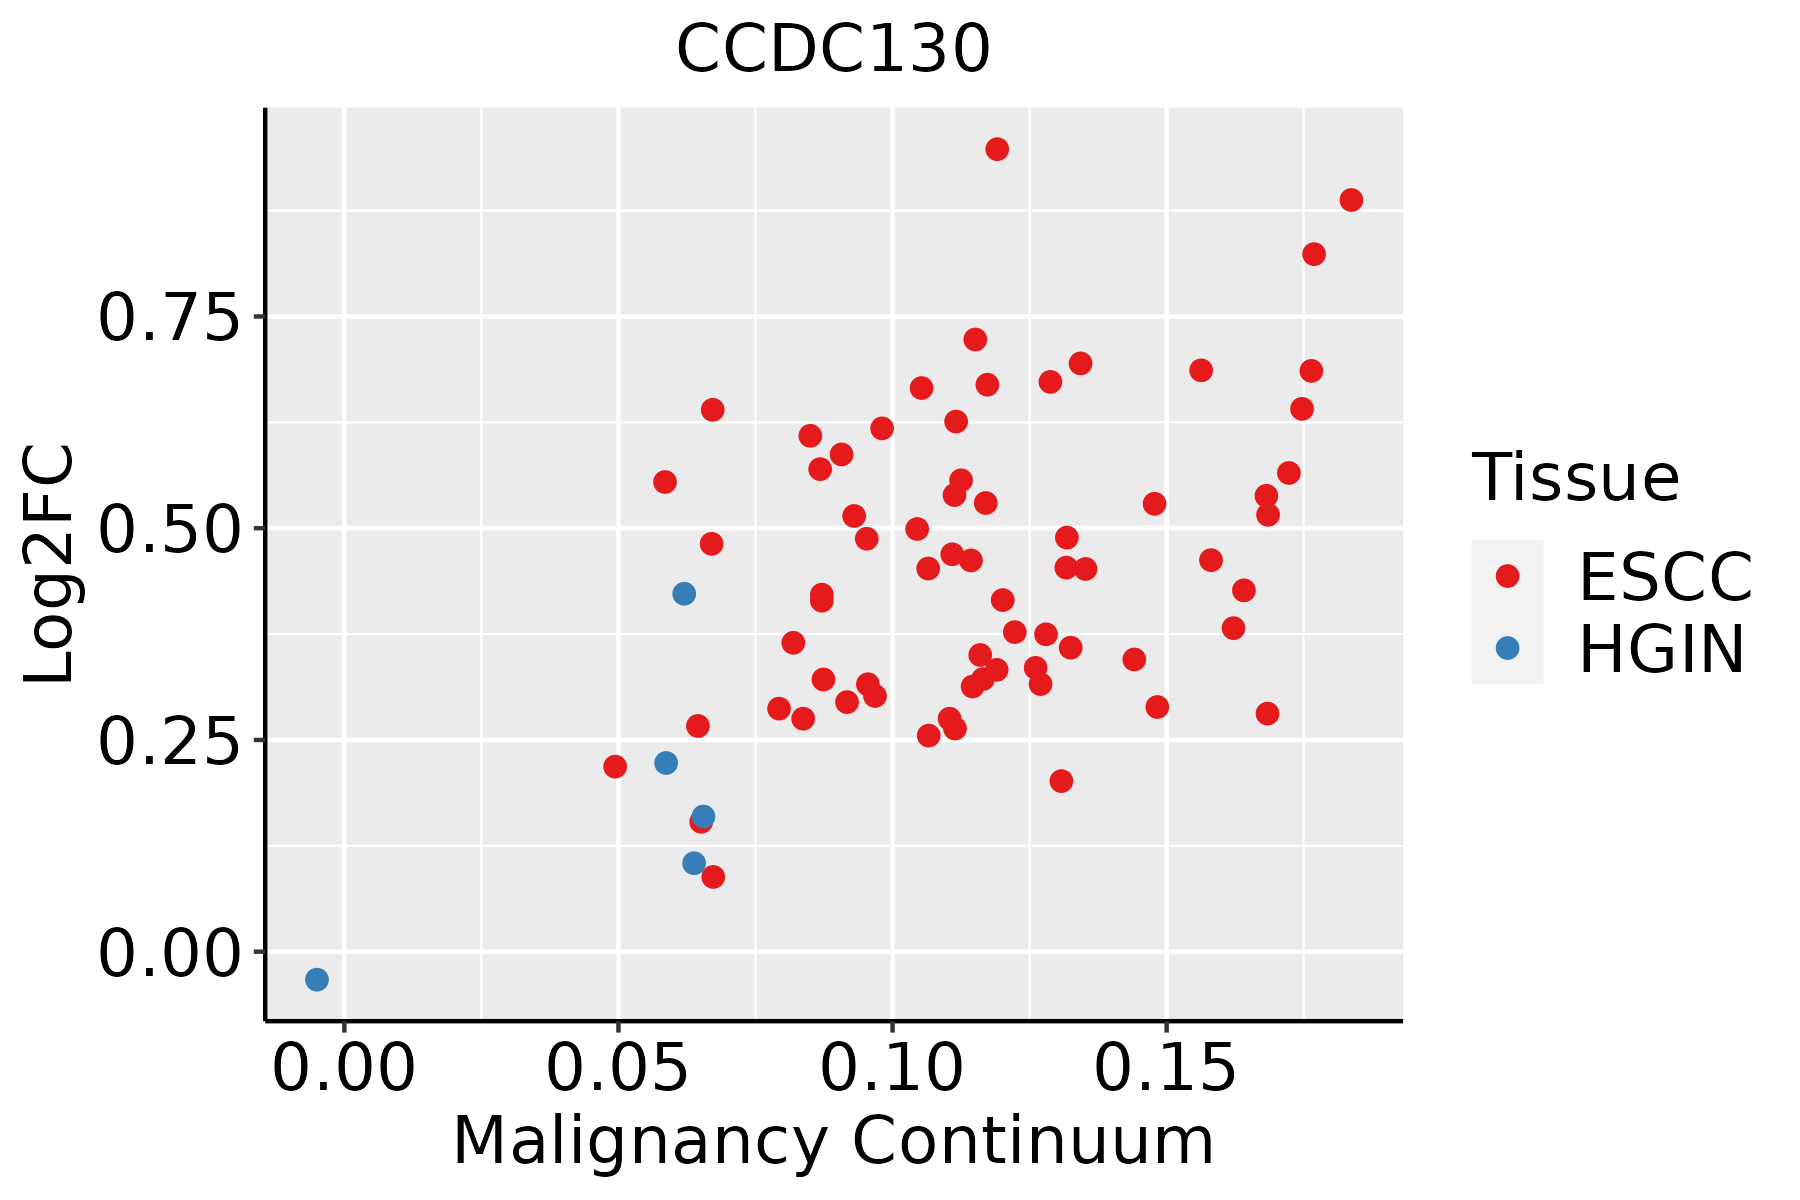 | ESCC: Esophageal squamous cell carcinoma |
| HGIN: High-grade intraepithelial neoplasias | ||
| LGIN: Low-grade intraepithelial neoplasias | ||
| Oral Cavity | 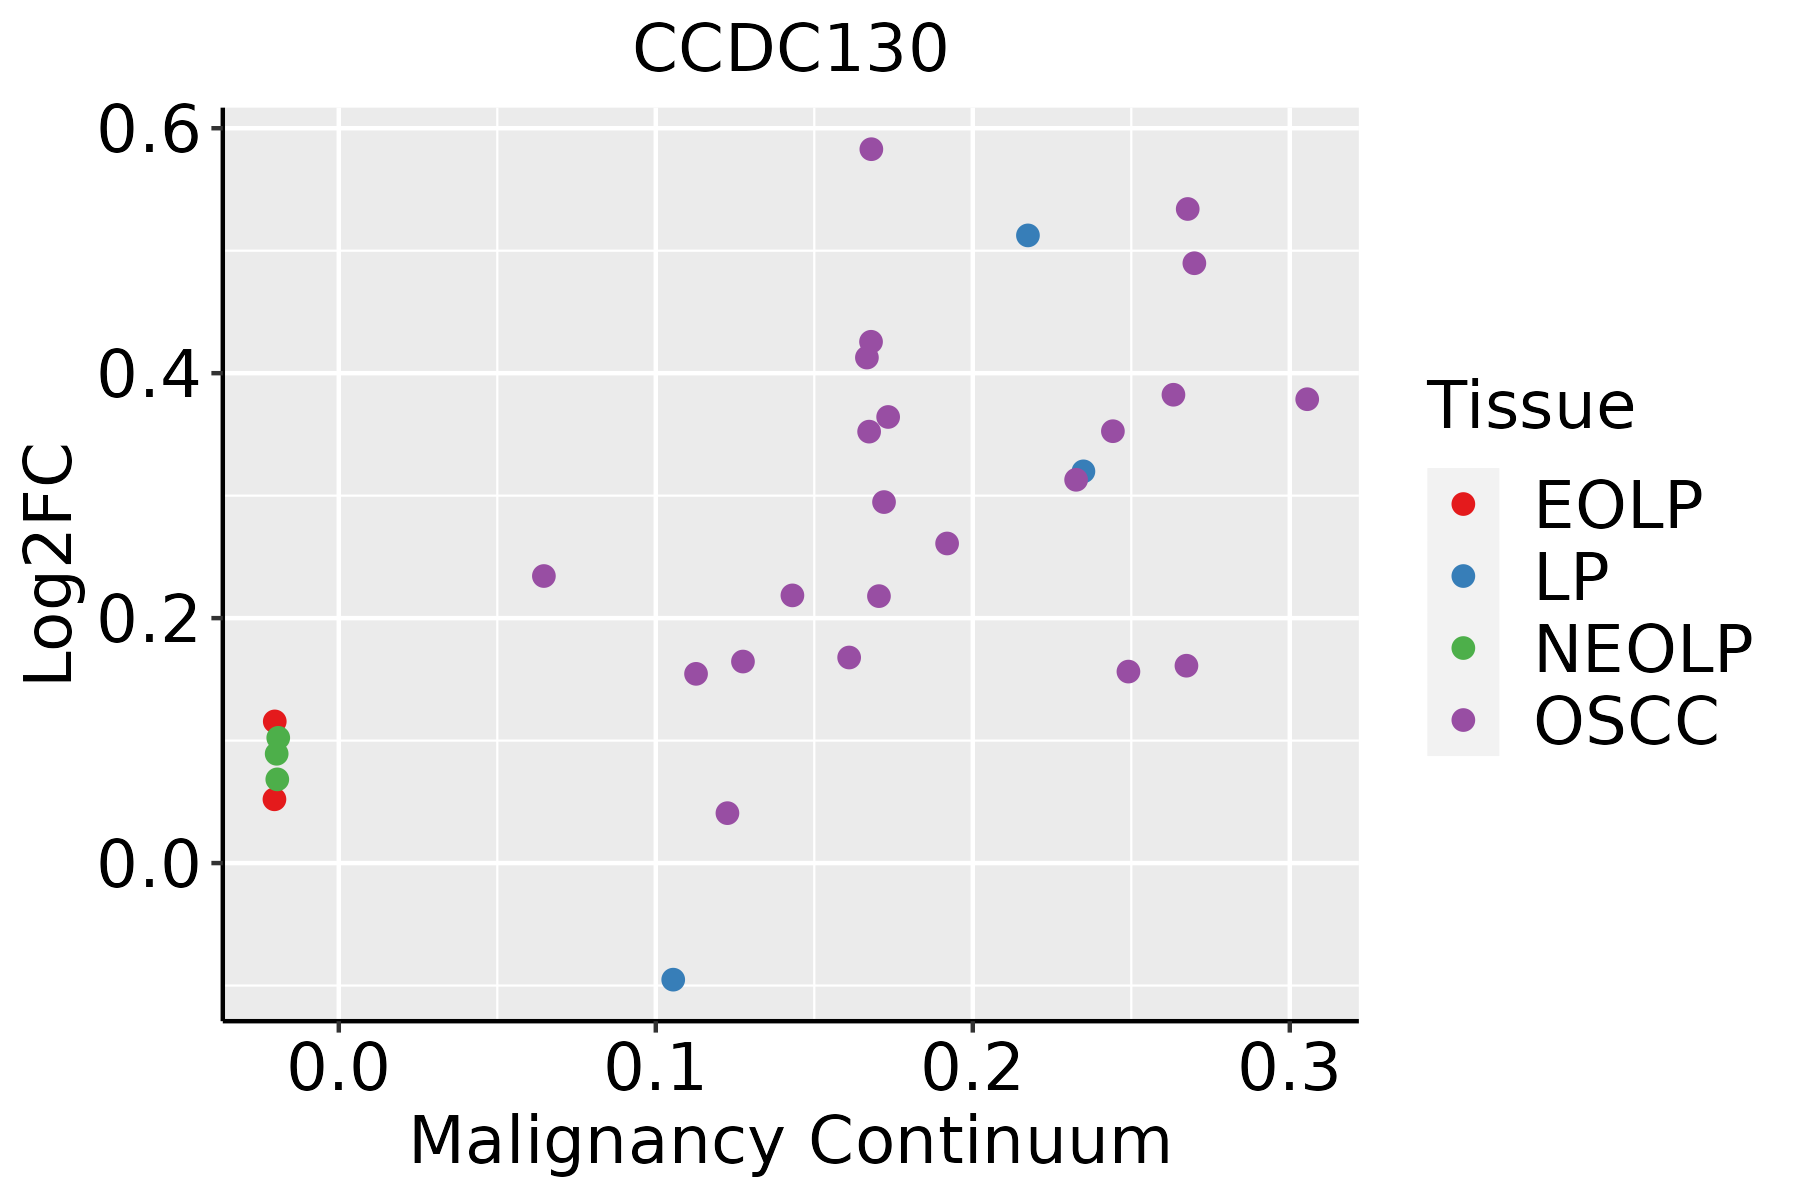 | EOLP: Erosive Oral lichen planus |
| LP: leukoplakia | ||
| NEOLP: Non-erosive oral lichen planus | ||
| OSCC: Oral squamous cell carcinoma | ||
| Thyroid | 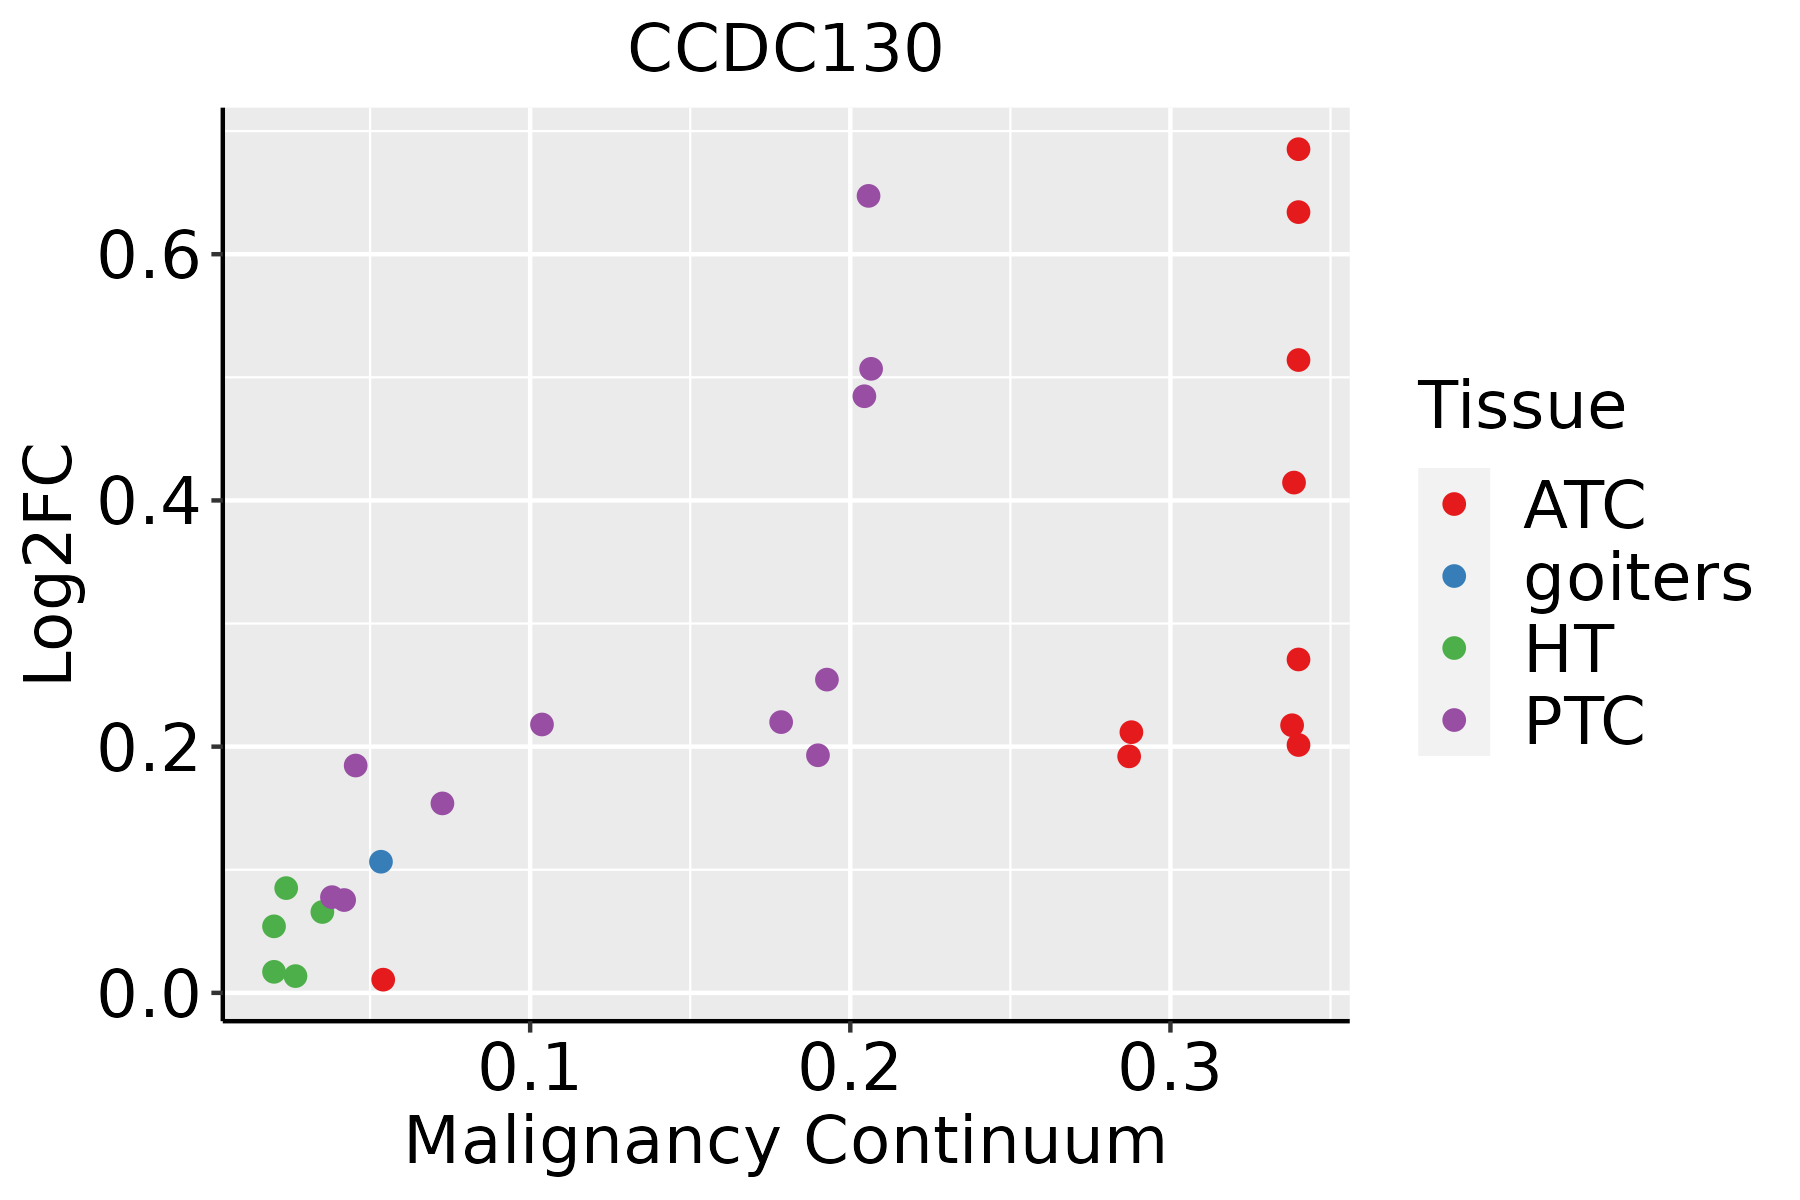 | ATC: Anaplastic thyroid cancer |
| HT: Hashimoto's thyroiditis | ||
| PTC: Papillary thyroid cancer |
| ∗log2FC in expression of this searched gene in stem-like cells from each diseased tissue sample relative to stem-like cells in normal samples in each tissue plotted against the malignancy continuum. Samples are colored based on if they are from different disease stage. |
Top |
Malignant transformation related pathway analysis |
| Find out the enriched GO biological processes and KEGG pathways involved in transition from healthy to precancer to cancer |
| Tissue | Disease Stage | Enriched GO biological Processes |
| Colorectum | AD |  |
| Colorectum | SER |  |
| Colorectum | MSS |  |
| Colorectum | MSI-H |  |
| Colorectum | FAP |  |
| ∗Top 15 enriched GO BP terms are showed in the bar plot of each disease state in each tissue. Each row represents a significant GO biological process which is colored according to the -log10(p.adjust). |
| Page: 1 2 3 4 5 6 7 8 9 |
| GO ID | Tissue | Disease Stage | Description | Gene Ratio | Bg Ratio | pvalue | p.adjust | Count |
| Page: 1 |
| Pathway ID | Tissue | Disease Stage | Description | Gene Ratio | Bg Ratio | pvalue | p.adjust | qvalue | Count |
| Page: 1 |
Top |
Cell-cell communication analysis |
| Identification of potential cell-cell interactions between two cell types and their ligand-receptor pairs for different disease states |
| Ligand | Receptor | LRpair | Pathway | Tissue | Disease Stage |
| Page: 1 |
Top |
Single-cell gene regulatory network inference analysis |
| Find out the significant the regulons (TFs) and the target genes of each regulon across cell types for different disease states |
| TF | Cell Type | Tissue | Disease Stage | Target Gene | RSS | Regulon Activity |
| ∗The dot plots of a searched regulon are shown for all cell subpopulations in each disease state of each tissue based on the regulon specific score inferred using pySCENIC and by calculating the average expression. |
| Page: 1 |
Top |
Somatic mutation of malignant transformation related genes |
| Annotation of somatic variants for genes involved in malignant transformation |
| Hugo Symbol | Variant Class | Variant Classification | dbSNP RS | HGVSc | HGVSp | HGVSp Short | SWISSPROT | BIOTYPE | SIFT | PolyPhen | Tumor Sample Barcode | Tissue | Histology | Sex | Age | Stage | Therapy Types | Drugs | Outcome |
| CCDC130 | SNV | Missense_Mutation | novel | c.457G>A | p.Glu153Lys | p.E153K | P13994 | protein_coding | tolerated(0.82) | benign(0.067) | TCGA-AC-A5XS-01 | Breast | breast invasive carcinoma | Female | >=65 | I/II | Hormone Therapy | femara | SD |
| CCDC130 | SNV | Missense_Mutation | novel | c.901N>T | p.Arg301Trp | p.R301W | P13994 | protein_coding | deleterious(0.02) | possibly_damaging(0.761) | TCGA-2W-A8YY-01 | Cervix | cervical & endocervical cancer | Female | <65 | I/II | Chemotherapy | cisplatin | CR |
| CCDC130 | SNV | Missense_Mutation | c.267N>A | p.Met89Ile | p.M89I | P13994 | protein_coding | deleterious(0) | probably_damaging(0.98) | TCGA-C5-A902-01 | Cervix | cervical & endocervical cancer | Female | <65 | I/II | Chemotherapy | cisplatin | SD | |
| CCDC130 | SNV | Missense_Mutation | c.4G>T | p.Gly2Cys | p.G2C | P13994 | protein_coding | deleterious(0) | probably_damaging(0.999) | TCGA-AA-3864-01 | Colorectum | colon adenocarcinoma | Male | >=65 | I/II | Unknown | Unknown | SD | |
| CCDC130 | SNV | Missense_Mutation | novel | c.202N>T | p.Arg68Cys | p.R68C | P13994 | protein_coding | deleterious(0) | probably_damaging(0.998) | TCGA-EI-6917-01 | Colorectum | rectum adenocarcinoma | Male | <65 | III/IV | Chemotherapy | 5fluorouracil+oxaciplatina+l-folinian | SD |
| CCDC130 | insertion | Frame_Shift_Ins | novel | c.917_918insC | p.Gln308ProfsTer35 | p.Q308Pfs*35 | P13994 | protein_coding | TCGA-A6-5665-01 | Colorectum | colon adenocarcinoma | Female | >=65 | I/II | Unknown | Unknown | PD | ||
| CCDC130 | SNV | Missense_Mutation | rs572583906 | c.109C>T | p.Arg37Trp | p.R37W | P13994 | protein_coding | deleterious(0) | probably_damaging(1) | TCGA-A5-A0G2-01 | Endometrium | uterine corpus endometrioid carcinoma | Female | <65 | III/IV | Unknown | Unknown | SD |
| CCDC130 | SNV | Missense_Mutation | rs372266888 | c.1130N>A | p.Arg377Gln | p.R377Q | P13994 | protein_coding | tolerated(0.62) | benign(0.105) | TCGA-AJ-A2QO-01 | Endometrium | uterine corpus endometrioid carcinoma | Female | >=65 | I/II | Unknown | Unknown | SD |
| CCDC130 | SNV | Missense_Mutation | c.754A>G | p.Ser252Gly | p.S252G | P13994 | protein_coding | tolerated(0.25) | benign(0.01) | TCGA-AP-A054-01 | Endometrium | uterine corpus endometrioid carcinoma | Female | <65 | III/IV | Chemotherapy | carboplatin | PD | |
| CCDC130 | SNV | Missense_Mutation | novel | c.123G>T | p.Gln41His | p.Q41H | P13994 | protein_coding | deleterious(0.03) | probably_damaging(0.992) | TCGA-AP-A1DK-01 | Endometrium | uterine corpus endometrioid carcinoma | Female | <65 | I/II | Unknown | Unknown | SD |
| Page: 1 2 3 |
Top |
Related drugs of malignant transformation related genes |
| Identification of chemicals and drugs interact with genes involved in malignant transfromation |
| (DGIdb 4.0) |
| Entrez ID | Symbol | Category | Interaction Types | Drug Claim Name | Drug Name | PMIDs |
| Page: 1 |

Copyright 2023-Present -The University of Texas Health Science Center at Houston |