
|
|||||
|
 | |
| |
| |
| |
| |
| |
|
Gene: CCDC125 |
Gene summary for CCDC125 |
| Gene information | Species | Human | Gene symbol | CCDC125 | Gene ID | 202243 |
| Gene name | coiled-coil domain containing 125 | |
| Gene Alias | KENAE | |
| Cytomap | 5q13.2 | |
| Gene Type | protein-coding | GO ID | GO:0006928 | UniProtAcc | B4DSR1 |
Top |
Malignant transformation analysis |
| Identification of the aberrant gene expression in precancerous and cancerous lesions by comparing the gene expression of stem-like cells in diseased tissues with normal stem cells |
| Entrez ID | Symbol | Replicates | Species | Organ | Tissue | Adj P-value | Log2FC | Malignancy |
| 202243 | CCDC125 | HTA11_347_2000001011 | Human | Colorectum | AD | 2.99e-16 | 6.88e-01 | -0.1954 |
| 202243 | CCDC125 | HTA11_696_2000001011 | Human | Colorectum | AD | 6.01e-05 | 4.59e-01 | -0.1464 |
| 202243 | CCDC125 | HTA11_1391_2000001011 | Human | Colorectum | AD | 6.22e-04 | 4.61e-01 | -0.059 |
| 202243 | CCDC125 | A015-C-203 | Human | Colorectum | FAP | 6.47e-06 | -1.23e-01 | -0.1294 |
| 202243 | CCDC125 | A001-C-108 | Human | Colorectum | FAP | 5.58e-03 | 7.14e-02 | -0.0272 |
| 202243 | CCDC125 | A002-C-021 | Human | Colorectum | FAP | 3.58e-04 | 2.80e-01 | 0.1171 |
| 202243 | CCDC125 | A002-C-205 | Human | Colorectum | FAP | 8.60e-06 | 6.84e-02 | -0.1236 |
| 202243 | CCDC125 | A002-C-114 | Human | Colorectum | FAP | 7.73e-04 | 4.12e-02 | -0.1561 |
| 202243 | CCDC125 | A015-C-104 | Human | Colorectum | FAP | 6.72e-08 | -2.55e-02 | -0.1899 |
| 202243 | CCDC125 | A002-C-016 | Human | Colorectum | FAP | 1.18e-04 | 9.87e-02 | 0.0521 |
| 202243 | CCDC125 | A002-C-116 | Human | Colorectum | FAP | 2.83e-10 | 1.31e-01 | -0.0452 |
| 202243 | CCDC125 | A014-C-008 | Human | Colorectum | FAP | 1.07e-02 | -2.91e-02 | -0.191 |
| 202243 | CCDC125 | A018-E-020 | Human | Colorectum | FAP | 2.33e-03 | -4.34e-02 | -0.2034 |
| 202243 | CCDC125 | F034 | Human | Colorectum | FAP | 2.03e-05 | 2.29e-01 | -0.0665 |
| 202243 | CCDC125 | F072B | Human | Colorectum | FAP | 1.86e-05 | 4.05e-01 | 0.257 |
| 202243 | CCDC125 | NAFLD1 | Human | Liver | NAFLD | 3.65e-06 | 6.36e-01 | -0.04 |
| 202243 | CCDC125 | S43 | Human | Liver | Cirrhotic | 1.37e-02 | 1.30e-03 | -0.0187 |
| 202243 | CCDC125 | HCC1_Meng | Human | Liver | HCC | 2.04e-21 | -3.29e-02 | 0.0246 |
| 202243 | CCDC125 | HCC2_Meng | Human | Liver | HCC | 3.53e-02 | -5.52e-02 | 0.0107 |
| 202243 | CCDC125 | HCC1 | Human | Liver | HCC | 6.33e-11 | 2.76e+00 | 0.5336 |
| Page: 1 2 |
| Tissue | Expression Dynamics | Abbreviation |
| Colorectum (GSE201348) |  | FAP: Familial adenomatous polyposis |
| CRC: Colorectal cancer | ||
| Colorectum (HTA11) | 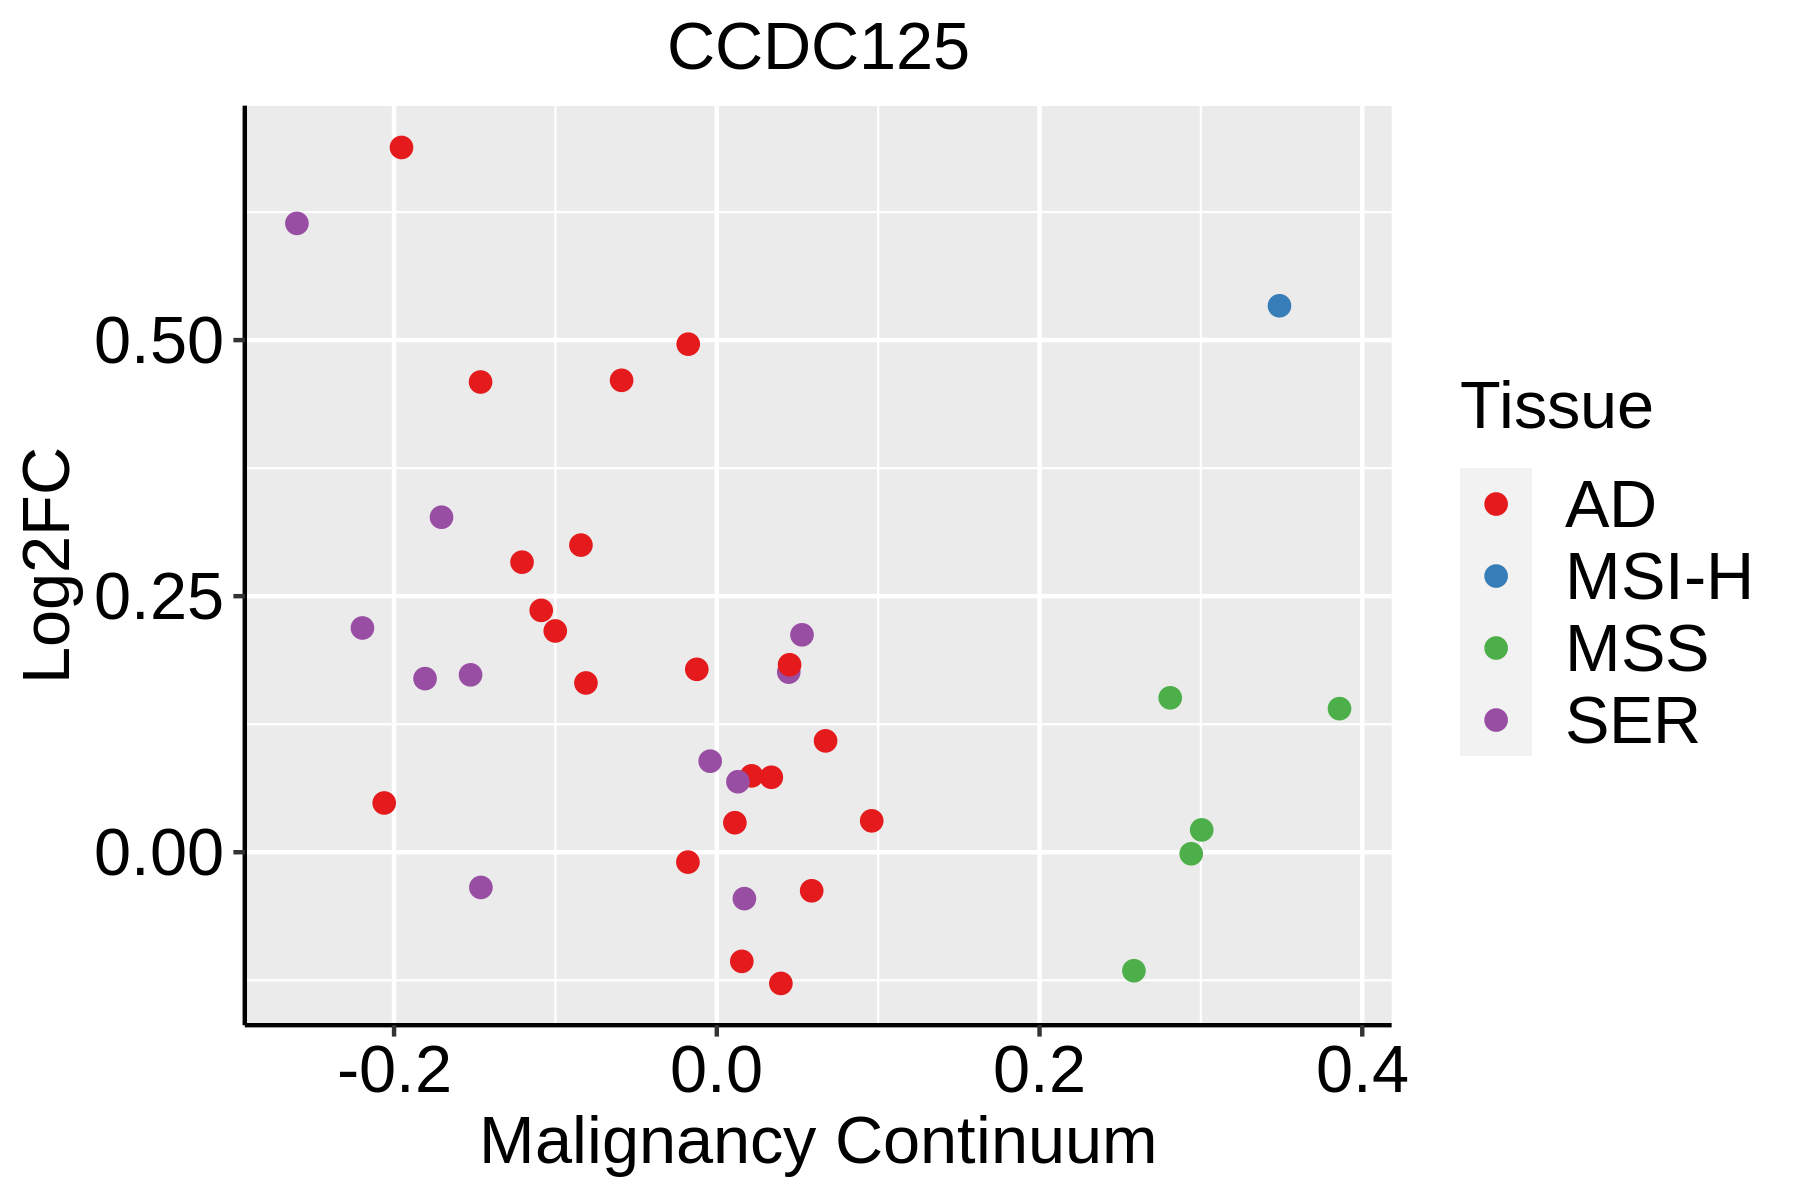 | AD: Adenomas |
| SER: Sessile serrated lesions | ||
| MSI-H: Microsatellite-high colorectal cancer | ||
| MSS: Microsatellite stable colorectal cancer | ||
| Liver | 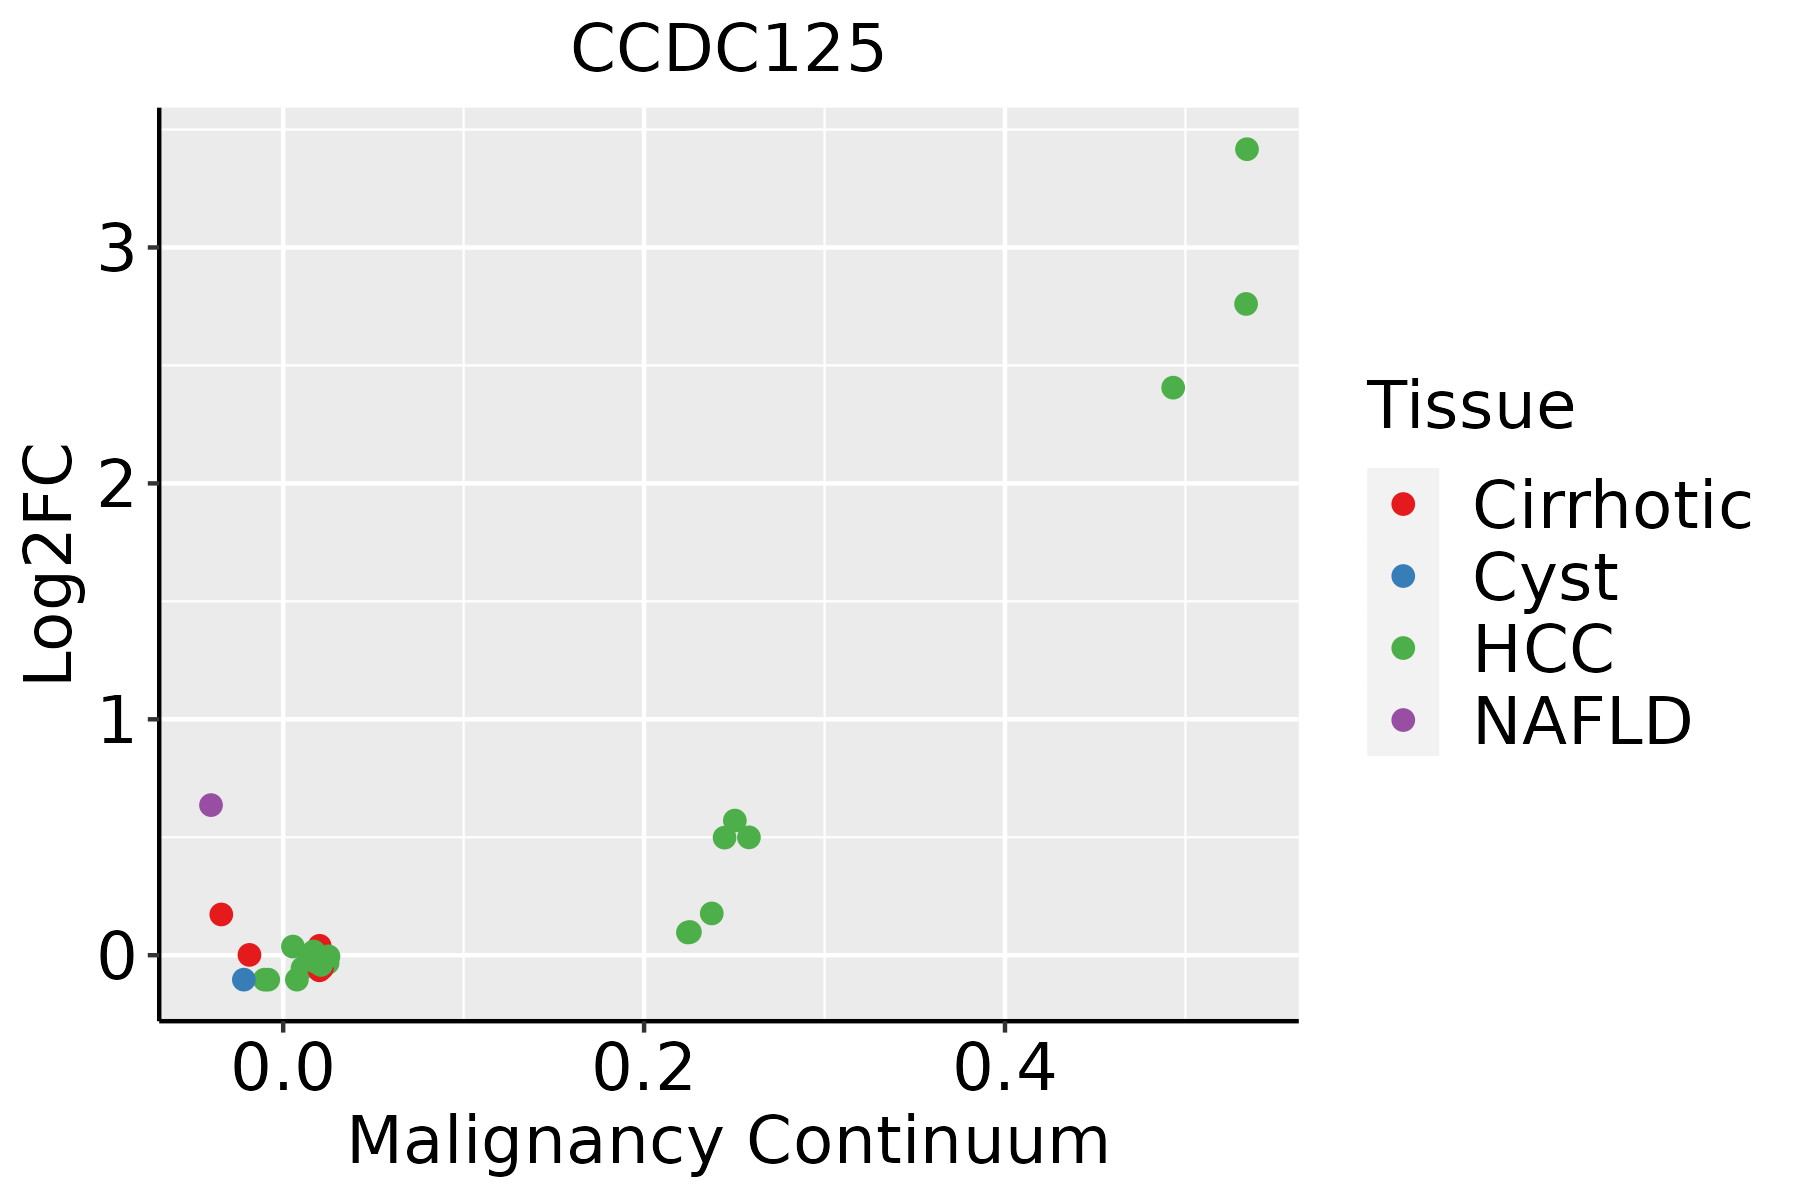 | HCC: Hepatocellular carcinoma |
| NAFLD: Non-alcoholic fatty liver disease |
| ∗log2FC in expression of this searched gene in stem-like cells from each diseased tissue sample relative to stem-like cells in normal samples in each tissue plotted against the malignancy continuum. Samples are colored based on if they are from different disease stage. |
Top |
Malignant transformation related pathway analysis |
| Find out the enriched GO biological processes and KEGG pathways involved in transition from healthy to precancer to cancer |
| Tissue | Disease Stage | Enriched GO biological Processes |
| Colorectum | AD |  |
| Colorectum | SER |  |
| Colorectum | MSS |  |
| Colorectum | MSI-H |  |
| Colorectum | FAP |  |
| ∗Top 15 enriched GO BP terms are showed in the bar plot of each disease state in each tissue. Each row represents a significant GO biological process which is colored according to the -log10(p.adjust). |
| Page: 1 2 3 4 5 6 7 8 9 |
| GO ID | Tissue | Disease Stage | Description | Gene Ratio | Bg Ratio | pvalue | p.adjust | Count |
| GO:0043087 | Colorectum | AD | regulation of GTPase activity | 110/3918 | 348/18723 | 1.64e-06 | 5.03e-05 | 110 |
| GO:0007265 | Colorectum | AD | Ras protein signal transduction | 104/3918 | 337/18723 | 1.01e-05 | 2.35e-04 | 104 |
| GO:0051056 | Colorectum | AD | regulation of small GTPase mediated signal transduction | 94/3918 | 302/18723 | 1.81e-05 | 3.76e-04 | 94 |
| GO:0043547 | Colorectum | AD | positive regulation of GTPase activity | 75/3918 | 255/18723 | 7.95e-04 | 7.91e-03 | 75 |
| GO:0046578 | Colorectum | AD | regulation of Ras protein signal transduction | 56/3918 | 189/18723 | 2.85e-03 | 2.14e-02 | 56 |
| GO:0051058 | Colorectum | AD | negative regulation of small GTPase mediated signal transduction | 21/3918 | 56/18723 | 3.26e-03 | 2.39e-02 | 21 |
| GO:0007266 | Colorectum | AD | Rho protein signal transduction | 42/3918 | 137/18723 | 4.64e-03 | 3.16e-02 | 42 |
| GO:00510562 | Colorectum | FAP | regulation of small GTPase mediated signal transduction | 78/2622 | 302/18723 | 3.25e-08 | 2.85e-06 | 78 |
| GO:00430873 | Colorectum | FAP | regulation of GTPase activity | 85/2622 | 348/18723 | 1.20e-07 | 7.68e-06 | 85 |
| GO:00072652 | Colorectum | FAP | Ras protein signal transduction | 80/2622 | 337/18723 | 9.61e-07 | 4.33e-05 | 80 |
| GO:00435472 | Colorectum | FAP | positive regulation of GTPase activity | 61/2622 | 255/18723 | 1.39e-05 | 3.73e-04 | 61 |
| GO:00465781 | Colorectum | FAP | regulation of Ras protein signal transduction | 47/2622 | 189/18723 | 4.67e-05 | 9.60e-04 | 47 |
| GO:00072661 | Colorectum | FAP | Rho protein signal transduction | 34/2622 | 137/18723 | 5.11e-04 | 5.82e-03 | 34 |
| GO:0035023 | Colorectum | FAP | regulation of Rho protein signal transduction | 22/2622 | 86/18723 | 3.11e-03 | 2.33e-02 | 22 |
| GO:00510581 | Colorectum | FAP | negative regulation of small GTPase mediated signal transduction | 16/2622 | 56/18723 | 3.40e-03 | 2.47e-02 | 16 |
| GO:0090630 | Colorectum | FAP | activation of GTPase activity | 27/2622 | 115/18723 | 4.23e-03 | 2.90e-02 | 27 |
| GO:0046580 | Colorectum | FAP | negative regulation of Ras protein signal transduction | 14/2622 | 49/18723 | 5.95e-03 | 3.75e-02 | 14 |
| GO:00072654 | Liver | NAFLD | Ras protein signal transduction | 66/1882 | 337/18723 | 8.43e-08 | 7.09e-06 | 66 |
| GO:00510564 | Liver | NAFLD | regulation of small GTPase mediated signal transduction | 56/1882 | 302/18723 | 4.62e-06 | 1.75e-04 | 56 |
| GO:00430875 | Liver | NAFLD | regulation of GTPase activity | 62/1882 | 348/18723 | 5.65e-06 | 2.03e-04 | 62 |
| Page: 1 2 |
| Pathway ID | Tissue | Disease Stage | Description | Gene Ratio | Bg Ratio | pvalue | p.adjust | qvalue | Count |
| Page: 1 |
Top |
Cell-cell communication analysis |
| Identification of potential cell-cell interactions between two cell types and their ligand-receptor pairs for different disease states |
| Ligand | Receptor | LRpair | Pathway | Tissue | Disease Stage |
| Page: 1 |
Top |
Single-cell gene regulatory network inference analysis |
| Find out the significant the regulons (TFs) and the target genes of each regulon across cell types for different disease states |
| TF | Cell Type | Tissue | Disease Stage | Target Gene | RSS | Regulon Activity |
| ∗The dot plots of a searched regulon are shown for all cell subpopulations in each disease state of each tissue based on the regulon specific score inferred using pySCENIC and by calculating the average expression. |
| Page: 1 |
Top |
Somatic mutation of malignant transformation related genes |
| Annotation of somatic variants for genes involved in malignant transformation |
| Hugo Symbol | Variant Class | Variant Classification | dbSNP RS | HGVSc | HGVSp | HGVSp Short | SWISSPROT | BIOTYPE | SIFT | PolyPhen | Tumor Sample Barcode | Tissue | Histology | Sex | Age | Stage | Therapy Types | Drugs | Outcome |
| CCDC125 | SNV | Missense_Mutation | novel | c.370N>T | p.Val124Leu | p.V124L | Q86Z20 | protein_coding | deleterious(0.05) | benign(0.046) | TCGA-A2-A0CU-01 | Breast | breast invasive carcinoma | Female | >=65 | I/II | Hormone Therapy | tamoxiphen | SD |
| CCDC125 | SNV | Missense_Mutation | novel | c.424G>C | p.Glu142Gln | p.E142Q | Q86Z20 | protein_coding | tolerated(0.06) | benign(0.294) | TCGA-EW-A3E8-01 | Breast | breast invasive carcinoma | Female | <65 | I/II | Hormone Therapy | anastrozole | SD |
| CCDC125 | deletion | Frame_Shift_Del | novel | c.98delN | p.Gly33GlufsTer10 | p.G33Efs*10 | Q86Z20 | protein_coding | TCGA-EW-A2FV-01 | Breast | breast invasive carcinoma | Female | <65 | III/IV | Chemotherapy | docetaxel | SD | ||
| CCDC125 | SNV | Missense_Mutation | c.756N>C | p.Lys252Asn | p.K252N | Q86Z20 | protein_coding | deleterious(0.04) | possibly_damaging(0.59) | TCGA-DR-A0ZM-01 | Cervix | cervical & endocervical cancer | Female | <65 | III/IV | Unspecific | Cisplatin | SD | |
| CCDC125 | SNV | Missense_Mutation | c.1469N>G | p.Ser490Cys | p.S490C | Q86Z20 | protein_coding | tolerated(0.19) | benign(0.35) | TCGA-Q1-A73O-01 | Cervix | cervical & endocervical cancer | Female | <65 | I/II | Chemotherapy | cisplatin | CR | |
| CCDC125 | SNV | Missense_Mutation | c.1137N>C | p.Gln379His | p.Q379H | Q86Z20 | protein_coding | deleterious(0) | probably_damaging(0.939) | TCGA-Q1-A73O-01 | Cervix | cervical & endocervical cancer | Female | <65 | I/II | Chemotherapy | cisplatin | CR | |
| CCDC125 | SNV | Missense_Mutation | c.820N>T | p.Ala274Ser | p.A274S | Q86Z20 | protein_coding | tolerated(0.05) | benign(0.124) | TCGA-AA-3489-01 | Colorectum | colon adenocarcinoma | Male | >=65 | I/II | Unknown | Unknown | PD | |
| CCDC125 | SNV | Missense_Mutation | c.1477N>T | p.Asp493Tyr | p.D493Y | Q86Z20 | protein_coding | deleterious(0.02) | possibly_damaging(0.667) | TCGA-AA-A010-01 | Colorectum | colon adenocarcinoma | Female | <65 | I/II | Chemotherapy | folinic | CR | |
| CCDC125 | SNV | Missense_Mutation | c.75N>C | p.Glu25Asp | p.E25D | Q86Z20 | protein_coding | tolerated(0.96) | benign(0.015) | TCGA-AA-A010-01 | Colorectum | colon adenocarcinoma | Female | <65 | I/II | Chemotherapy | folinic | CR | |
| CCDC125 | SNV | Missense_Mutation | c.346N>C | p.Cys116Arg | p.C116R | Q86Z20 | protein_coding | tolerated(1) | benign(0) | TCGA-AA-A02R-01 | Colorectum | colon adenocarcinoma | Female | >=65 | I/II | Unknown | Unknown | PD |
| Page: 1 2 3 4 5 6 7 |
Top |
Related drugs of malignant transformation related genes |
| Identification of chemicals and drugs interact with genes involved in malignant transfromation |
| (DGIdb 4.0) |
| Entrez ID | Symbol | Category | Interaction Types | Drug Claim Name | Drug Name | PMIDs |
| Page: 1 |

Copyright 2023-Present -The University of Texas Health Science Center at Houston |