
|
|||||
|
 | |
| |
| |
| |
| |
| |
|
Gene: CCDC124 |
Gene summary for CCDC124 |
| Gene information | Species | Human | Gene symbol | CCDC124 | Gene ID | 115098 |
| Gene name | coiled-coil domain containing 124 | |
| Gene Alias | Lso2 | |
| Cytomap | 19p13.11 | |
| Gene Type | protein-coding | GO ID | GO:0007049 | UniProtAcc | A0A024R7M8 |
Top |
Malignant transformation analysis |
| Identification of the aberrant gene expression in precancerous and cancerous lesions by comparing the gene expression of stem-like cells in diseased tissues with normal stem cells |
| Entrez ID | Symbol | Replicates | Species | Organ | Tissue | Adj P-value | Log2FC | Malignancy |
| 115098 | CCDC124 | GSM4909287 | Human | Breast | IDC | 9.48e-05 | 2.79e-01 | 0.2057 |
| 115098 | CCDC124 | GSM4909290 | Human | Breast | IDC | 4.82e-04 | 2.67e-01 | 0.2096 |
| 115098 | CCDC124 | GSM4909296 | Human | Breast | IDC | 2.90e-06 | 3.38e-03 | 0.1524 |
| 115098 | CCDC124 | GSM4909297 | Human | Breast | IDC | 6.62e-07 | -1.92e-01 | 0.1517 |
| 115098 | CCDC124 | GSM4909311 | Human | Breast | IDC | 2.50e-23 | -2.40e-01 | 0.1534 |
| 115098 | CCDC124 | GSM4909312 | Human | Breast | IDC | 1.09e-07 | -1.89e-01 | 0.1552 |
| 115098 | CCDC124 | GSM4909315 | Human | Breast | IDC | 8.66e-07 | 3.26e-01 | 0.21 |
| 115098 | CCDC124 | GSM4909319 | Human | Breast | IDC | 2.45e-28 | -1.21e-01 | 0.1563 |
| 115098 | CCDC124 | GSM4909321 | Human | Breast | IDC | 4.56e-07 | -1.68e-01 | 0.1559 |
| 115098 | CCDC124 | ctrl6 | Human | Breast | Precancer | 3.75e-03 | 3.07e-01 | -0.0061 |
| 115098 | CCDC124 | brca1 | Human | Breast | Precancer | 1.36e-18 | 5.40e-01 | -0.0338 |
| 115098 | CCDC124 | brca2 | Human | Breast | Precancer | 4.86e-07 | 2.33e-01 | -0.024 |
| 115098 | CCDC124 | brca3 | Human | Breast | Precancer | 1.22e-10 | 3.20e-01 | -0.0263 |
| 115098 | CCDC124 | brca10 | Human | Breast | Precancer | 3.66e-18 | 5.10e-01 | -0.0029 |
| 115098 | CCDC124 | NCCBC5 | Human | Breast | DCIS | 1.38e-04 | 5.07e-04 | 0.2046 |
| 115098 | CCDC124 | P1 | Human | Breast | IDC | 2.98e-11 | -1.58e-01 | 0.1527 |
| 115098 | CCDC124 | DCIS2 | Human | Breast | DCIS | 5.23e-46 | 2.86e-03 | 0.0085 |
| 115098 | CCDC124 | LZE4T | Human | Esophagus | ESCC | 7.60e-18 | 5.62e-01 | 0.0811 |
| 115098 | CCDC124 | LZE5T | Human | Esophagus | ESCC | 8.56e-08 | 8.14e-01 | 0.0514 |
| 115098 | CCDC124 | LZE7T | Human | Esophagus | ESCC | 3.42e-29 | 1.55e+00 | 0.0667 |
| Page: 1 2 3 4 5 6 7 8 |
| Tissue | Expression Dynamics | Abbreviation |
| Breast | 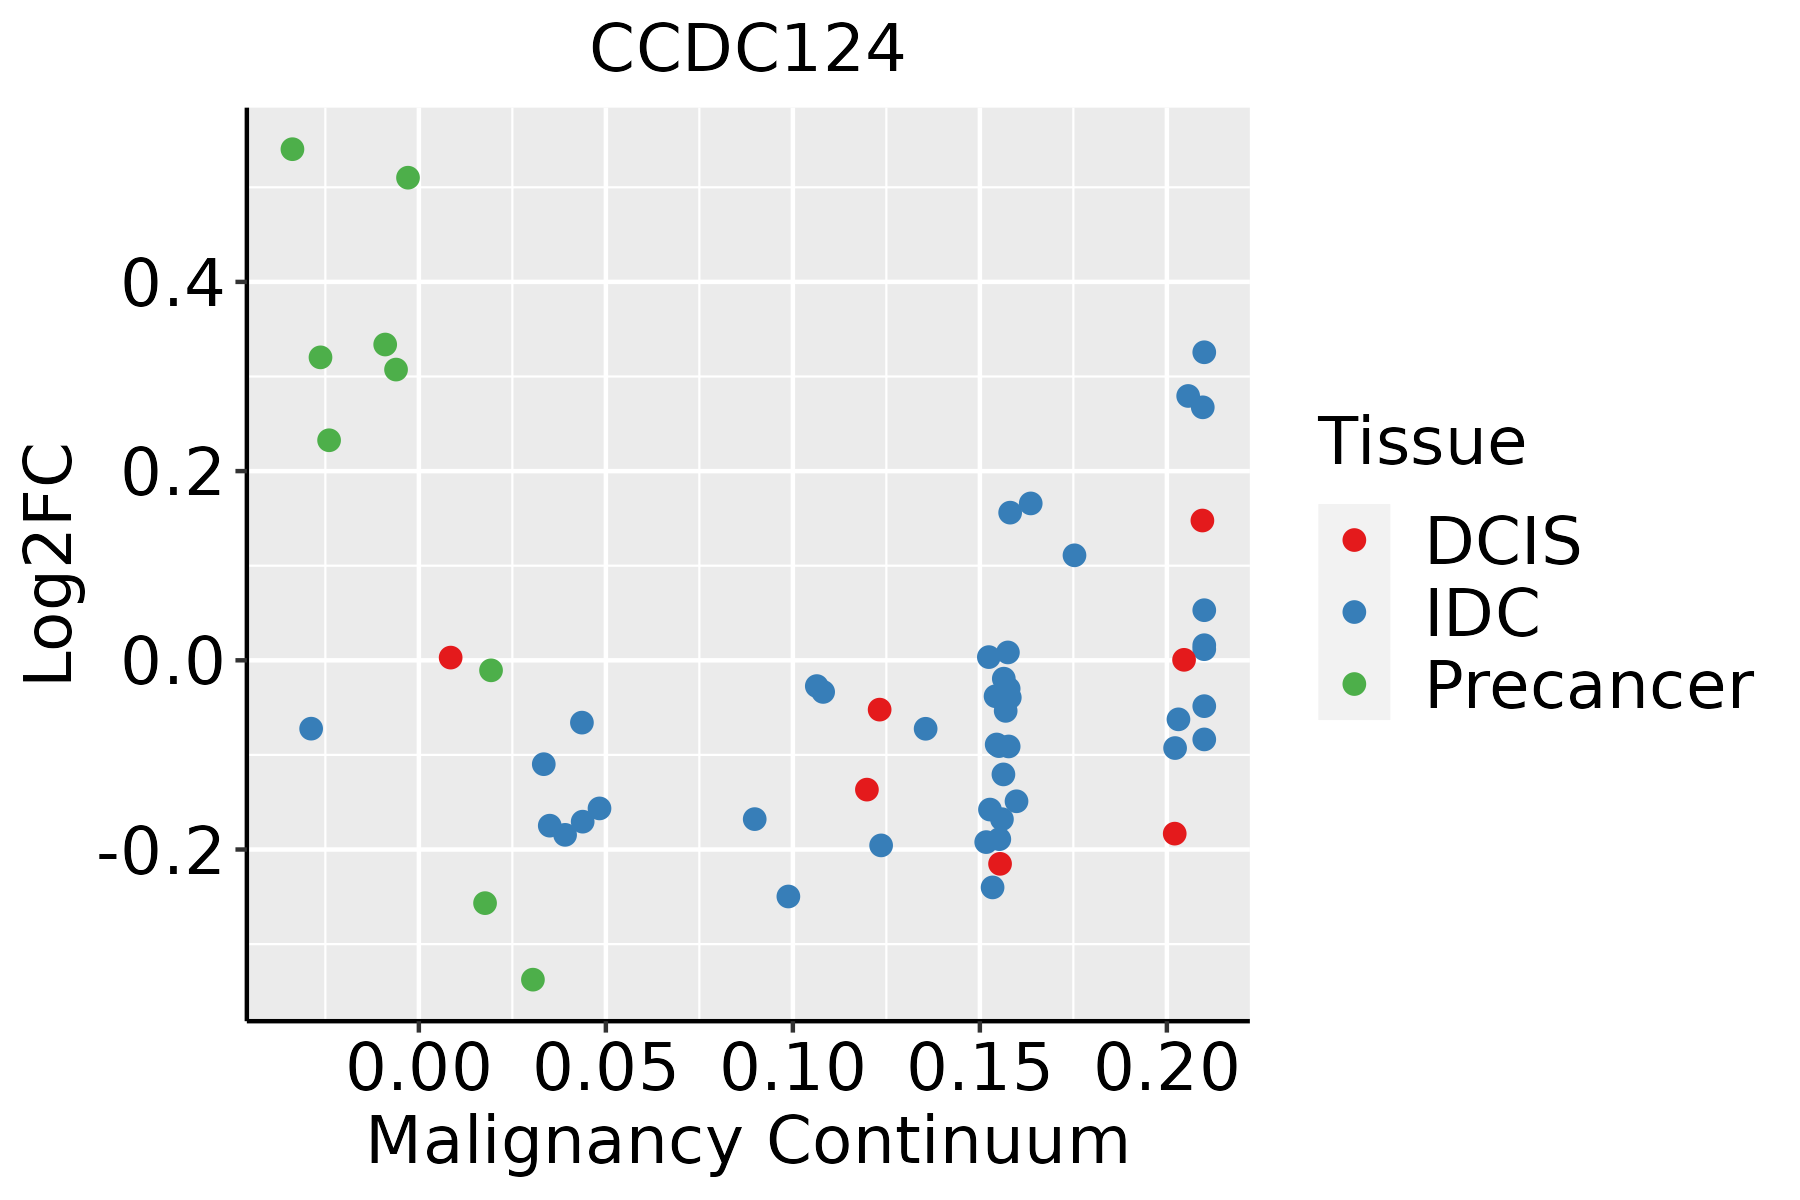 | IDC: Invasive ductal carcinoma |
| DCIS: Ductal carcinoma in situ | ||
| Precancer(BRCA1-mut): Precancerous lesion from BRCA1 mutation carriers | ||
| Esophagus |  | ESCC: Esophageal squamous cell carcinoma |
| HGIN: High-grade intraepithelial neoplasias | ||
| LGIN: Low-grade intraepithelial neoplasias | ||
| Liver | 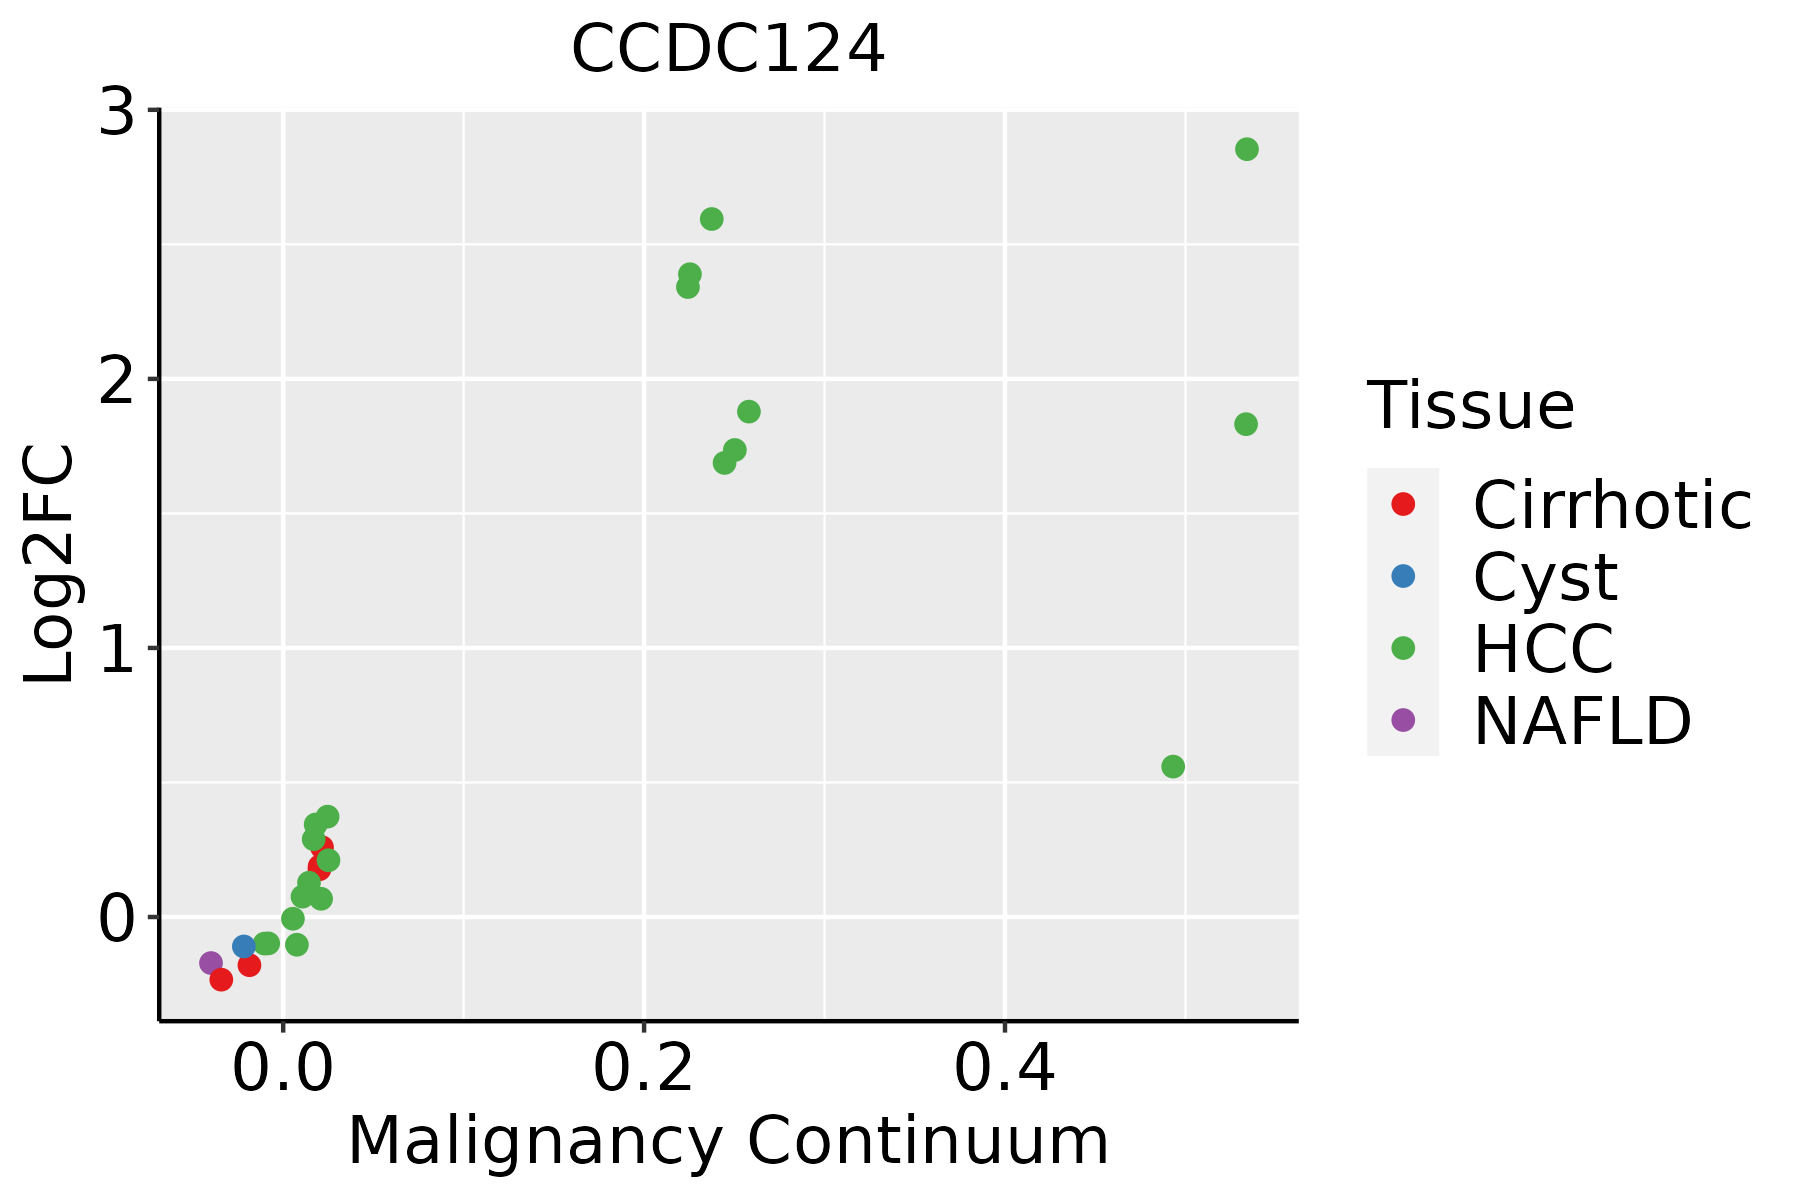 | HCC: Hepatocellular carcinoma |
| NAFLD: Non-alcoholic fatty liver disease | ||
| Oral Cavity | 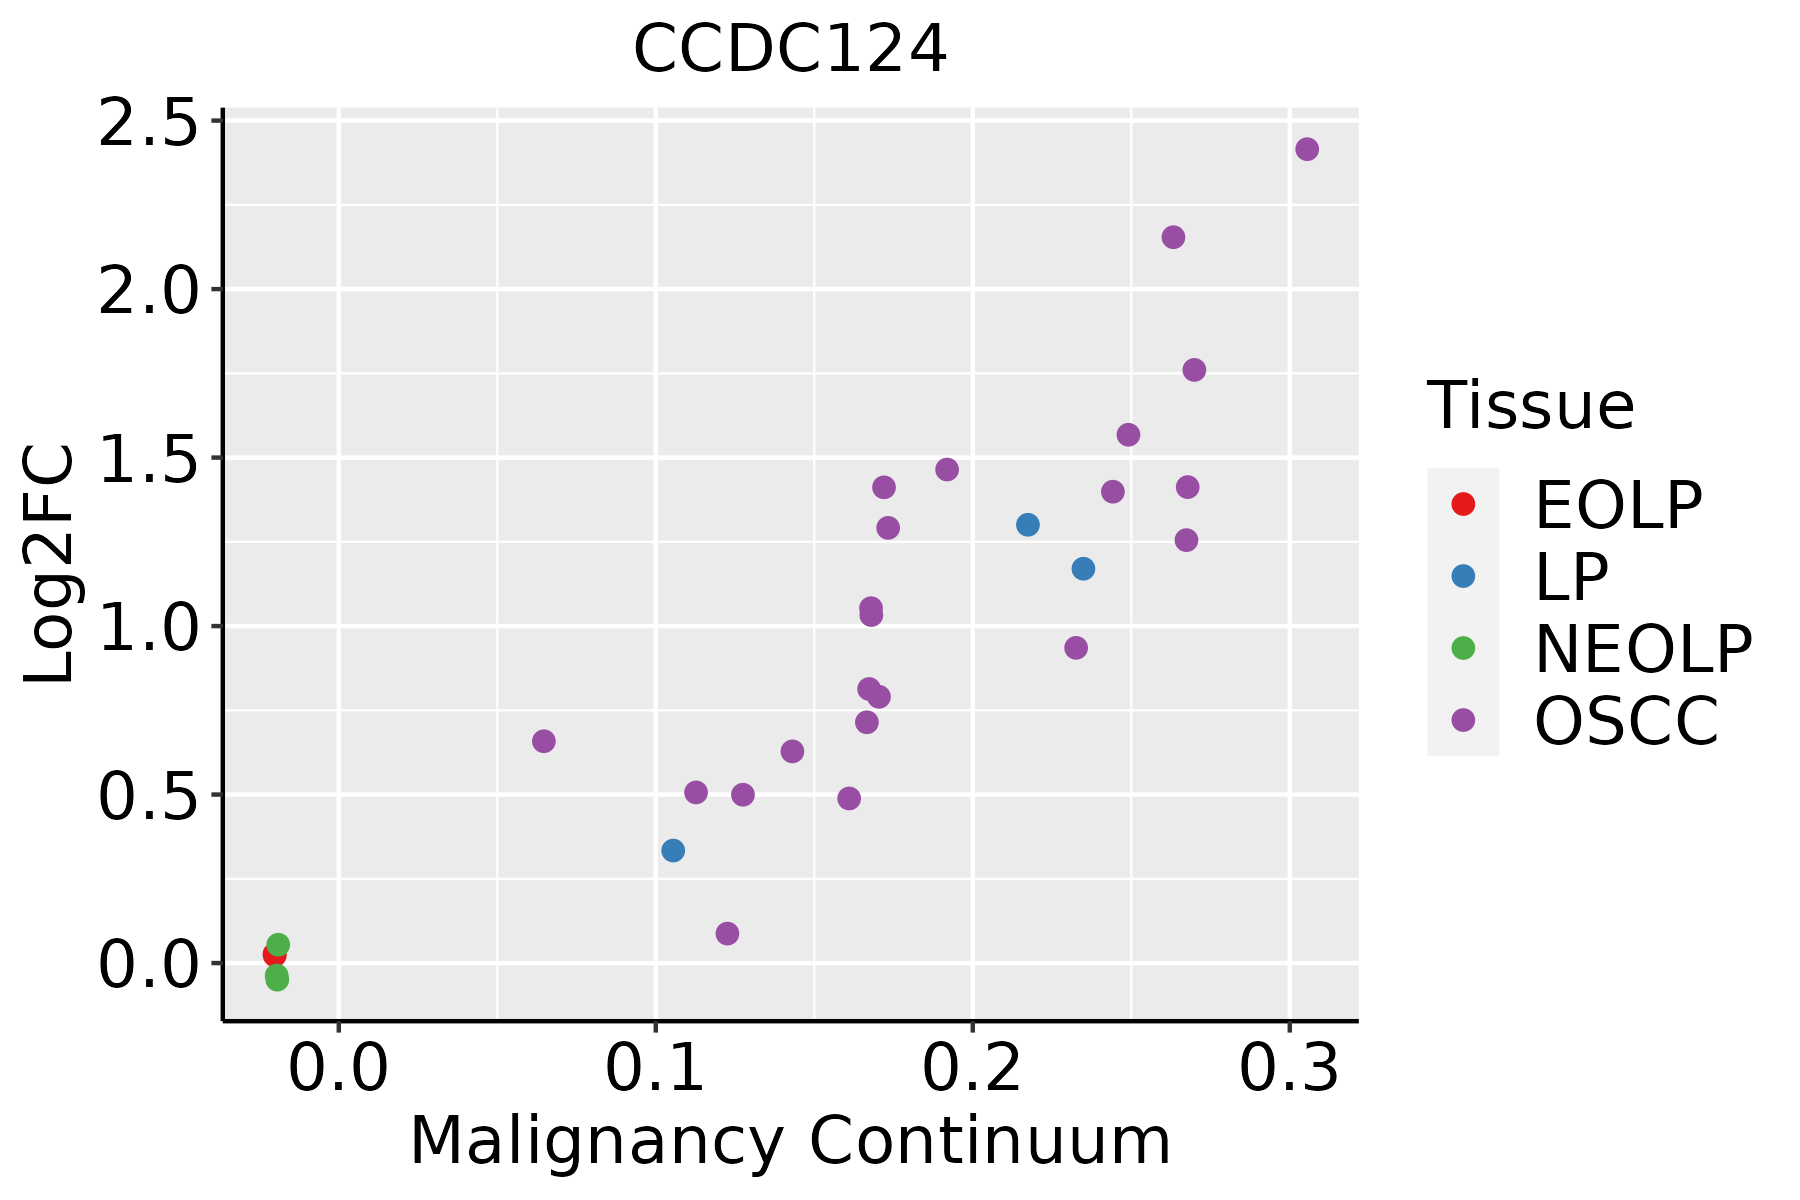 | EOLP: Erosive Oral lichen planus |
| LP: leukoplakia | ||
| NEOLP: Non-erosive oral lichen planus | ||
| OSCC: Oral squamous cell carcinoma | ||
| Skin | 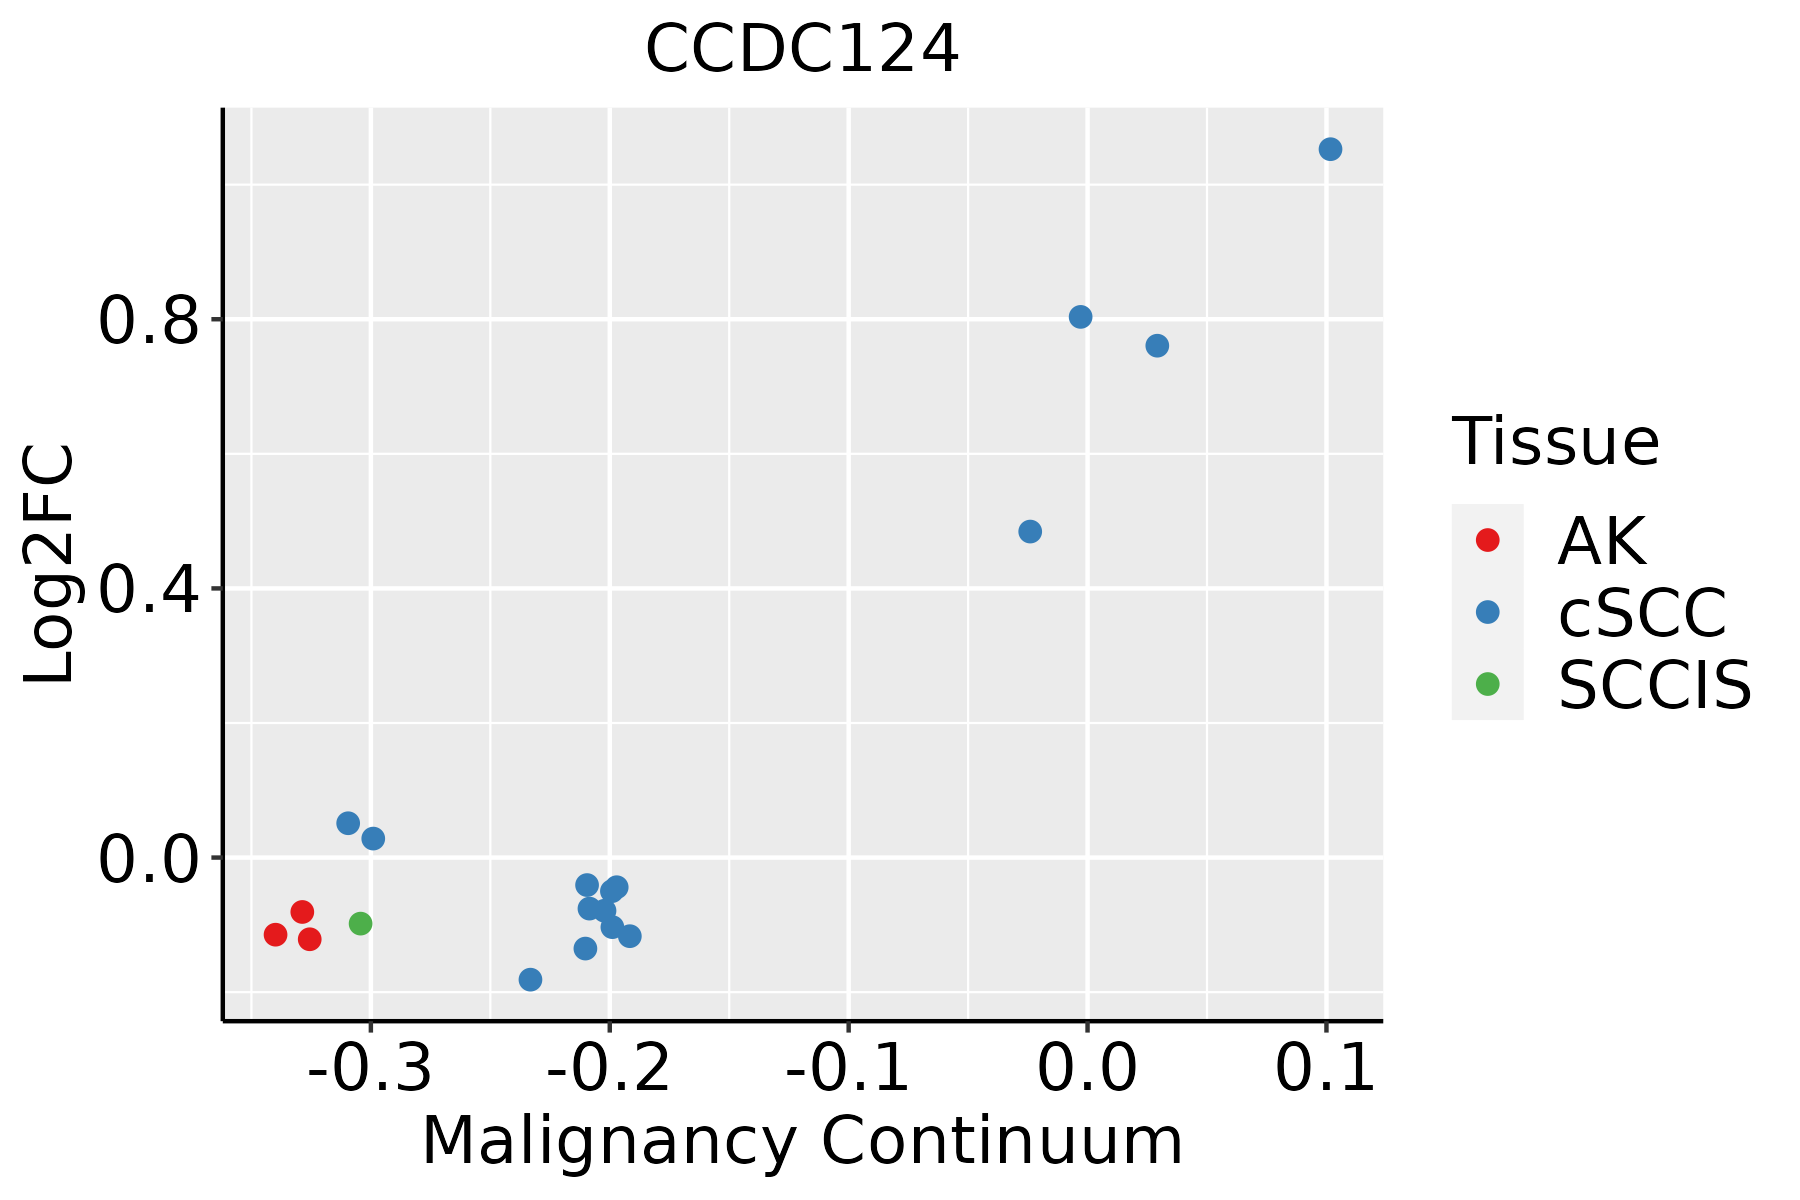 | AK: Actinic keratosis |
| cSCC: Cutaneous squamous cell carcinoma | ||
| SCCIS:squamous cell carcinoma in situ | ||
| Thyroid | 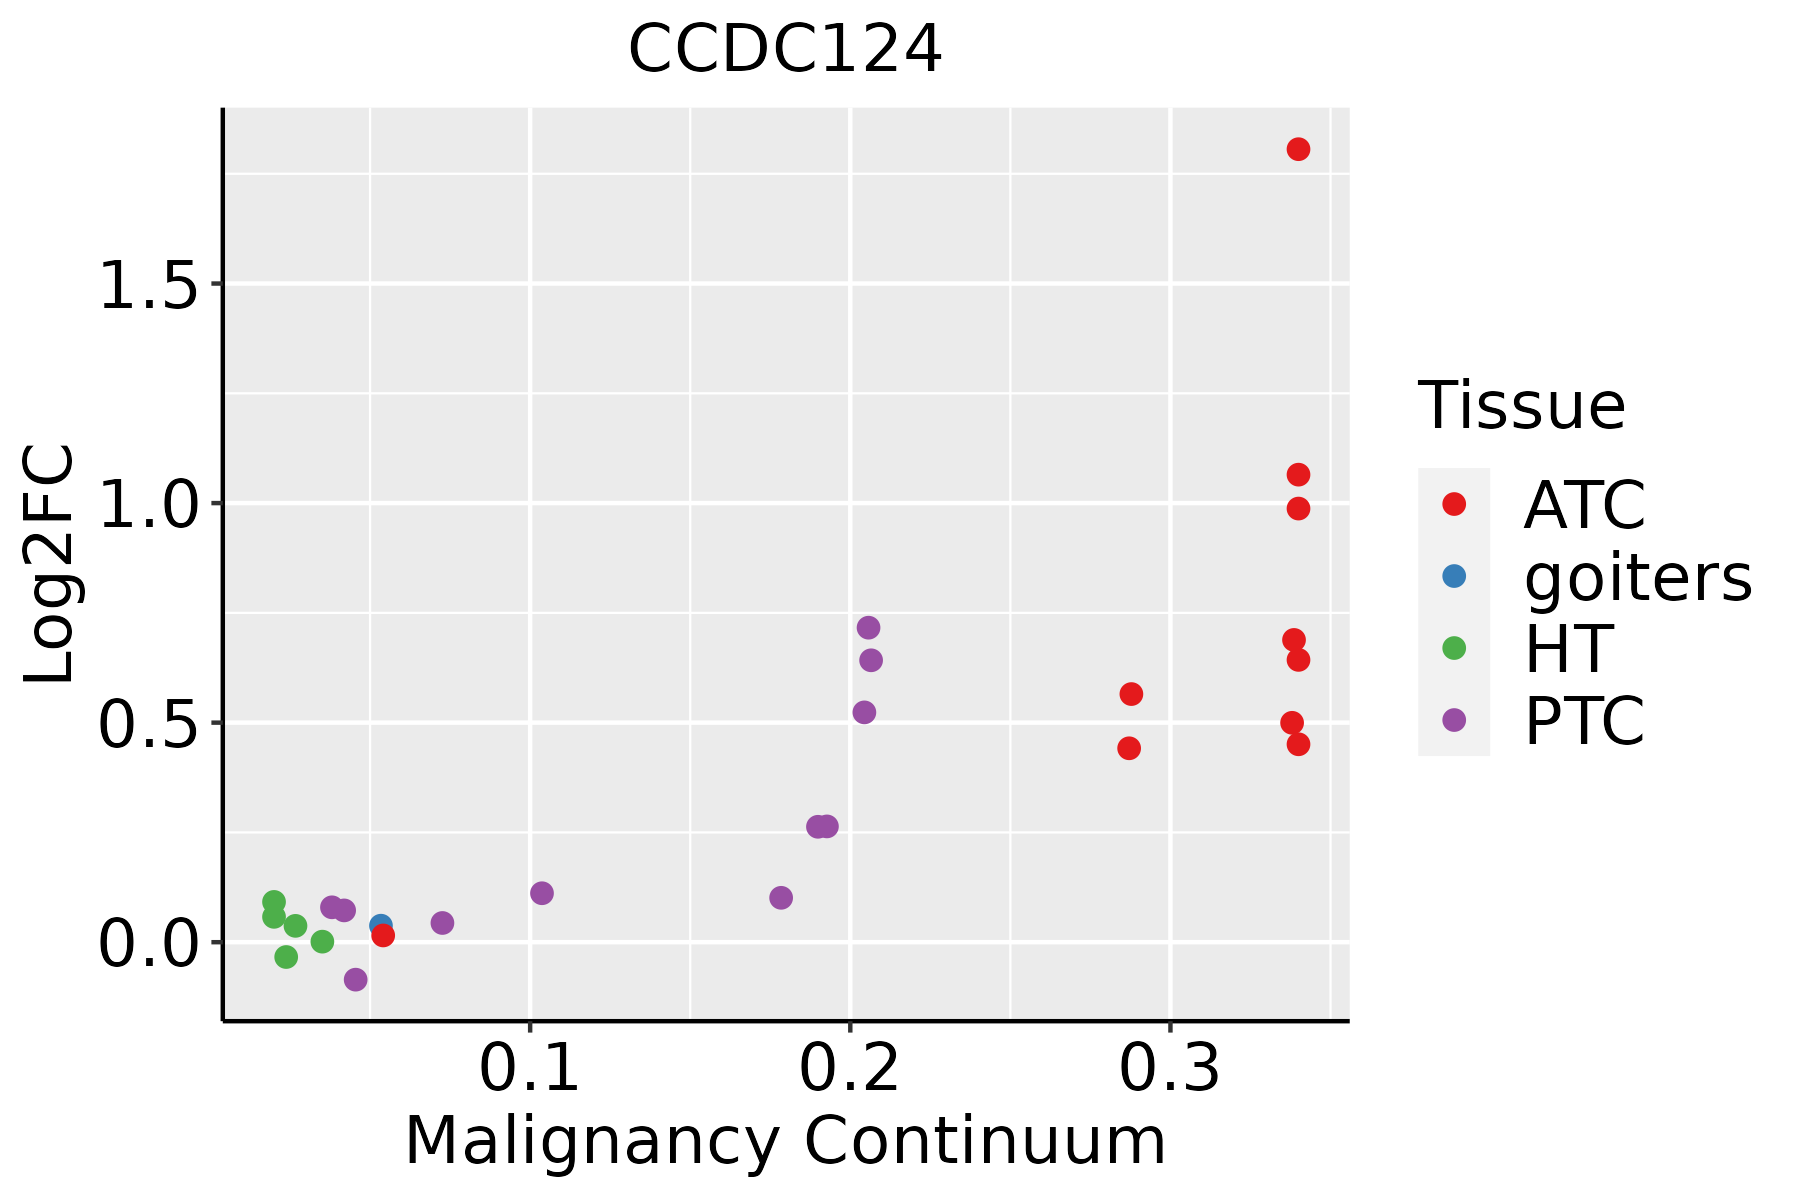 | ATC: Anaplastic thyroid cancer |
| HT: Hashimoto's thyroiditis | ||
| PTC: Papillary thyroid cancer |
| ∗log2FC in expression of this searched gene in stem-like cells from each diseased tissue sample relative to stem-like cells in normal samples in each tissue plotted against the malignancy continuum. Samples are colored based on if they are from different disease stage. |
Top |
Malignant transformation related pathway analysis |
| Find out the enriched GO biological processes and KEGG pathways involved in transition from healthy to precancer to cancer |
| Tissue | Disease Stage | Enriched GO biological Processes |
| Colorectum | AD |  |
| Colorectum | SER |  |
| Colorectum | MSS |  |
| Colorectum | MSI-H |  |
| Colorectum | FAP |  |
| ∗Top 15 enriched GO BP terms are showed in the bar plot of each disease state in each tissue. Each row represents a significant GO biological process which is colored according to the -log10(p.adjust). |
| Page: 1 2 3 4 5 6 7 8 9 |
| GO ID | Tissue | Disease Stage | Description | Gene Ratio | Bg Ratio | pvalue | p.adjust | Count |
| Page: 1 |
| Pathway ID | Tissue | Disease Stage | Description | Gene Ratio | Bg Ratio | pvalue | p.adjust | qvalue | Count |
| Page: 1 |
Top |
Cell-cell communication analysis |
| Identification of potential cell-cell interactions between two cell types and their ligand-receptor pairs for different disease states |
| Ligand | Receptor | LRpair | Pathway | Tissue | Disease Stage |
| Page: 1 |
Top |
Single-cell gene regulatory network inference analysis |
| Find out the significant the regulons (TFs) and the target genes of each regulon across cell types for different disease states |
| TF | Cell Type | Tissue | Disease Stage | Target Gene | RSS | Regulon Activity |
| ∗The dot plots of a searched regulon are shown for all cell subpopulations in each disease state of each tissue based on the regulon specific score inferred using pySCENIC and by calculating the average expression. |
| Page: 1 |
Top |
Somatic mutation of malignant transformation related genes |
| Annotation of somatic variants for genes involved in malignant transformation |
| Hugo Symbol | Variant Class | Variant Classification | dbSNP RS | HGVSc | HGVSp | HGVSp Short | SWISSPROT | BIOTYPE | SIFT | PolyPhen | Tumor Sample Barcode | Tissue | Histology | Sex | Age | Stage | Therapy Types | Drugs | Outcome |
| CCDC124 | SNV | Missense_Mutation | novel | c.178C>T | p.Arg60Cys | p.R60C | Q96CT7 | protein_coding | deleterious(0) | probably_damaging(0.974) | TCGA-UL-AAZ6-01 | Breast | breast invasive carcinoma | Female | >=65 | I/II | Chemotherapy | herceptin | SD |
| CCDC124 | insertion | Frame_Shift_Ins | novel | c.131_132insGTGGAGATGGGGTTTTGCCGTGTTGGCC | p.His45TrpfsTer32 | p.H45Wfs*32 | Q96CT7 | protein_coding | TCGA-B6-A0IA-01 | Breast | breast invasive carcinoma | Female | <65 | I/II | Unknown | Unknown | SD | ||
| CCDC124 | SNV | Missense_Mutation | novel | c.431N>T | p.Ala144Val | p.A144V | Q96CT7 | protein_coding | deleterious(0) | possibly_damaging(0.84) | TCGA-2W-A8YY-01 | Cervix | cervical & endocervical cancer | Female | <65 | I/II | Chemotherapy | cisplatin | CR |
| CCDC124 | SNV | Missense_Mutation | novel | c.559N>C | p.Glu187Gln | p.E187Q | Q96CT7 | protein_coding | deleterious(0.02) | possibly_damaging(0.848) | TCGA-C5-A8YQ-01 | Cervix | cervical & endocervical cancer | Female | >=65 | I/II | Chemotherapy | cisplatin | PD |
| CCDC124 | SNV | Missense_Mutation | novel | c.424N>A | p.Val142Met | p.V142M | Q96CT7 | protein_coding | tolerated(0.17) | possibly_damaging(0.628) | TCGA-AA-3531-01 | Colorectum | colon adenocarcinoma | Female | >=65 | I/II | Unknown | Unknown | SD |
| CCDC124 | SNV | Missense_Mutation | rs762625853 | c.176N>A | p.Arg59Gln | p.R59Q | Q96CT7 | protein_coding | deleterious(0.01) | benign(0.089) | TCGA-D5-6530-01 | Colorectum | colon adenocarcinoma | Male | <65 | I/II | Unknown | Unknown | SD |
| CCDC124 | SNV | Missense_Mutation | rs778475492 | c.124N>A | p.Asp42Asn | p.D42N | Q96CT7 | protein_coding | tolerated(0.13) | benign(0.006) | TCGA-D5-6928-01 | Colorectum | colon adenocarcinoma | Male | >=65 | I/II | Unknown | Unknown | SD |
| CCDC124 | SNV | Missense_Mutation | c.212N>G | p.Gln71Arg | p.Q71R | Q96CT7 | protein_coding | tolerated(0.27) | benign(0.015) | TCGA-NH-A5IV-01 | Colorectum | colon adenocarcinoma | Female | >=65 | I/II | Unknown | Unknown | SD | |
| CCDC124 | SNV | Missense_Mutation | rs758756227 | c.127N>A | p.Asp43Asn | p.D43N | Q96CT7 | protein_coding | deleterious(0.03) | probably_damaging(0.955) | TCGA-EI-6882-01 | Colorectum | rectum adenocarcinoma | Male | <65 | I/II | Unknown | Unknown | SD |
| CCDC124 | SNV | Missense_Mutation | c.337N>A | p.Ala113Thr | p.A113T | Q96CT7 | protein_coding | tolerated(0.55) | benign(0.001) | TCGA-F5-6812-01 | Colorectum | rectum adenocarcinoma | Male | >=65 | I/II | Unknown | Unknown | SD |
| Page: 1 2 3 |
Top |
Related drugs of malignant transformation related genes |
| Identification of chemicals and drugs interact with genes involved in malignant transfromation |
| (DGIdb 4.0) |
| Entrez ID | Symbol | Category | Interaction Types | Drug Claim Name | Drug Name | PMIDs |
| Page: 1 |

Copyright 2023-Present -The University of Texas Health Science Center at Houston |