
|
|||||
|
 | |
| |
| |
| |
| |
| |
|
Gene: CCDC115 |
Gene summary for CCDC115 |
| Gene information | Species | Human | Gene symbol | CCDC115 | Gene ID | 84317 |
| Gene name | coiled-coil domain containing 115 | |
| Gene Alias | CDG2O | |
| Cytomap | 2q21.1 | |
| Gene Type | protein-coding | GO ID | GO:0006807 | UniProtAcc | B8ZZ99 |
Top |
Malignant transformation analysis |
| Identification of the aberrant gene expression in precancerous and cancerous lesions by comparing the gene expression of stem-like cells in diseased tissues with normal stem cells |
| Entrez ID | Symbol | Replicates | Species | Organ | Tissue | Adj P-value | Log2FC | Malignancy |
| 84317 | CCDC115 | HTA11_3410_2000001011 | Human | Colorectum | AD | 1.93e-03 | 1.73e-01 | 0.0155 |
| 84317 | CCDC115 | HTA11_1938_2000001011 | Human | Colorectum | AD | 7.48e-03 | 2.19e-01 | -0.0811 |
| 84317 | CCDC115 | HTA11_78_2000001011 | Human | Colorectum | AD | 6.68e-06 | 2.90e-01 | -0.1088 |
| 84317 | CCDC115 | HTA11_347_2000001011 | Human | Colorectum | AD | 1.09e-16 | 4.18e-01 | -0.1954 |
| 84317 | CCDC115 | HTA11_411_2000001011 | Human | Colorectum | SER | 1.13e-05 | 5.03e-01 | -0.2602 |
| 84317 | CCDC115 | HTA11_83_2000001011 | Human | Colorectum | SER | 4.23e-02 | 2.36e-01 | -0.1526 |
| 84317 | CCDC115 | HTA11_1391_2000001011 | Human | Colorectum | AD | 7.05e-05 | 2.56e-01 | -0.059 |
| 84317 | CCDC115 | HTA11_7862_2000001011 | Human | Colorectum | AD | 2.44e-02 | 2.70e-01 | -0.0179 |
| 84317 | CCDC115 | HTA11_866_3004761011 | Human | Colorectum | AD | 1.04e-11 | 3.85e-01 | 0.096 |
| 84317 | CCDC115 | HTA11_8622_2000001021 | Human | Colorectum | SER | 1.33e-04 | 3.30e-01 | 0.0528 |
| 84317 | CCDC115 | HTA11_7696_3000711011 | Human | Colorectum | AD | 1.26e-07 | 2.87e-01 | 0.0674 |
| 84317 | CCDC115 | HTA11_99999970781_79442 | Human | Colorectum | MSS | 9.32e-18 | 4.91e-01 | 0.294 |
| 84317 | CCDC115 | HTA11_99999965104_69814 | Human | Colorectum | MSS | 7.59e-09 | 3.64e-01 | 0.281 |
| 84317 | CCDC115 | HTA11_99999971662_82457 | Human | Colorectum | MSS | 3.24e-14 | 4.06e-01 | 0.3859 |
| 84317 | CCDC115 | HTA11_99999974143_84620 | Human | Colorectum | MSS | 1.16e-05 | 2.32e-01 | 0.3005 |
| 84317 | CCDC115 | LZE4T | Human | Esophagus | ESCC | 2.91e-12 | 4.43e-01 | 0.0811 |
| 84317 | CCDC115 | LZE5T | Human | Esophagus | ESCC | 1.64e-07 | 4.11e-01 | 0.0514 |
| 84317 | CCDC115 | LZE7T | Human | Esophagus | ESCC | 2.15e-05 | 6.22e-01 | 0.0667 |
| 84317 | CCDC115 | LZE8T | Human | Esophagus | ESCC | 5.49e-03 | 2.20e-01 | 0.067 |
| 84317 | CCDC115 | LZE20T | Human | Esophagus | ESCC | 3.07e-07 | 4.83e-01 | 0.0662 |
| Page: 1 2 3 4 5 6 |
| Tissue | Expression Dynamics | Abbreviation |
| Colorectum (GSE201348) |  | FAP: Familial adenomatous polyposis |
| CRC: Colorectal cancer | ||
| Colorectum (HTA11) |  | AD: Adenomas |
| SER: Sessile serrated lesions | ||
| MSI-H: Microsatellite-high colorectal cancer | ||
| MSS: Microsatellite stable colorectal cancer | ||
| Esophagus | 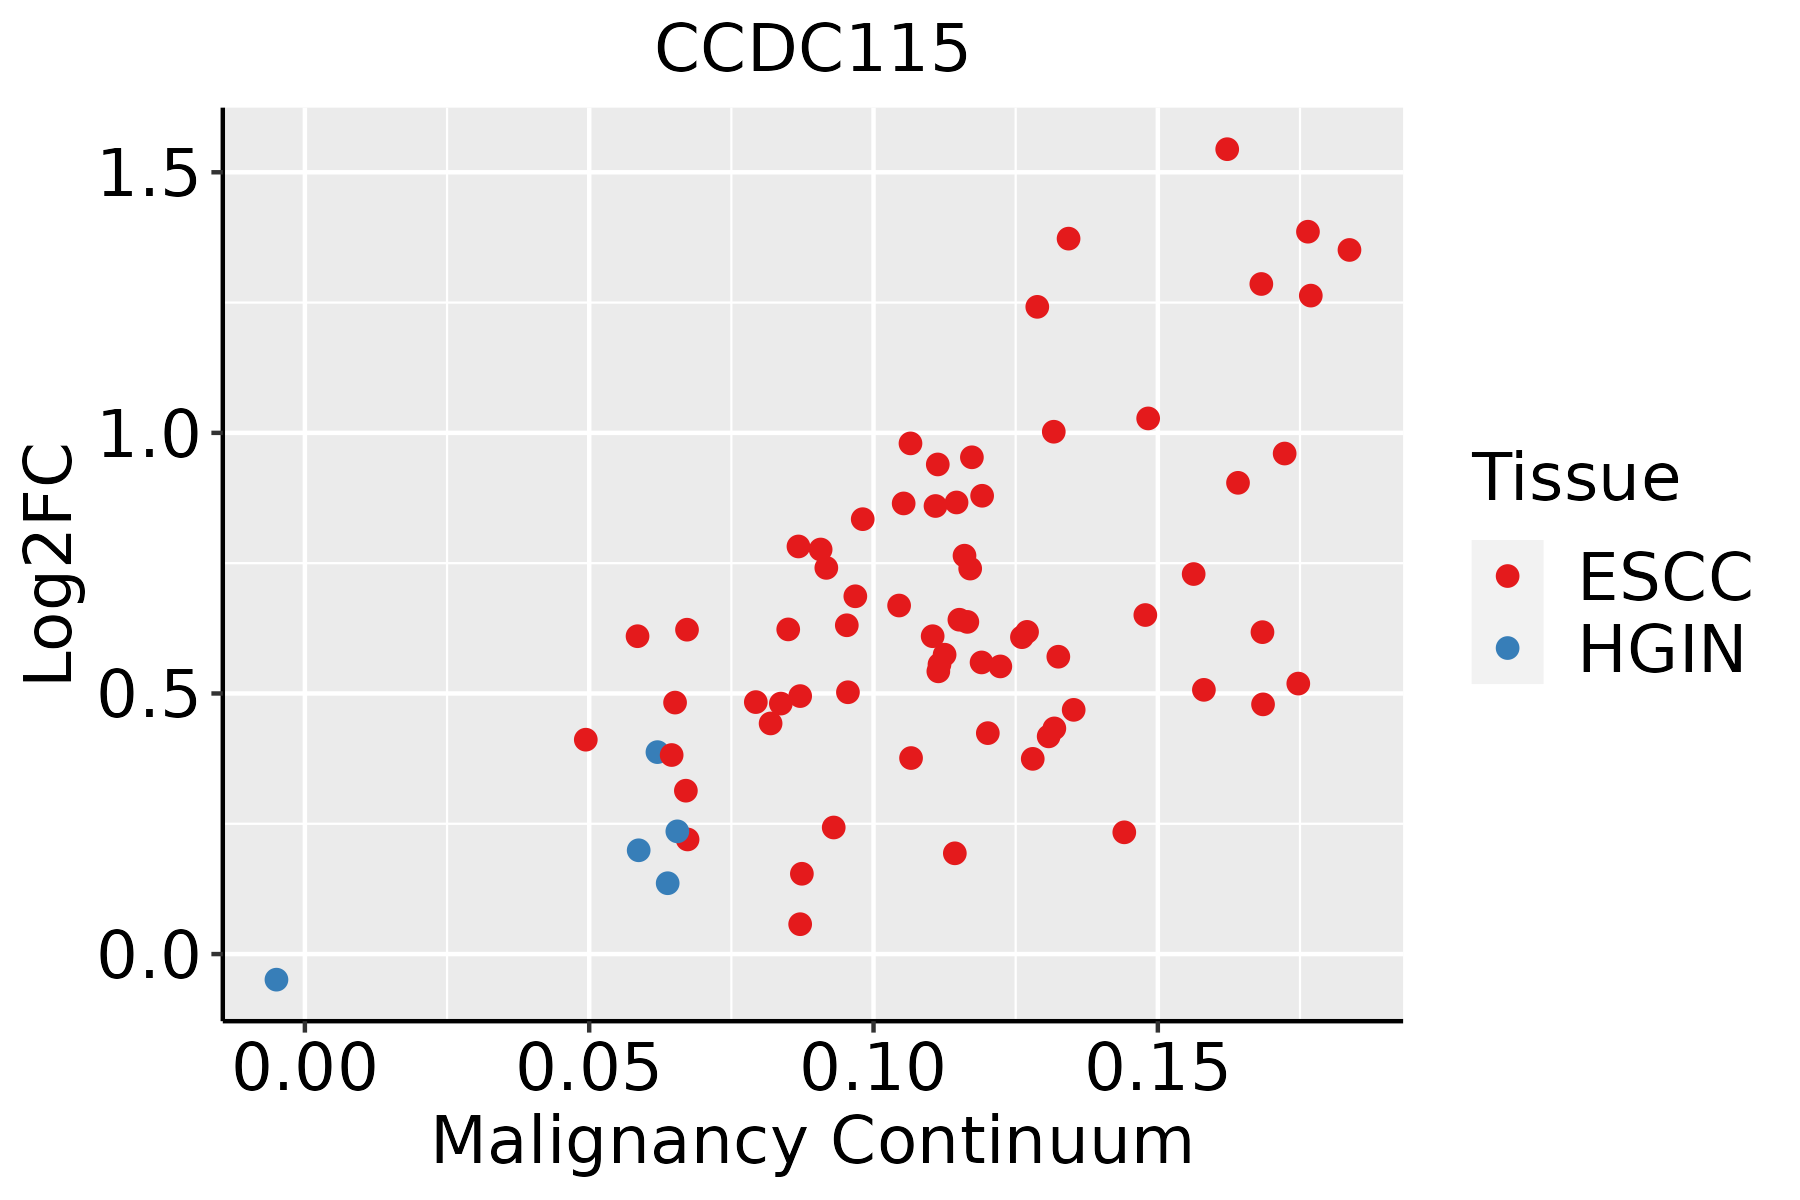 | ESCC: Esophageal squamous cell carcinoma |
| HGIN: High-grade intraepithelial neoplasias | ||
| LGIN: Low-grade intraepithelial neoplasias | ||
| Oral Cavity | 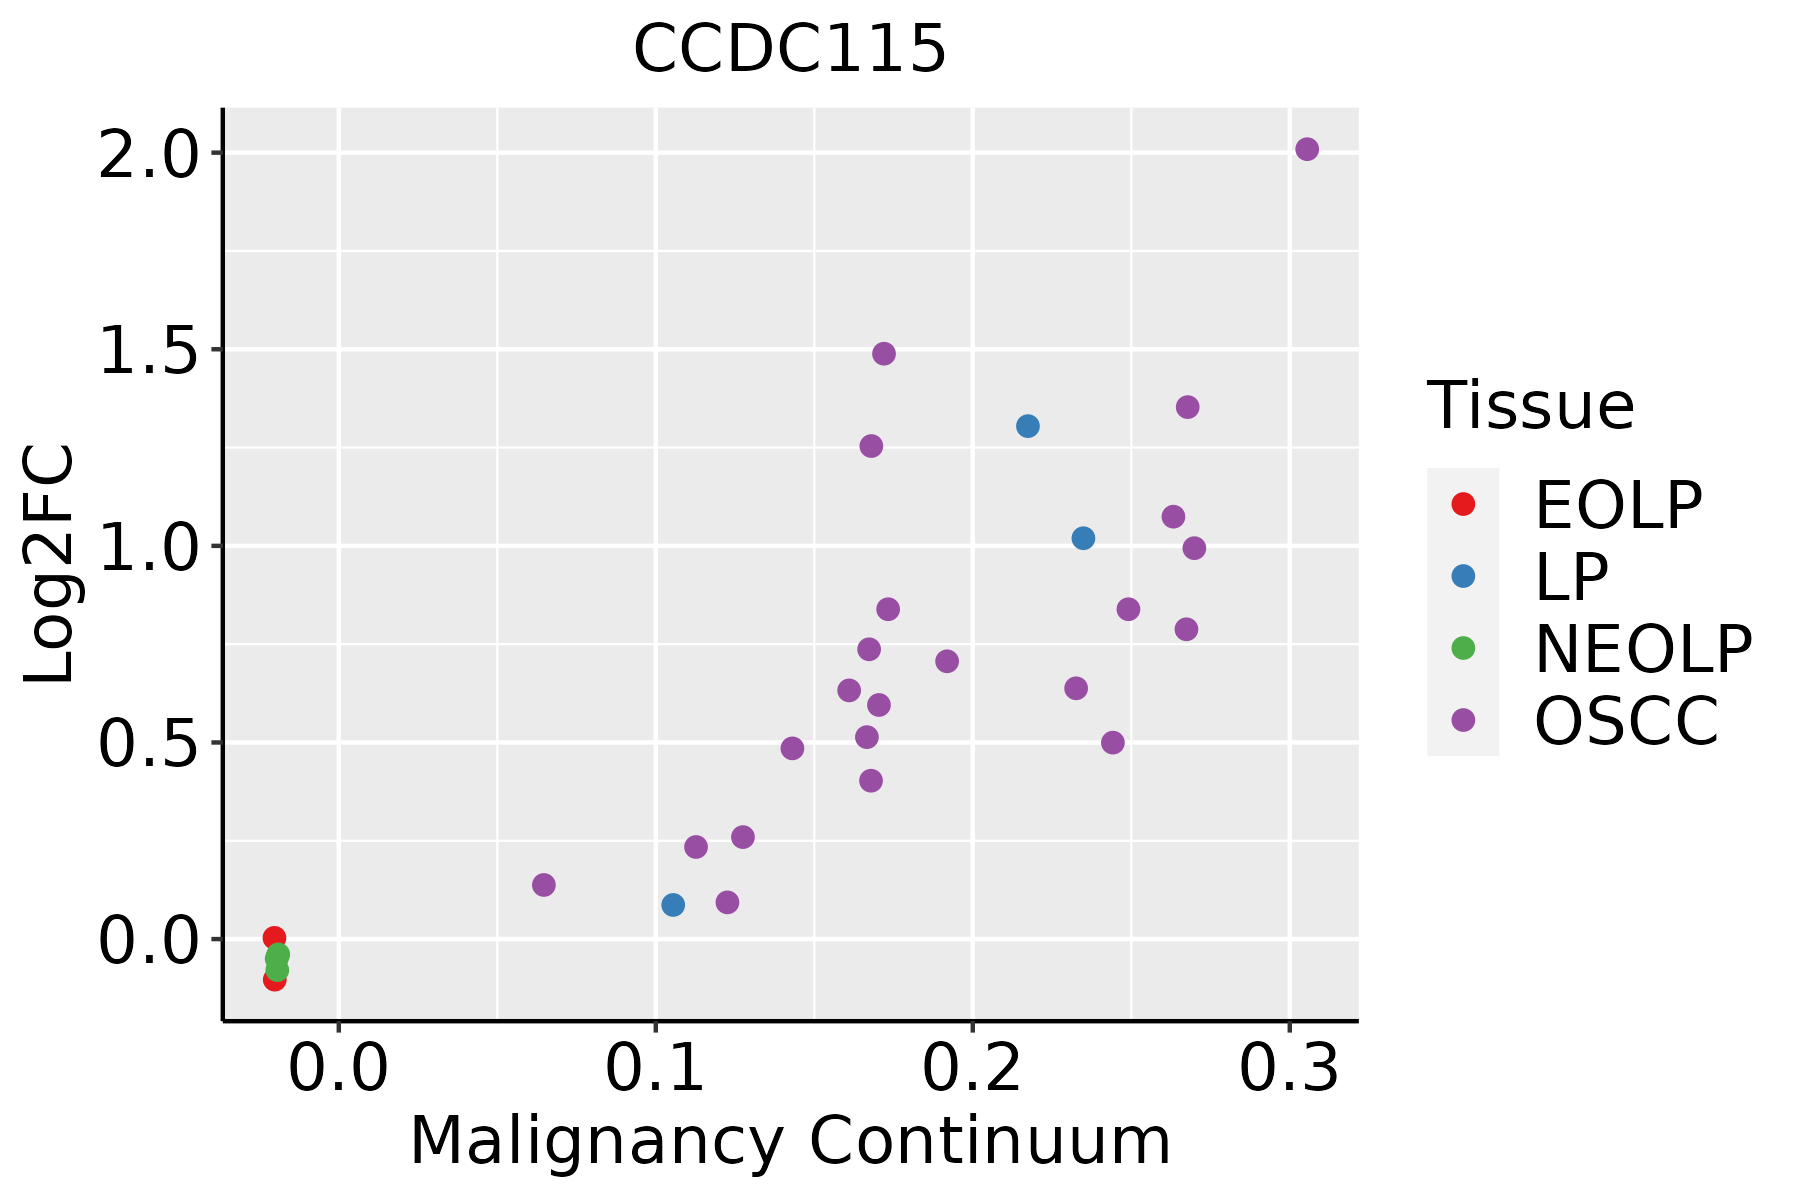 | EOLP: Erosive Oral lichen planus |
| LP: leukoplakia | ||
| NEOLP: Non-erosive oral lichen planus | ||
| OSCC: Oral squamous cell carcinoma | ||
| Skin |  | AK: Actinic keratosis |
| cSCC: Cutaneous squamous cell carcinoma | ||
| SCCIS:squamous cell carcinoma in situ | ||
| Thyroid | 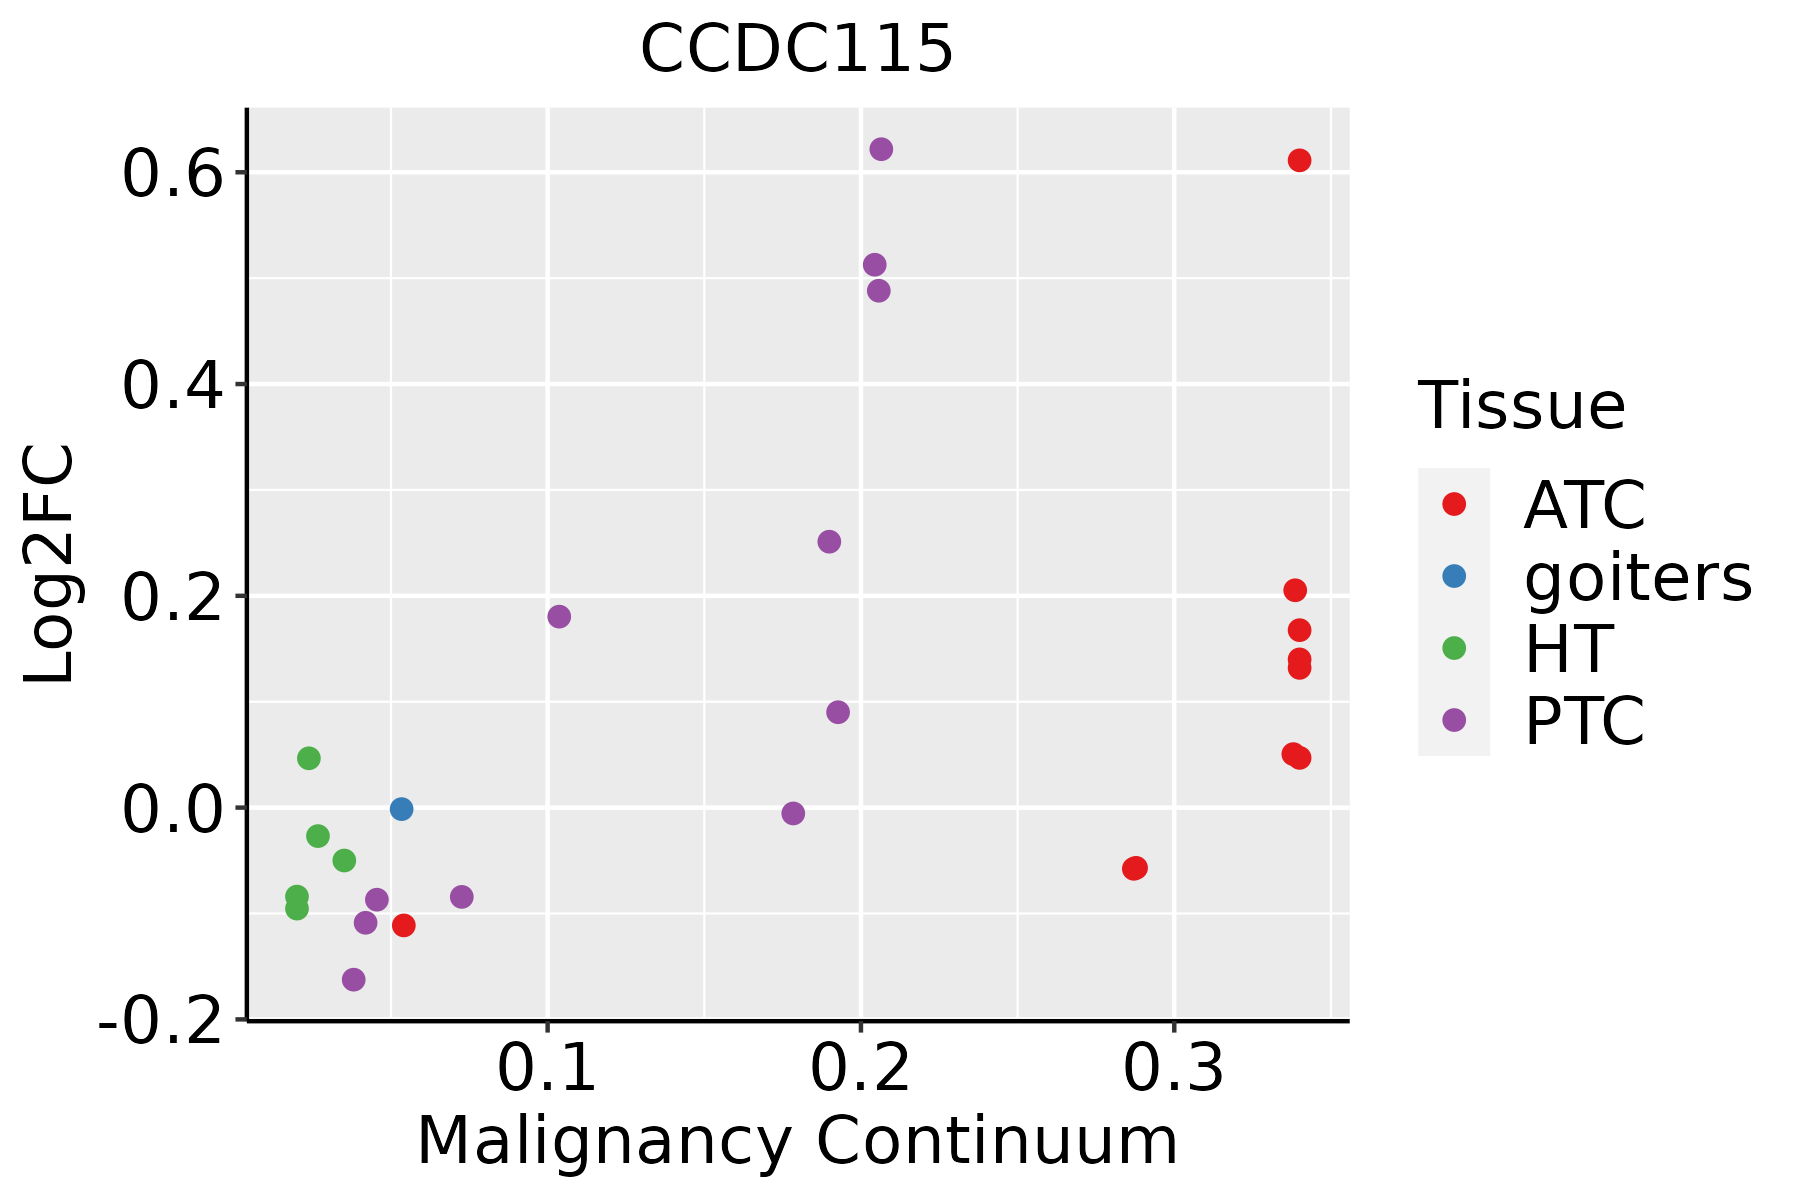 | ATC: Anaplastic thyroid cancer |
| HT: Hashimoto's thyroiditis | ||
| PTC: Papillary thyroid cancer |
| ∗log2FC in expression of this searched gene in stem-like cells from each diseased tissue sample relative to stem-like cells in normal samples in each tissue plotted against the malignancy continuum. Samples are colored based on if they are from different disease stage. |
Top |
Malignant transformation related pathway analysis |
| Find out the enriched GO biological processes and KEGG pathways involved in transition from healthy to precancer to cancer |
| Tissue | Disease Stage | Enriched GO biological Processes |
| Colorectum | AD |  |
| Colorectum | SER |  |
| Colorectum | MSS |  |
| Colorectum | MSI-H |  |
| Colorectum | FAP |  |
| ∗Top 15 enriched GO BP terms are showed in the bar plot of each disease state in each tissue. Each row represents a significant GO biological process which is colored according to the -log10(p.adjust). |
| Page: 1 2 3 4 5 6 7 8 9 |
| GO ID | Tissue | Disease Stage | Description | Gene Ratio | Bg Ratio | pvalue | p.adjust | Count |
| GO:0055076 | Colorectum | AD | transition metal ion homeostasis | 53/3918 | 138/18723 | 1.89e-06 | 5.65e-05 | 53 |
| GO:0046916 | Colorectum | AD | cellular transition metal ion homeostasis | 43/3918 | 115/18723 | 3.62e-05 | 6.56e-04 | 43 |
| GO:0055072 | Colorectum | AD | iron ion homeostasis | 32/3918 | 85/18723 | 2.97e-04 | 3.60e-03 | 32 |
| GO:0070482 | Colorectum | AD | response to oxygen levels | 99/3918 | 347/18723 | 4.29e-04 | 4.82e-03 | 99 |
| GO:0036295 | Colorectum | AD | cellular response to increased oxygen levels | 9/3918 | 14/18723 | 5.43e-04 | 5.79e-03 | 9 |
| GO:0030004 | Colorectum | AD | cellular monovalent inorganic cation homeostasis | 36/3918 | 103/18723 | 6.80e-04 | 6.95e-03 | 36 |
| GO:0071453 | Colorectum | AD | cellular response to oxygen levels | 55/3918 | 177/18723 | 9.48e-04 | 8.96e-03 | 55 |
| GO:0030641 | Colorectum | AD | regulation of cellular pH | 29/3918 | 81/18723 | 1.42e-03 | 1.22e-02 | 29 |
| GO:0006879 | Colorectum | AD | cellular iron ion homeostasis | 25/3918 | 67/18723 | 1.51e-03 | 1.27e-02 | 25 |
| GO:0051453 | Colorectum | AD | regulation of intracellular pH | 26/3918 | 75/18723 | 4.04e-03 | 2.82e-02 | 26 |
| GO:0007033 | Colorectum | AD | vacuole organization | 53/3918 | 180/18723 | 4.18e-03 | 2.89e-02 | 53 |
| GO:0006885 | Colorectum | AD | regulation of pH | 30/3918 | 91/18723 | 4.95e-03 | 3.32e-02 | 30 |
| GO:0055067 | Colorectum | AD | monovalent inorganic cation homeostasis | 45/3918 | 151/18723 | 6.19e-03 | 3.88e-02 | 45 |
| GO:00550761 | Colorectum | SER | transition metal ion homeostasis | 41/2897 | 138/18723 | 1.66e-05 | 5.05e-04 | 41 |
| GO:00300041 | Colorectum | SER | cellular monovalent inorganic cation homeostasis | 31/2897 | 103/18723 | 1.31e-04 | 2.66e-03 | 31 |
| GO:00704821 | Colorectum | SER | response to oxygen levels | 79/2897 | 347/18723 | 1.99e-04 | 3.64e-03 | 79 |
| GO:00469161 | Colorectum | SER | cellular transition metal ion homeostasis | 33/2897 | 115/18723 | 2.20e-04 | 3.89e-03 | 33 |
| GO:00306411 | Colorectum | SER | regulation of cellular pH | 24/2897 | 81/18723 | 9.20e-04 | 1.11e-02 | 24 |
| GO:00550721 | Colorectum | SER | iron ion homeostasis | 24/2897 | 85/18723 | 1.91e-03 | 1.93e-02 | 24 |
| GO:00550671 | Colorectum | SER | monovalent inorganic cation homeostasis | 37/2897 | 151/18723 | 2.48e-03 | 2.33e-02 | 37 |
| Page: 1 2 3 4 5 6 |
| Pathway ID | Tissue | Disease Stage | Description | Gene Ratio | Bg Ratio | pvalue | p.adjust | qvalue | Count |
| Page: 1 |
Top |
Cell-cell communication analysis |
| Identification of potential cell-cell interactions between two cell types and their ligand-receptor pairs for different disease states |
| Ligand | Receptor | LRpair | Pathway | Tissue | Disease Stage |
| Page: 1 |
Top |
Single-cell gene regulatory network inference analysis |
| Find out the significant the regulons (TFs) and the target genes of each regulon across cell types for different disease states |
| TF | Cell Type | Tissue | Disease Stage | Target Gene | RSS | Regulon Activity |
| ∗The dot plots of a searched regulon are shown for all cell subpopulations in each disease state of each tissue based on the regulon specific score inferred using pySCENIC and by calculating the average expression. |
| Page: 1 |
Top |
Somatic mutation of malignant transformation related genes |
| Annotation of somatic variants for genes involved in malignant transformation |
| Hugo Symbol | Variant Class | Variant Classification | dbSNP RS | HGVSc | HGVSp | HGVSp Short | SWISSPROT | BIOTYPE | SIFT | PolyPhen | Tumor Sample Barcode | Tissue | Histology | Sex | Age | Stage | Therapy Types | Drugs | Outcome |
| CCDC115 | SNV | Missense_Mutation | novel | c.217N>A | p.Glu73Lys | p.E73K | Q96NT0 | protein_coding | tolerated(0.34) | possibly_damaging(0.458) | TCGA-E2-A2P5-01 | Breast | breast invasive carcinoma | Female | >=65 | III/IV | Hormone Therapy | arimidex | PD |
| CCDC115 | insertion | Frame_Shift_Ins | novel | c.445_446insGGAAGGAAAATATCCACCTCCAGTCTGCTTTAGTCTTCCAACT | p.Ala149GlyfsTer25 | p.A149Gfs*25 | Q96NT0 | protein_coding | TCGA-BH-A0BD-01 | Breast | breast invasive carcinoma | Female | <65 | I/II | Chemotherapy | doxorubicin | SD | ||
| CCDC115 | SNV | Missense_Mutation | c.77N>A | p.Gly26Glu | p.G26E | Q96NT0 | protein_coding | tolerated(0.97) | benign(0.083) | TCGA-FU-A40J-01 | Cervix | cervical & endocervical cancer | Female | <65 | III/IV | Chemotherapy | carboplatin | CR | |
| CCDC115 | SNV | Missense_Mutation | novel | c.86C>T | p.Thr29Met | p.T29M | Q96NT0 | protein_coding | tolerated(0.08) | benign(0.07) | TCGA-AA-3845-01 | Colorectum | colon adenocarcinoma | Female | >=65 | I/II | Unknown | Unknown | PD |
| CCDC115 | SNV | Missense_Mutation | c.104N>C | p.Val35Ala | p.V35A | Q96NT0 | protein_coding | deleterious(0) | possibly_damaging(0.878) | TCGA-AA-A010-01 | Colorectum | colon adenocarcinoma | Female | <65 | I/II | Chemotherapy | folinic | CR | |
| CCDC115 | SNV | Missense_Mutation | rs766713863 | c.134N>T | p.Ala45Val | p.A45V | Q96NT0 | protein_coding | deleterious(0) | benign(0.412) | TCGA-F5-6814-01 | Colorectum | rectum adenocarcinoma | Male | <65 | I/II | Unknown | Unknown | SD |
| CCDC115 | SNV | Missense_Mutation | novel | c.476N>C | p.Asp159Ala | p.D159A | Q96NT0 | protein_coding | tolerated(0.64) | benign(0.059) | TCGA-D1-A103-01 | Endometrium | uterine corpus endometrioid carcinoma | Female | >=65 | I/II | Unknown | Unknown | SD |
| CCDC115 | SNV | Missense_Mutation | rs762047473 | c.424N>T | p.Arg142Trp | p.R142W | Q96NT0 | protein_coding | deleterious(0.03) | possibly_damaging(0.882) | TCGA-D1-A103-01 | Endometrium | uterine corpus endometrioid carcinoma | Female | >=65 | I/II | Unknown | Unknown | SD |
| CCDC115 | SNV | Missense_Mutation | c.403C>T | p.Arg135Cys | p.R135C | Q96NT0 | protein_coding | deleterious(0) | probably_damaging(1) | TCGA-D1-A16X-01 | Endometrium | uterine corpus endometrioid carcinoma | Female | <65 | I/II | Unknown | Unknown | SD | |
| CCDC115 | SNV | Missense_Mutation | novel | c.109G>A | p.Glu37Lys | p.E37K | Q96NT0 | protein_coding | tolerated(0.06) | benign(0.056) | TCGA-EY-A1GT-01 | Endometrium | uterine corpus endometrioid carcinoma | Female | >=65 | III/IV | Unspecific | Carboplatin | SD |
| Page: 1 2 |
Top |
Related drugs of malignant transformation related genes |
| Identification of chemicals and drugs interact with genes involved in malignant transfromation |
| (DGIdb 4.0) |
| Entrez ID | Symbol | Category | Interaction Types | Drug Claim Name | Drug Name | PMIDs |
| Page: 1 |

Copyright 2023-Present -The University of Texas Health Science Center at Houston |