
|
|||||
|
 | |
| |
| |
| |
| |
| |
|
Gene: CCDC106 |
Gene summary for CCDC106 |
| Gene information | Species | Human | Gene symbol | CCDC106 | Gene ID | 29903 |
| Gene name | coiled-coil domain containing 106 | |
| Gene Alias | HSU79303 | |
| Cytomap | 19q13.42 | |
| Gene Type | protein-coding | GO ID | GO:0005575 | UniProtAcc | Q9BWC9 |
Top |
Malignant transformation analysis |
| Identification of the aberrant gene expression in precancerous and cancerous lesions by comparing the gene expression of stem-like cells in diseased tissues with normal stem cells |
| Entrez ID | Symbol | Replicates | Species | Organ | Tissue | Adj P-value | Log2FC | Malignancy |
| 29903 | CCDC106 | LZE7T | Human | Esophagus | ESCC | 1.71e-02 | 2.50e-01 | 0.0667 |
| 29903 | CCDC106 | LZE24T | Human | Esophagus | ESCC | 5.15e-06 | 1.44e-01 | 0.0596 |
| 29903 | CCDC106 | P2T-E | Human | Esophagus | ESCC | 5.71e-11 | 1.82e-01 | 0.1177 |
| 29903 | CCDC106 | P4T-E | Human | Esophagus | ESCC | 4.11e-15 | 2.64e-01 | 0.1323 |
| 29903 | CCDC106 | P5T-E | Human | Esophagus | ESCC | 1.53e-03 | 8.62e-02 | 0.1327 |
| 29903 | CCDC106 | P8T-E | Human | Esophagus | ESCC | 2.74e-05 | 1.26e-01 | 0.0889 |
| 29903 | CCDC106 | P9T-E | Human | Esophagus | ESCC | 6.96e-04 | 7.40e-02 | 0.1131 |
| 29903 | CCDC106 | P10T-E | Human | Esophagus | ESCC | 1.71e-28 | 5.28e-01 | 0.116 |
| 29903 | CCDC106 | P11T-E | Human | Esophagus | ESCC | 2.04e-09 | 4.07e-01 | 0.1426 |
| 29903 | CCDC106 | P12T-E | Human | Esophagus | ESCC | 6.04e-16 | 2.45e-01 | 0.1122 |
| 29903 | CCDC106 | P15T-E | Human | Esophagus | ESCC | 5.59e-14 | 2.56e-01 | 0.1149 |
| 29903 | CCDC106 | P16T-E | Human | Esophagus | ESCC | 9.54e-11 | 2.34e-01 | 0.1153 |
| 29903 | CCDC106 | P17T-E | Human | Esophagus | ESCC | 1.40e-03 | 1.88e-01 | 0.1278 |
| 29903 | CCDC106 | P21T-E | Human | Esophagus | ESCC | 1.00e-12 | 3.20e-01 | 0.1617 |
| 29903 | CCDC106 | P24T-E | Human | Esophagus | ESCC | 9.13e-12 | 2.89e-01 | 0.1287 |
| 29903 | CCDC106 | P26T-E | Human | Esophagus | ESCC | 7.37e-35 | 7.72e-01 | 0.1276 |
| 29903 | CCDC106 | P27T-E | Human | Esophagus | ESCC | 3.32e-25 | 3.64e-01 | 0.1055 |
| 29903 | CCDC106 | P28T-E | Human | Esophagus | ESCC | 3.79e-23 | 4.62e-01 | 0.1149 |
| 29903 | CCDC106 | P30T-E | Human | Esophagus | ESCC | 7.51e-12 | 2.97e-01 | 0.137 |
| 29903 | CCDC106 | P31T-E | Human | Esophagus | ESCC | 1.42e-12 | 2.86e-01 | 0.1251 |
| Page: 1 2 3 |
| Tissue | Expression Dynamics | Abbreviation |
| Esophagus |  | ESCC: Esophageal squamous cell carcinoma |
| HGIN: High-grade intraepithelial neoplasias | ||
| LGIN: Low-grade intraepithelial neoplasias | ||
| Liver | 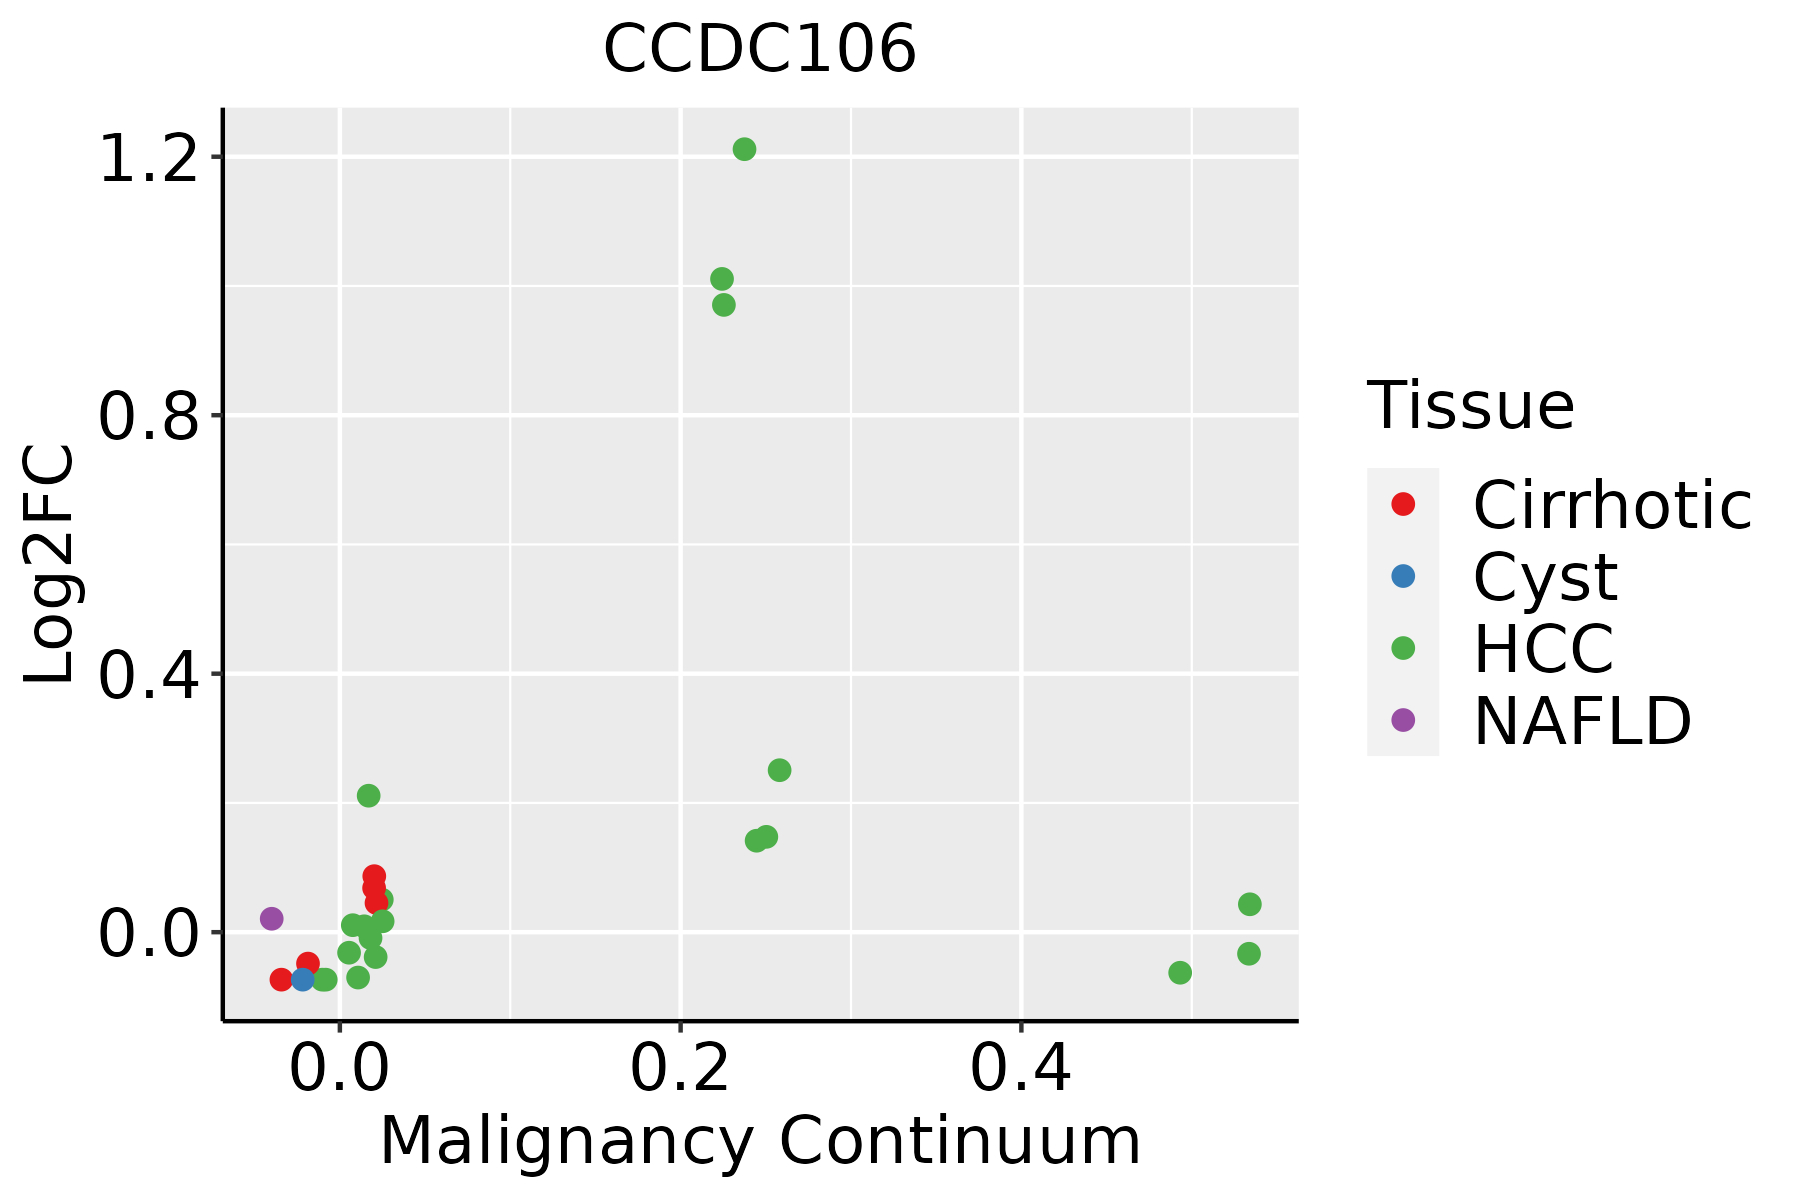 | HCC: Hepatocellular carcinoma |
| NAFLD: Non-alcoholic fatty liver disease |
| ∗log2FC in expression of this searched gene in stem-like cells from each diseased tissue sample relative to stem-like cells in normal samples in each tissue plotted against the malignancy continuum. Samples are colored based on if they are from different disease stage. |
Top |
Malignant transformation related pathway analysis |
| Find out the enriched GO biological processes and KEGG pathways involved in transition from healthy to precancer to cancer |
| Tissue | Disease Stage | Enriched GO biological Processes |
| Colorectum | AD |  |
| Colorectum | SER |  |
| Colorectum | MSS |  |
| Colorectum | MSI-H |  |
| Colorectum | FAP |  |
| ∗Top 15 enriched GO BP terms are showed in the bar plot of each disease state in each tissue. Each row represents a significant GO biological process which is colored according to the -log10(p.adjust). |
| Page: 1 2 3 4 5 6 7 8 9 |
| GO ID | Tissue | Disease Stage | Description | Gene Ratio | Bg Ratio | pvalue | p.adjust | Count |
| Page: 1 |
| Pathway ID | Tissue | Disease Stage | Description | Gene Ratio | Bg Ratio | pvalue | p.adjust | qvalue | Count |
| Page: 1 |
Top |
Cell-cell communication analysis |
| Identification of potential cell-cell interactions between two cell types and their ligand-receptor pairs for different disease states |
| Ligand | Receptor | LRpair | Pathway | Tissue | Disease Stage |
| Page: 1 |
Top |
Single-cell gene regulatory network inference analysis |
| Find out the significant the regulons (TFs) and the target genes of each regulon across cell types for different disease states |
| TF | Cell Type | Tissue | Disease Stage | Target Gene | RSS | Regulon Activity |
| ∗The dot plots of a searched regulon are shown for all cell subpopulations in each disease state of each tissue based on the regulon specific score inferred using pySCENIC and by calculating the average expression. |
| Page: 1 |
Top |
Somatic mutation of malignant transformation related genes |
| Annotation of somatic variants for genes involved in malignant transformation |
| Hugo Symbol | Variant Class | Variant Classification | dbSNP RS | HGVSc | HGVSp | HGVSp Short | SWISSPROT | BIOTYPE | SIFT | PolyPhen | Tumor Sample Barcode | Tissue | Histology | Sex | Age | Stage | Therapy Types | Drugs | Outcome |
| CCDC106 | SNV | Missense_Mutation | c.780N>C | p.Lys260Asn | p.K260N | Q9BWC9 | protein_coding | tolerated(0.19) | benign(0.015) | TCGA-BH-A0BP-01 | Breast | breast invasive carcinoma | Female | >=65 | I/II | Unknown | Unknown | SD | |
| CCDC106 | SNV | Missense_Mutation | novel | c.362N>A | p.Ser121Asn | p.S121N | Q9BWC9 | protein_coding | tolerated(0.12) | benign(0.021) | TCGA-2W-A8YY-01 | Cervix | cervical & endocervical cancer | Female | <65 | I/II | Chemotherapy | cisplatin | CR |
| CCDC106 | SNV | Missense_Mutation | novel | c.293C>T | p.Ser98Phe | p.S98F | Q9BWC9 | protein_coding | tolerated(0.13) | benign(0.053) | TCGA-C5-A2LZ-01 | Cervix | cervical & endocervical cancer | Female | >=65 | III/IV | Unknown | Unknown | PD |
| CCDC106 | SNV | Missense_Mutation | rs200120422 | c.430N>A | p.Glu144Lys | p.E144K | Q9BWC9 | protein_coding | tolerated(0.31) | benign(0.197) | TCGA-A6-6781-01 | Colorectum | colon adenocarcinoma | Male | <65 | III/IV | Chemotherapy | oxaliplatin | SD |
| CCDC106 | SNV | Missense_Mutation | c.70N>A | p.Asp24Asn | p.D24N | Q9BWC9 | protein_coding | deleterious(0) | benign(0) | TCGA-AA-3821-01 | Colorectum | colon adenocarcinoma | Female | >=65 | I/II | Unknown | Unknown | SD | |
| CCDC106 | SNV | Missense_Mutation | c.725N>A | p.Arg242His | p.R242H | Q9BWC9 | protein_coding | deleterious(0.01) | probably_damaging(0.95) | TCGA-AA-3845-01 | Colorectum | colon adenocarcinoma | Female | >=65 | I/II | Unknown | Unknown | PD | |
| CCDC106 | SNV | Missense_Mutation | c.740N>T | p.Ser247Phe | p.S247F | Q9BWC9 | protein_coding | deleterious(0) | probably_damaging(0.931) | TCGA-CK-4951-01 | Colorectum | colon adenocarcinoma | Female | >=65 | I/II | Unknown | Unknown | PD | |
| CCDC106 | SNV | Missense_Mutation | rs371292659 | c.346N>T | p.Arg116Trp | p.R116W | Q9BWC9 | protein_coding | deleterious(0.01) | probably_damaging(0.965) | TCGA-CL-5918-01 | Colorectum | rectum adenocarcinoma | Female | >=65 | I/II | Unknown | Unknown | SD |
| CCDC106 | SNV | Missense_Mutation | rs756436123 | c.20G>A | p.Arg7Gln | p.R7Q | Q9BWC9 | protein_coding | tolerated_low_confidence(0.07) | benign(0.001) | TCGA-A5-A0G2-01 | Endometrium | uterine corpus endometrioid carcinoma | Female | <65 | III/IV | Unknown | Unknown | SD |
| CCDC106 | SNV | Missense_Mutation | c.620G>A | p.Arg207His | p.R207H | Q9BWC9 | protein_coding | deleterious(0.05) | possibly_damaging(0.534) | TCGA-A5-A0G2-01 | Endometrium | uterine corpus endometrioid carcinoma | Female | <65 | III/IV | Unknown | Unknown | SD |
| Page: 1 2 3 4 5 |
Top |
Related drugs of malignant transformation related genes |
| Identification of chemicals and drugs interact with genes involved in malignant transfromation |
| (DGIdb 4.0) |
| Entrez ID | Symbol | Category | Interaction Types | Drug Claim Name | Drug Name | PMIDs |
| Page: 1 |

Copyright 2023-Present -The University of Texas Health Science Center at Houston |