
|
|||||
|
 | |
| |
| |
| |
| |
| |
|
Gene: CCBE1 |
Gene summary for CCBE1 |
| Gene information | Species | Human | Gene symbol | CCBE1 | Gene ID | 147372 |
| Gene name | collagen and calcium binding EGF domains 1 | |
| Gene Alias | HKLLS1 | |
| Cytomap | 18q21.32 | |
| Gene Type | protein-coding | GO ID | GO:0001525 | UniProtAcc | Q6UXH8 |
Top |
Malignant transformation analysis |
| Identification of the aberrant gene expression in precancerous and cancerous lesions by comparing the gene expression of stem-like cells in diseased tissues with normal stem cells |
| Entrez ID | Symbol | Replicates | Species | Organ | Tissue | Adj P-value | Log2FC | Malignancy |
| 147372 | CCBE1 | HCC1 | Human | Liver | HCC | 1.86e-19 | 1.65e+00 | 0.5336 |
| 147372 | CCBE1 | HCC2 | Human | Liver | HCC | 7.68e-30 | 2.49e+00 | 0.5341 |
| 147372 | CCBE1 | HCC5 | Human | Liver | HCC | 3.46e-38 | 2.21e+00 | 0.4932 |
| 147372 | CCBE1 | S014 | Human | Liver | HCC | 4.80e-06 | 3.86e-01 | 0.2254 |
| 147372 | CCBE1 | S015 | Human | Liver | HCC | 1.19e-03 | 3.77e-01 | 0.2375 |
| 147372 | CCBE1 | S016 | Human | Liver | HCC | 6.66e-04 | 3.90e-01 | 0.2243 |
| 147372 | CCBE1 | ATC09 | Human | Thyroid | ATC | 5.47e-05 | 3.43e-01 | 0.2871 |
| 147372 | CCBE1 | ATC11 | Human | Thyroid | ATC | 5.35e-04 | 4.03e-01 | 0.3386 |
| 147372 | CCBE1 | ATC12 | Human | Thyroid | ATC | 1.15e-03 | 1.46e-01 | 0.34 |
| 147372 | CCBE1 | ATC13 | Human | Thyroid | ATC | 5.43e-04 | 1.50e-01 | 0.34 |
| 147372 | CCBE1 | ATC1 | Human | Thyroid | ATC | 8.73e-06 | 4.24e-01 | 0.2878 |
| 147372 | CCBE1 | ATC2 | Human | Thyroid | ATC | 1.28e-23 | 1.76e+00 | 0.34 |
| 147372 | CCBE1 | ATC3 | Human | Thyroid | ATC | 5.97e-08 | 4.23e-01 | 0.338 |
| 147372 | CCBE1 | ATC4 | Human | Thyroid | ATC | 7.10e-07 | 1.93e-01 | 0.34 |
| 147372 | CCBE1 | ATC5 | Human | Thyroid | ATC | 5.43e-04 | 1.70e-01 | 0.34 |
| Page: 1 |
| Tissue | Expression Dynamics | Abbreviation |
| Liver |  | HCC: Hepatocellular carcinoma |
| NAFLD: Non-alcoholic fatty liver disease | ||
| Thyroid | 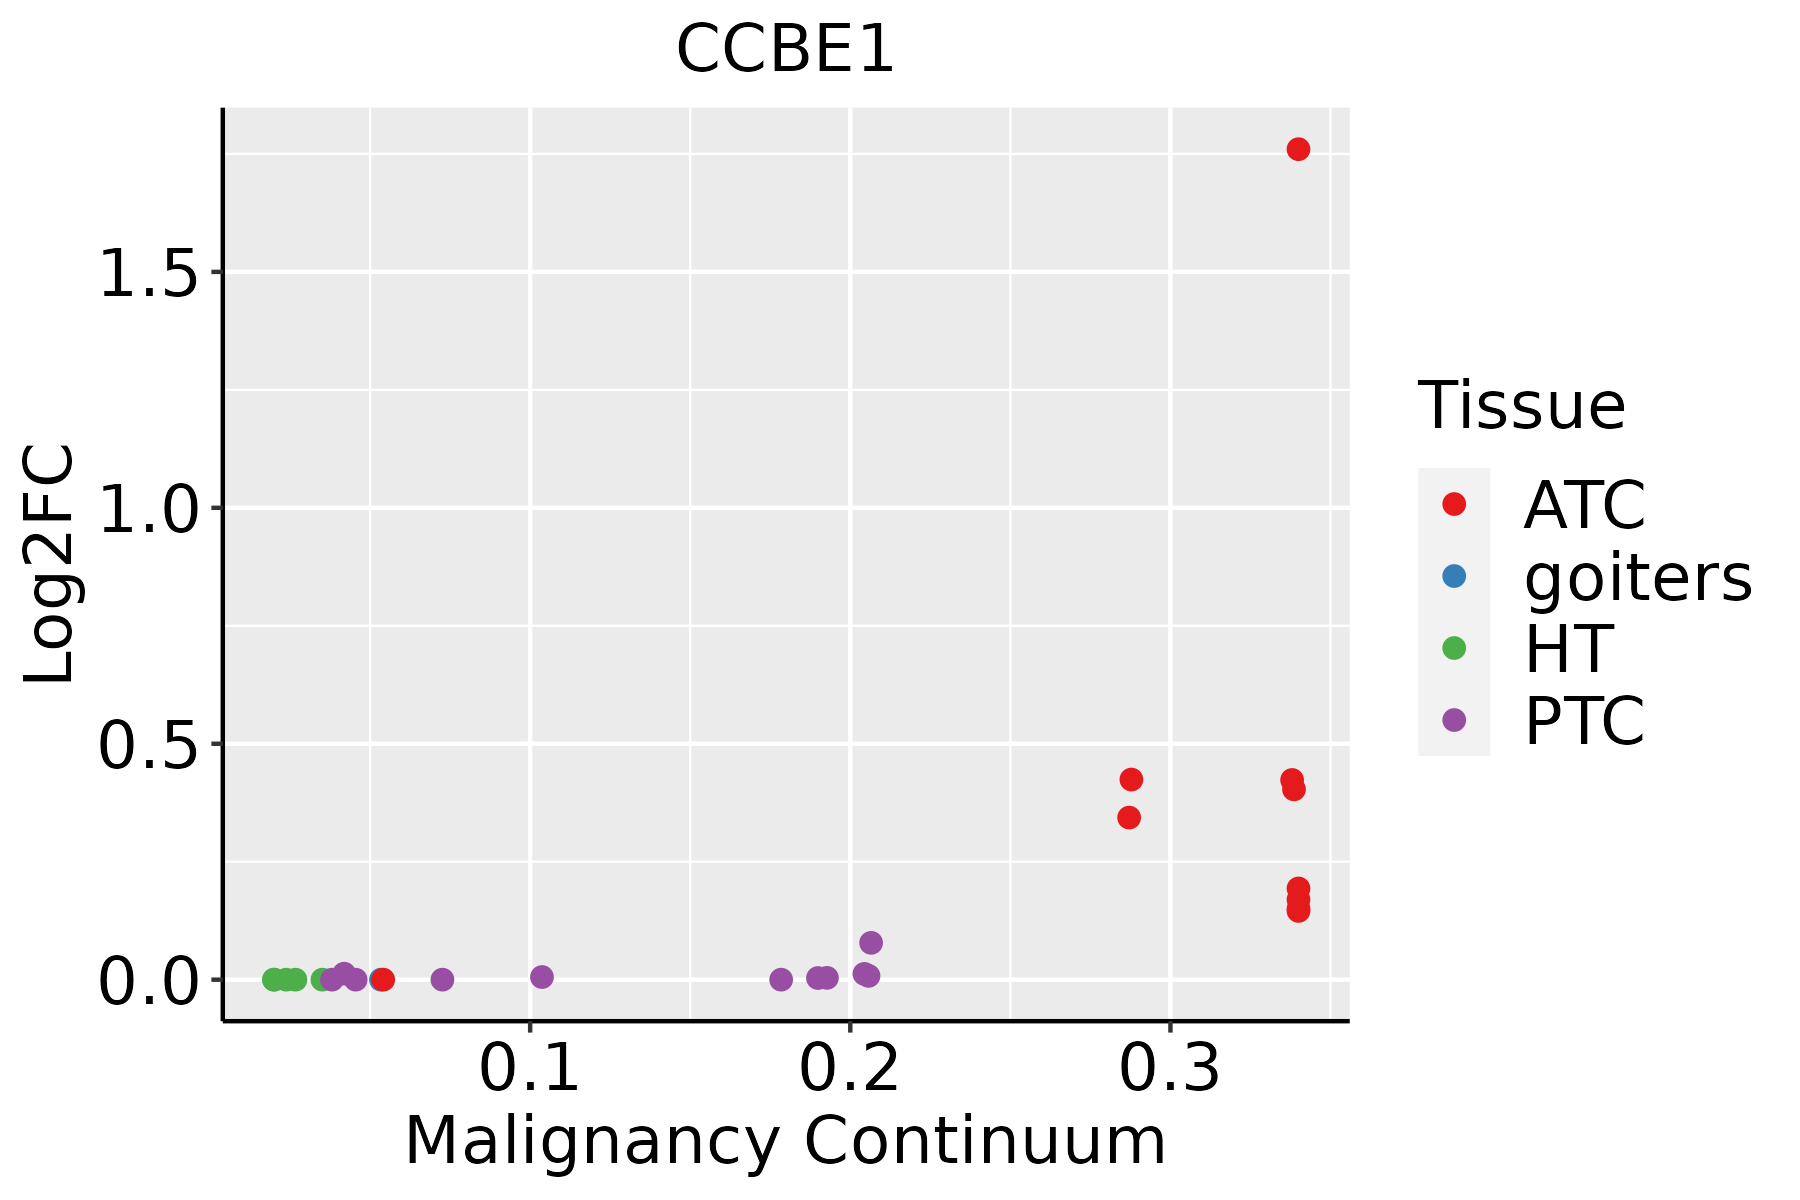 | ATC: Anaplastic thyroid cancer |
| HT: Hashimoto's thyroiditis | ||
| PTC: Papillary thyroid cancer |
| ∗log2FC in expression of this searched gene in stem-like cells from each diseased tissue sample relative to stem-like cells in normal samples in each tissue plotted against the malignancy continuum. Samples are colored based on if they are from different disease stage. |
Top |
Malignant transformation related pathway analysis |
| Find out the enriched GO biological processes and KEGG pathways involved in transition from healthy to precancer to cancer |
| Tissue | Disease Stage | Enriched GO biological Processes |
| Colorectum | AD |  |
| Colorectum | SER |  |
| Colorectum | MSS |  |
| Colorectum | MSI-H |  |
| Colorectum | FAP |  |
| ∗Top 15 enriched GO BP terms are showed in the bar plot of each disease state in each tissue. Each row represents a significant GO biological process which is colored according to the -log10(p.adjust). |
| Page: 1 2 3 4 5 6 7 8 9 |
| GO ID | Tissue | Disease Stage | Description | Gene Ratio | Bg Ratio | pvalue | p.adjust | Count |
| GO:004586222 | Liver | HCC | positive regulation of proteolysis | 232/7958 | 372/18723 | 5.66e-15 | 3.98e-13 | 232 |
| GO:005160412 | Liver | HCC | protein maturation | 171/7958 | 294/18723 | 3.80e-08 | 8.30e-07 | 171 |
| GO:001648511 | Liver | HCC | protein processing | 121/7958 | 225/18723 | 4.01e-04 | 2.71e-03 | 121 |
| GO:003032311 | Liver | HCC | respiratory tube development | 95/7958 | 181/18723 | 4.15e-03 | 1.81e-02 | 95 |
| GO:19033171 | Liver | HCC | regulation of protein maturation | 39/7958 | 67/18723 | 6.84e-03 | 2.74e-02 | 39 |
| GO:003032411 | Liver | HCC | lung development | 91/7958 | 177/18723 | 1.01e-02 | 3.80e-02 | 91 |
| GO:00706131 | Liver | HCC | regulation of protein processing | 37/7958 | 65/18723 | 1.33e-02 | 4.77e-02 | 37 |
| GO:000166721 | Liver | HCC | ameboidal-type cell migration | 226/7958 | 475/18723 | 1.35e-02 | 4.81e-02 | 226 |
| GO:004586234 | Thyroid | ATC | positive regulation of proteolysis | 202/6293 | 372/18723 | 1.07e-16 | 9.42e-15 | 202 |
| GO:000166731 | Thyroid | ATC | ameboidal-type cell migration | 228/6293 | 475/18723 | 3.72e-11 | 1.22e-09 | 228 |
| GO:001063131 | Thyroid | ATC | epithelial cell migration | 169/6293 | 357/18723 | 4.21e-08 | 7.69e-07 | 169 |
| GO:009013031 | Thyroid | ATC | tissue migration | 171/6293 | 365/18723 | 8.55e-08 | 1.47e-06 | 171 |
| GO:009013231 | Thyroid | ATC | epithelium migration | 169/6293 | 360/18723 | 8.57e-08 | 1.47e-06 | 169 |
| GO:001063432 | Thyroid | ATC | positive regulation of epithelial cell migration | 92/6293 | 176/18723 | 2.38e-07 | 3.70e-06 | 92 |
| GO:003032321 | Thyroid | ATC | respiratory tube development | 93/6293 | 181/18723 | 5.67e-07 | 8.02e-06 | 93 |
| GO:001063231 | Thyroid | ATC | regulation of epithelial cell migration | 137/6293 | 292/18723 | 1.44e-06 | 1.77e-05 | 137 |
| GO:003032421 | Thyroid | ATC | lung development | 90/6293 | 177/18723 | 1.53e-06 | 1.88e-05 | 90 |
| GO:006054121 | Thyroid | ATC | respiratory system development | 100/6293 | 203/18723 | 2.66e-06 | 3.08e-05 | 100 |
| GO:009028721 | Thyroid | ATC | regulation of cellular response to growth factor stimulus | 140/6293 | 304/18723 | 3.91e-06 | 4.33e-05 | 140 |
| GO:0051604110 | Thyroid | ATC | protein maturation | 136/6293 | 294/18723 | 4.00e-06 | 4.42e-05 | 136 |
| Page: 1 2 |
| Pathway ID | Tissue | Disease Stage | Description | Gene Ratio | Bg Ratio | pvalue | p.adjust | qvalue | Count |
| Page: 1 |
Top |
Cell-cell communication analysis |
| Identification of potential cell-cell interactions between two cell types and their ligand-receptor pairs for different disease states |
| Ligand | Receptor | LRpair | Pathway | Tissue | Disease Stage |
| Page: 1 |
Top |
Single-cell gene regulatory network inference analysis |
| Find out the significant the regulons (TFs) and the target genes of each regulon across cell types for different disease states |
| TF | Cell Type | Tissue | Disease Stage | Target Gene | RSS | Regulon Activity |
| ∗The dot plots of a searched regulon are shown for all cell subpopulations in each disease state of each tissue based on the regulon specific score inferred using pySCENIC and by calculating the average expression. |
| Page: 1 |
Top |
Somatic mutation of malignant transformation related genes |
| Annotation of somatic variants for genes involved in malignant transformation |
| Hugo Symbol | Variant Class | Variant Classification | dbSNP RS | HGVSc | HGVSp | HGVSp Short | SWISSPROT | BIOTYPE | SIFT | PolyPhen | Tumor Sample Barcode | Tissue | Histology | Sex | Age | Stage | Therapy Types | Drugs | Outcome |
| CCBE1 | insertion | Frame_Shift_Ins | novel | c.375_376insT | p.Lys126Ter | p.K126* | Q6UXH8 | protein_coding | TCGA-A2-A0EV-01 | Breast | breast invasive carcinoma | Female | >=65 | I/II | Unknown | Unknown | SD | ||
| CCBE1 | insertion | Nonsense_Mutation | novel | c.373_374insCAAGACTGGGTAATTTATAAAGAAAAAGA | p.Arg125ProfsTer7 | p.R125Pfs*7 | Q6UXH8 | protein_coding | TCGA-A2-A0EV-01 | Breast | breast invasive carcinoma | Female | >=65 | I/II | Unknown | Unknown | SD | ||
| CCBE1 | SNV | Missense_Mutation | rs752519349 | c.838N>A | p.Gly280Ser | p.G280S | Q6UXH8 | protein_coding | tolerated(0.05) | probably_damaging(0.999) | TCGA-BI-A20A-01 | Cervix | cervical & endocervical cancer | Female | <65 | I/II | Unknown | Unknown | SD |
| CCBE1 | SNV | Missense_Mutation | c.1032N>A | p.Asp344Glu | p.D344E | Q6UXH8 | protein_coding | tolerated(0.05) | benign(0.007) | TCGA-A6-5662-01 | Colorectum | colon adenocarcinoma | Male | <65 | I/II | Chemotherapy | oxaliplatin | PD | |
| CCBE1 | SNV | Missense_Mutation | c.632N>T | p.Thr211Ile | p.T211I | Q6UXH8 | protein_coding | deleterious(0) | benign(0.188) | TCGA-AA-3864-01 | Colorectum | colon adenocarcinoma | Male | >=65 | I/II | Unknown | Unknown | SD | |
| CCBE1 | SNV | Missense_Mutation | c.464N>A | p.Gly155Asp | p.G155D | Q6UXH8 | protein_coding | deleterious(0) | probably_damaging(0.987) | TCGA-AA-A00N-01 | Colorectum | colon adenocarcinoma | Male | >=65 | I/II | Unknown | Unknown | PD | |
| CCBE1 | SNV | Missense_Mutation | rs374811948 | c.274N>A | p.Val92Ile | p.V92I | Q6UXH8 | protein_coding | tolerated(0.06) | benign(0.007) | TCGA-D5-7000-01 | Colorectum | colon adenocarcinoma | Female | >=65 | I/II | Unknown | Unknown | SD |
| CCBE1 | SNV | Missense_Mutation | c.793N>A | p.Gly265Arg | p.G265R | Q6UXH8 | protein_coding | deleterious(0) | probably_damaging(1) | TCGA-DM-A1D4-01 | Colorectum | colon adenocarcinoma | Male | >=65 | I/II | Unknown | Unknown | PD | |
| CCBE1 | SNV | Missense_Mutation | c.115N>T | p.Pro39Ser | p.P39S | Q6UXH8 | protein_coding | tolerated(0.19) | benign(0.007) | TCGA-G4-6628-01 | Colorectum | colon adenocarcinoma | Male | >=65 | I/II | Unknown | Unknown | SD | |
| CCBE1 | SNV | Missense_Mutation | c.140N>A | p.Cys47Tyr | p.C47Y | Q6UXH8 | protein_coding | deleterious(0) | benign(0.012) | TCGA-NH-A5IV-01 | Colorectum | colon adenocarcinoma | Female | >=65 | I/II | Unknown | Unknown | SD |
| Page: 1 2 3 4 5 6 |
Top |
Related drugs of malignant transformation related genes |
| Identification of chemicals and drugs interact with genes involved in malignant transfromation |
| (DGIdb 4.0) |
| Entrez ID | Symbol | Category | Interaction Types | Drug Claim Name | Drug Name | PMIDs |
| Page: 1 |

Copyright 2023-Present -The University of Texas Health Science Center at Houston |