
|
|||||
|
 | |
| |
| |
| |
| |
| |
|
Gene: CCAR2 |
Gene summary for CCAR2 |
| Gene information | Species | Human | Gene symbol | CCAR2 | Gene ID | 57805 |
| Gene name | cell cycle and apoptosis regulator 2 | |
| Gene Alias | DBC-1 | |
| Cytomap | 8p21.3 | |
| Gene Type | protein-coding | GO ID | GO:0000075 | UniProtAcc | Q8N163 |
Top |
Malignant transformation analysis |
| Identification of the aberrant gene expression in precancerous and cancerous lesions by comparing the gene expression of stem-like cells in diseased tissues with normal stem cells |
| Entrez ID | Symbol | Replicates | Species | Organ | Tissue | Adj P-value | Log2FC | Malignancy |
| 57805 | CCAR2 | LZE4T | Human | Esophagus | ESCC | 3.38e-07 | 1.86e-01 | 0.0811 |
| 57805 | CCAR2 | LZE7T | Human | Esophagus | ESCC | 8.79e-08 | 3.12e-01 | 0.0667 |
| 57805 | CCAR2 | LZE8T | Human | Esophagus | ESCC | 3.40e-06 | 1.88e-01 | 0.067 |
| 57805 | CCAR2 | LZE24T | Human | Esophagus | ESCC | 8.59e-09 | 2.80e-01 | 0.0596 |
| 57805 | CCAR2 | LZE21T | Human | Esophagus | ESCC | 1.00e-02 | 2.21e-01 | 0.0655 |
| 57805 | CCAR2 | P1T-E | Human | Esophagus | ESCC | 1.47e-08 | 2.92e-01 | 0.0875 |
| 57805 | CCAR2 | P2T-E | Human | Esophagus | ESCC | 7.46e-29 | 4.56e-01 | 0.1177 |
| 57805 | CCAR2 | P4T-E | Human | Esophagus | ESCC | 2.60e-10 | 2.72e-01 | 0.1323 |
| 57805 | CCAR2 | P8T-E | Human | Esophagus | ESCC | 1.58e-18 | 3.51e-01 | 0.0889 |
| 57805 | CCAR2 | P9T-E | Human | Esophagus | ESCC | 7.15e-09 | 1.46e-01 | 0.1131 |
| 57805 | CCAR2 | P10T-E | Human | Esophagus | ESCC | 3.37e-23 | 4.13e-01 | 0.116 |
| 57805 | CCAR2 | P11T-E | Human | Esophagus | ESCC | 7.79e-04 | 1.67e-01 | 0.1426 |
| 57805 | CCAR2 | P12T-E | Human | Esophagus | ESCC | 2.86e-21 | 3.34e-01 | 0.1122 |
| 57805 | CCAR2 | P15T-E | Human | Esophagus | ESCC | 1.55e-14 | 1.97e-01 | 0.1149 |
| 57805 | CCAR2 | P16T-E | Human | Esophagus | ESCC | 4.56e-29 | 4.86e-01 | 0.1153 |
| 57805 | CCAR2 | P17T-E | Human | Esophagus | ESCC | 2.32e-06 | 3.31e-01 | 0.1278 |
| 57805 | CCAR2 | P19T-E | Human | Esophagus | ESCC | 5.10e-07 | 3.50e-01 | 0.1662 |
| 57805 | CCAR2 | P20T-E | Human | Esophagus | ESCC | 1.02e-17 | 2.80e-01 | 0.1124 |
| 57805 | CCAR2 | P21T-E | Human | Esophagus | ESCC | 4.76e-17 | 2.44e-01 | 0.1617 |
| 57805 | CCAR2 | P22T-E | Human | Esophagus | ESCC | 9.78e-12 | 2.51e-01 | 0.1236 |
| Page: 1 2 3 4 |
| Tissue | Expression Dynamics | Abbreviation |
| Esophagus |  | ESCC: Esophageal squamous cell carcinoma |
| HGIN: High-grade intraepithelial neoplasias | ||
| LGIN: Low-grade intraepithelial neoplasias | ||
| Oral Cavity | 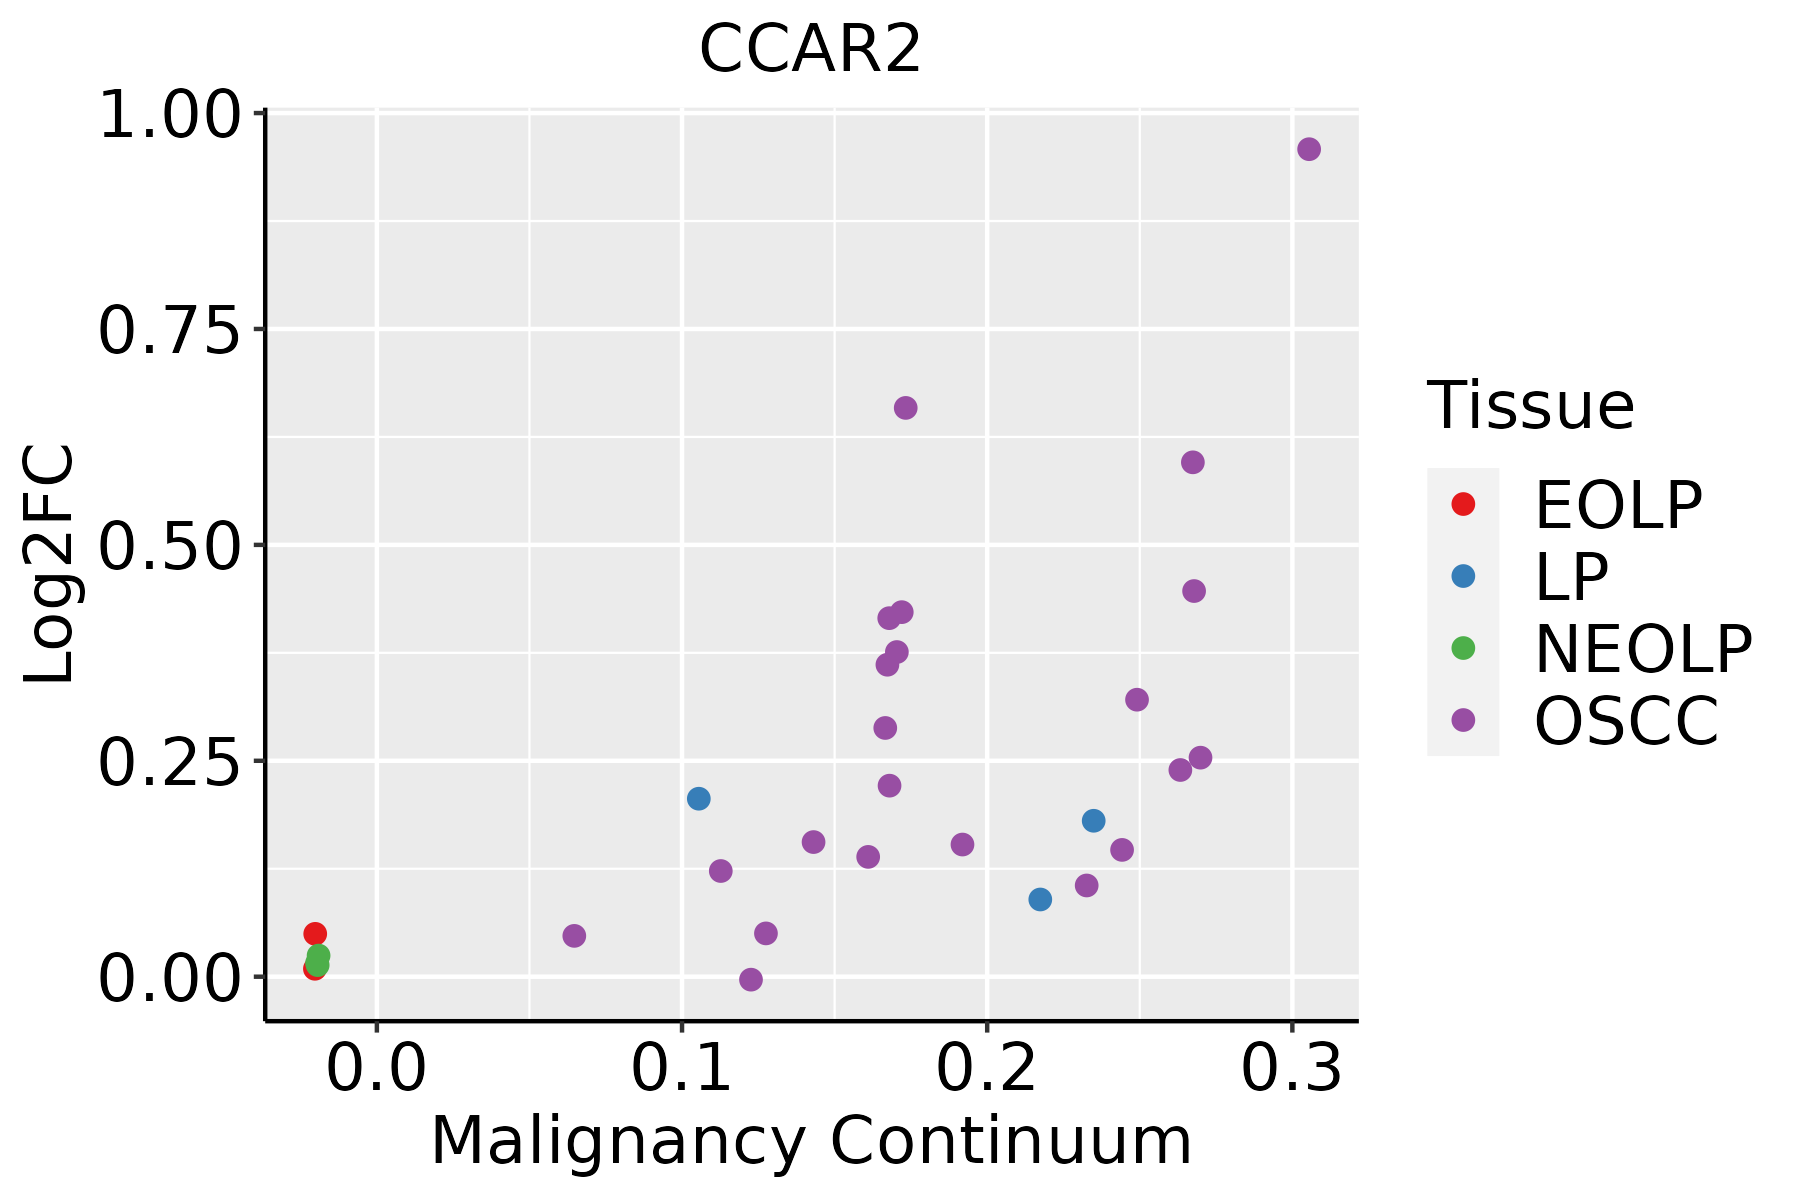 | EOLP: Erosive Oral lichen planus |
| LP: leukoplakia | ||
| NEOLP: Non-erosive oral lichen planus | ||
| OSCC: Oral squamous cell carcinoma |
| ∗log2FC in expression of this searched gene in stem-like cells from each diseased tissue sample relative to stem-like cells in normal samples in each tissue plotted against the malignancy continuum. Samples are colored based on if they are from different disease stage. |
Top |
Malignant transformation related pathway analysis |
| Find out the enriched GO biological processes and KEGG pathways involved in transition from healthy to precancer to cancer |
| Tissue | Disease Stage | Enriched GO biological Processes |
| Colorectum | AD |  |
| Colorectum | SER |  |
| Colorectum | MSS |  |
| Colorectum | MSI-H |  |
| Colorectum | FAP |  |
| ∗Top 15 enriched GO BP terms are showed in the bar plot of each disease state in each tissue. Each row represents a significant GO biological process which is colored according to the -log10(p.adjust). |
| Page: 1 2 3 4 5 6 7 8 9 |
| GO ID | Tissue | Disease Stage | Description | Gene Ratio | Bg Ratio | pvalue | p.adjust | Count |
| GO:0008380111 | Esophagus | ESCC | RNA splicing | 336/8552 | 434/18723 | 1.74e-42 | 3.67e-39 | 336 |
| GO:0010498111 | Esophagus | ESCC | proteasomal protein catabolic process | 369/8552 | 490/18723 | 1.13e-41 | 1.80e-38 | 369 |
| GO:0043161111 | Esophagus | ESCC | proteasome-mediated ubiquitin-dependent protein catabolic process | 312/8552 | 412/18723 | 3.53e-36 | 4.48e-33 | 312 |
| GO:0097193111 | Esophagus | ESCC | intrinsic apoptotic signaling pathway | 222/8552 | 288/18723 | 5.87e-28 | 2.02e-25 | 222 |
| GO:0042176111 | Esophagus | ESCC | regulation of protein catabolic process | 280/8552 | 391/18723 | 8.65e-26 | 2.39e-23 | 280 |
| GO:0031647111 | Esophagus | ESCC | regulation of protein stability | 223/8552 | 298/18723 | 5.76e-25 | 1.52e-22 | 223 |
| GO:2001233111 | Esophagus | ESCC | regulation of apoptotic signaling pathway | 256/8552 | 356/18723 | 4.11e-24 | 1.04e-21 | 256 |
| GO:1903362111 | Esophagus | ESCC | regulation of cellular protein catabolic process | 188/8552 | 255/18723 | 5.12e-20 | 6.62e-18 | 188 |
| GO:1903050111 | Esophagus | ESCC | regulation of proteolysis involved in cellular protein catabolic process | 163/8552 | 221/18723 | 1.44e-17 | 1.27e-15 | 163 |
| GO:2001242111 | Esophagus | ESCC | regulation of intrinsic apoptotic signaling pathway | 128/8552 | 164/18723 | 1.75e-17 | 1.50e-15 | 128 |
| GO:0061136111 | Esophagus | ESCC | regulation of proteasomal protein catabolic process | 142/8552 | 187/18723 | 2.40e-17 | 2.00e-15 | 142 |
| GO:0032434111 | Esophagus | ESCC | regulation of proteasomal ubiquitin-dependent protein catabolic process | 107/8552 | 134/18723 | 4.06e-16 | 2.93e-14 | 107 |
| GO:2000058111 | Esophagus | ESCC | regulation of ubiquitin-dependent protein catabolic process | 125/8552 | 164/18723 | 1.17e-15 | 7.76e-14 | 125 |
| GO:2001234111 | Esophagus | ESCC | negative regulation of apoptotic signaling pathway | 161/8552 | 224/18723 | 1.24e-15 | 8.09e-14 | 161 |
| GO:000941113 | Esophagus | ESCC | response to UV | 115/8552 | 149/18723 | 3.29e-15 | 1.93e-13 | 115 |
| GO:000635414 | Esophagus | ESCC | DNA-templated transcription, elongation | 76/8552 | 91/18723 | 8.35e-14 | 4.11e-12 | 76 |
| GO:2001243111 | Esophagus | ESCC | negative regulation of intrinsic apoptotic signaling pathway | 78/8552 | 98/18723 | 5.50e-12 | 2.10e-10 | 78 |
| GO:0008630110 | Esophagus | ESCC | intrinsic apoptotic signaling pathway in response to DNA damage | 78/8552 | 99/18723 | 1.43e-11 | 5.08e-10 | 78 |
| GO:0008637110 | Esophagus | ESCC | apoptotic mitochondrial changes | 83/8552 | 107/18723 | 1.43e-11 | 5.08e-10 | 83 |
| GO:190198713 | Esophagus | ESCC | regulation of cell cycle phase transition | 242/8552 | 390/18723 | 3.86e-11 | 1.26e-09 | 242 |
| Page: 1 2 3 4 5 6 7 |
| Pathway ID | Tissue | Disease Stage | Description | Gene Ratio | Bg Ratio | pvalue | p.adjust | qvalue | Count |
| Page: 1 |
Top |
Cell-cell communication analysis |
| Identification of potential cell-cell interactions between two cell types and their ligand-receptor pairs for different disease states |
| Ligand | Receptor | LRpair | Pathway | Tissue | Disease Stage |
| Page: 1 |
Top |
Single-cell gene regulatory network inference analysis |
| Find out the significant the regulons (TFs) and the target genes of each regulon across cell types for different disease states |
| TF | Cell Type | Tissue | Disease Stage | Target Gene | RSS | Regulon Activity |
| ∗The dot plots of a searched regulon are shown for all cell subpopulations in each disease state of each tissue based on the regulon specific score inferred using pySCENIC and by calculating the average expression. |
| Page: 1 |
Top |
Somatic mutation of malignant transformation related genes |
| Annotation of somatic variants for genes involved in malignant transformation |
| Hugo Symbol | Variant Class | Variant Classification | dbSNP RS | HGVSc | HGVSp | HGVSp Short | SWISSPROT | BIOTYPE | SIFT | PolyPhen | Tumor Sample Barcode | Tissue | Histology | Sex | Age | Stage | Therapy Types | Drugs | Outcome |
| CCAR2 | SNV | Missense_Mutation | novel | c.2452N>T | p.Arg818Cys | p.R818C | Q8N163 | protein_coding | tolerated(0.11) | probably_damaging(0.952) | TCGA-5L-AAT1-01 | Breast | breast invasive carcinoma | Female | <65 | III/IV | Hormone Therapy | letrozol | SD |
| CCAR2 | SNV | Missense_Mutation | novel | c.226N>C | p.Val76Leu | p.V76L | Q8N163 | protein_coding | deleterious(0) | probably_damaging(0.994) | TCGA-AN-A0FX-01 | Breast | breast invasive carcinoma | Female | <65 | I/II | Unknown | Unknown | SD |
| CCAR2 | SNV | Missense_Mutation | c.406N>C | p.Gly136Arg | p.G136R | Q8N163 | protein_coding | deleterious(0) | probably_damaging(0.999) | TCGA-D8-A1XK-01 | Breast | breast invasive carcinoma | Female | <65 | I/II | Chemotherapy | doxorubicine+cyclophosphamide | SD | |
| CCAR2 | SNV | Missense_Mutation | c.607C>T | p.Arg203Cys | p.R203C | Q8N163 | protein_coding | deleterious(0) | probably_damaging(0.99) | TCGA-E9-A1ND-01 | Breast | breast invasive carcinoma | Female | >=65 | I/II | Hormone Therapy | aromasin | SD | |
| CCAR2 | insertion | In_Frame_Ins | novel | c.1330_1331insTTG | p.Gln444delinsLeuGlu | p.Q444delinsLE | Q8N163 | protein_coding | TCGA-A8-A083-01 | Breast | breast invasive carcinoma | Female | >=65 | I/II | Unknown | Unknown | SD | ||
| CCAR2 | insertion | Frame_Shift_Ins | novel | c.1332_1333insACTCCCTGGAGTTGTCCTTGCAC | p.Gln445ThrfsTer69 | p.Q445Tfs*69 | Q8N163 | protein_coding | TCGA-A8-A083-01 | Breast | breast invasive carcinoma | Female | >=65 | I/II | Unknown | Unknown | SD | ||
| CCAR2 | insertion | Nonsense_Mutation | novel | c.2552_2553insCTTTTTTTTTTCTTTTCTTTTTTG | p.Glu851delinsAspPhePhePheSerPheLeuPheTer | p.E851delinsDFFFSFLF* | Q8N163 | protein_coding | TCGA-A8-A08H-01 | Breast | breast invasive carcinoma | Female | >=65 | I/II | Unknown | Unknown | SD | ||
| CCAR2 | insertion | Frame_Shift_Ins | novel | c.227_228insCGCTCCAGGGAAATCTTTAG | p.Phe77AlafsTer11 | p.F77Afs*11 | Q8N163 | protein_coding | TCGA-AN-A0FX-01 | Breast | breast invasive carcinoma | Female | <65 | I/II | Unknown | Unknown | SD | ||
| CCAR2 | deletion | Frame_Shift_Del | c.2359delN | p.Ser789AlafsTer21 | p.S789Afs*21 | Q8N163 | protein_coding | TCGA-GM-A2D9-01 | Breast | breast invasive carcinoma | Female | >=65 | I/II | Hormone Therapy | arimidex | SD | |||
| CCAR2 | SNV | Missense_Mutation | rs200429085 | c.674N>A | p.Arg225Gln | p.R225Q | Q8N163 | protein_coding | tolerated(0.24) | probably_damaging(0.968) | TCGA-DS-A0VN-01 | Cervix | cervical & endocervical cancer | Female | <65 | I/II | Chemotherapy | cisplatin | SD |
| Page: 1 2 3 4 5 6 7 8 9 10 11 |
Top |
Related drugs of malignant transformation related genes |
| Identification of chemicals and drugs interact with genes involved in malignant transfromation |
| (DGIdb 4.0) |
| Entrez ID | Symbol | Category | Interaction Types | Drug Claim Name | Drug Name | PMIDs |
| Page: 1 |

Copyright 2023-Present -The University of Texas Health Science Center at Houston |