
|
|||||
|
 | |
| |
| |
| |
| |
| |
|
Gene: CCAR1 |
Gene summary for CCAR1 |
| Gene information | Species | Human | Gene symbol | CCAR1 | Gene ID | 55749 |
| Gene name | cell division cycle and apoptosis regulator 1 | |
| Gene Alias | CCAR1 | |
| Cytomap | 10q21.3 | |
| Gene Type | protein-coding | GO ID | GO:0006139 | UniProtAcc | Q8IX12 |
Top |
Malignant transformation analysis |
| Identification of the aberrant gene expression in precancerous and cancerous lesions by comparing the gene expression of stem-like cells in diseased tissues with normal stem cells |
| Entrez ID | Symbol | Replicates | Species | Organ | Tissue | Adj P-value | Log2FC | Malignancy |
| 55749 | CCAR1 | LZE2T | Human | Esophagus | ESCC | 2.70e-07 | 9.56e-01 | 0.082 |
| 55749 | CCAR1 | LZE4T | Human | Esophagus | ESCC | 1.21e-18 | 5.74e-01 | 0.0811 |
| 55749 | CCAR1 | LZE5T | Human | Esophagus | ESCC | 3.29e-02 | 6.19e-01 | 0.0514 |
| 55749 | CCAR1 | LZE7T | Human | Esophagus | ESCC | 2.92e-06 | 3.82e-01 | 0.0667 |
| 55749 | CCAR1 | LZE8T | Human | Esophagus | ESCC | 6.63e-09 | 4.38e-01 | 0.067 |
| 55749 | CCAR1 | LZE22D1 | Human | Esophagus | HGIN | 5.13e-08 | 1.56e-01 | 0.0595 |
| 55749 | CCAR1 | LZE22T | Human | Esophagus | ESCC | 1.61e-08 | 4.58e-01 | 0.068 |
| 55749 | CCAR1 | LZE24T | Human | Esophagus | ESCC | 2.72e-21 | 7.39e-01 | 0.0596 |
| 55749 | CCAR1 | LZE6T | Human | Esophagus | ESCC | 4.48e-05 | 3.17e-01 | 0.0845 |
| 55749 | CCAR1 | P1T-E | Human | Esophagus | ESCC | 9.81e-06 | 5.39e-01 | 0.0875 |
| 55749 | CCAR1 | P2T-E | Human | Esophagus | ESCC | 1.77e-49 | 1.01e+00 | 0.1177 |
| 55749 | CCAR1 | P4T-E | Human | Esophagus | ESCC | 6.25e-46 | 1.23e+00 | 0.1323 |
| 55749 | CCAR1 | P5T-E | Human | Esophagus | ESCC | 2.86e-32 | 8.56e-01 | 0.1327 |
| 55749 | CCAR1 | P8T-E | Human | Esophagus | ESCC | 1.60e-29 | 7.19e-01 | 0.0889 |
| 55749 | CCAR1 | P9T-E | Human | Esophagus | ESCC | 2.64e-18 | 6.13e-01 | 0.1131 |
| 55749 | CCAR1 | P10T-E | Human | Esophagus | ESCC | 1.98e-30 | 6.79e-01 | 0.116 |
| 55749 | CCAR1 | P11T-E | Human | Esophagus | ESCC | 1.10e-20 | 9.25e-01 | 0.1426 |
| 55749 | CCAR1 | P12T-E | Human | Esophagus | ESCC | 4.59e-38 | 1.04e+00 | 0.1122 |
| 55749 | CCAR1 | P15T-E | Human | Esophagus | ESCC | 8.13e-24 | 7.34e-01 | 0.1149 |
| 55749 | CCAR1 | P16T-E | Human | Esophagus | ESCC | 1.79e-41 | 9.25e-01 | 0.1153 |
| Page: 1 2 3 4 5 6 7 8 |
| Tissue | Expression Dynamics | Abbreviation |
| Esophagus | 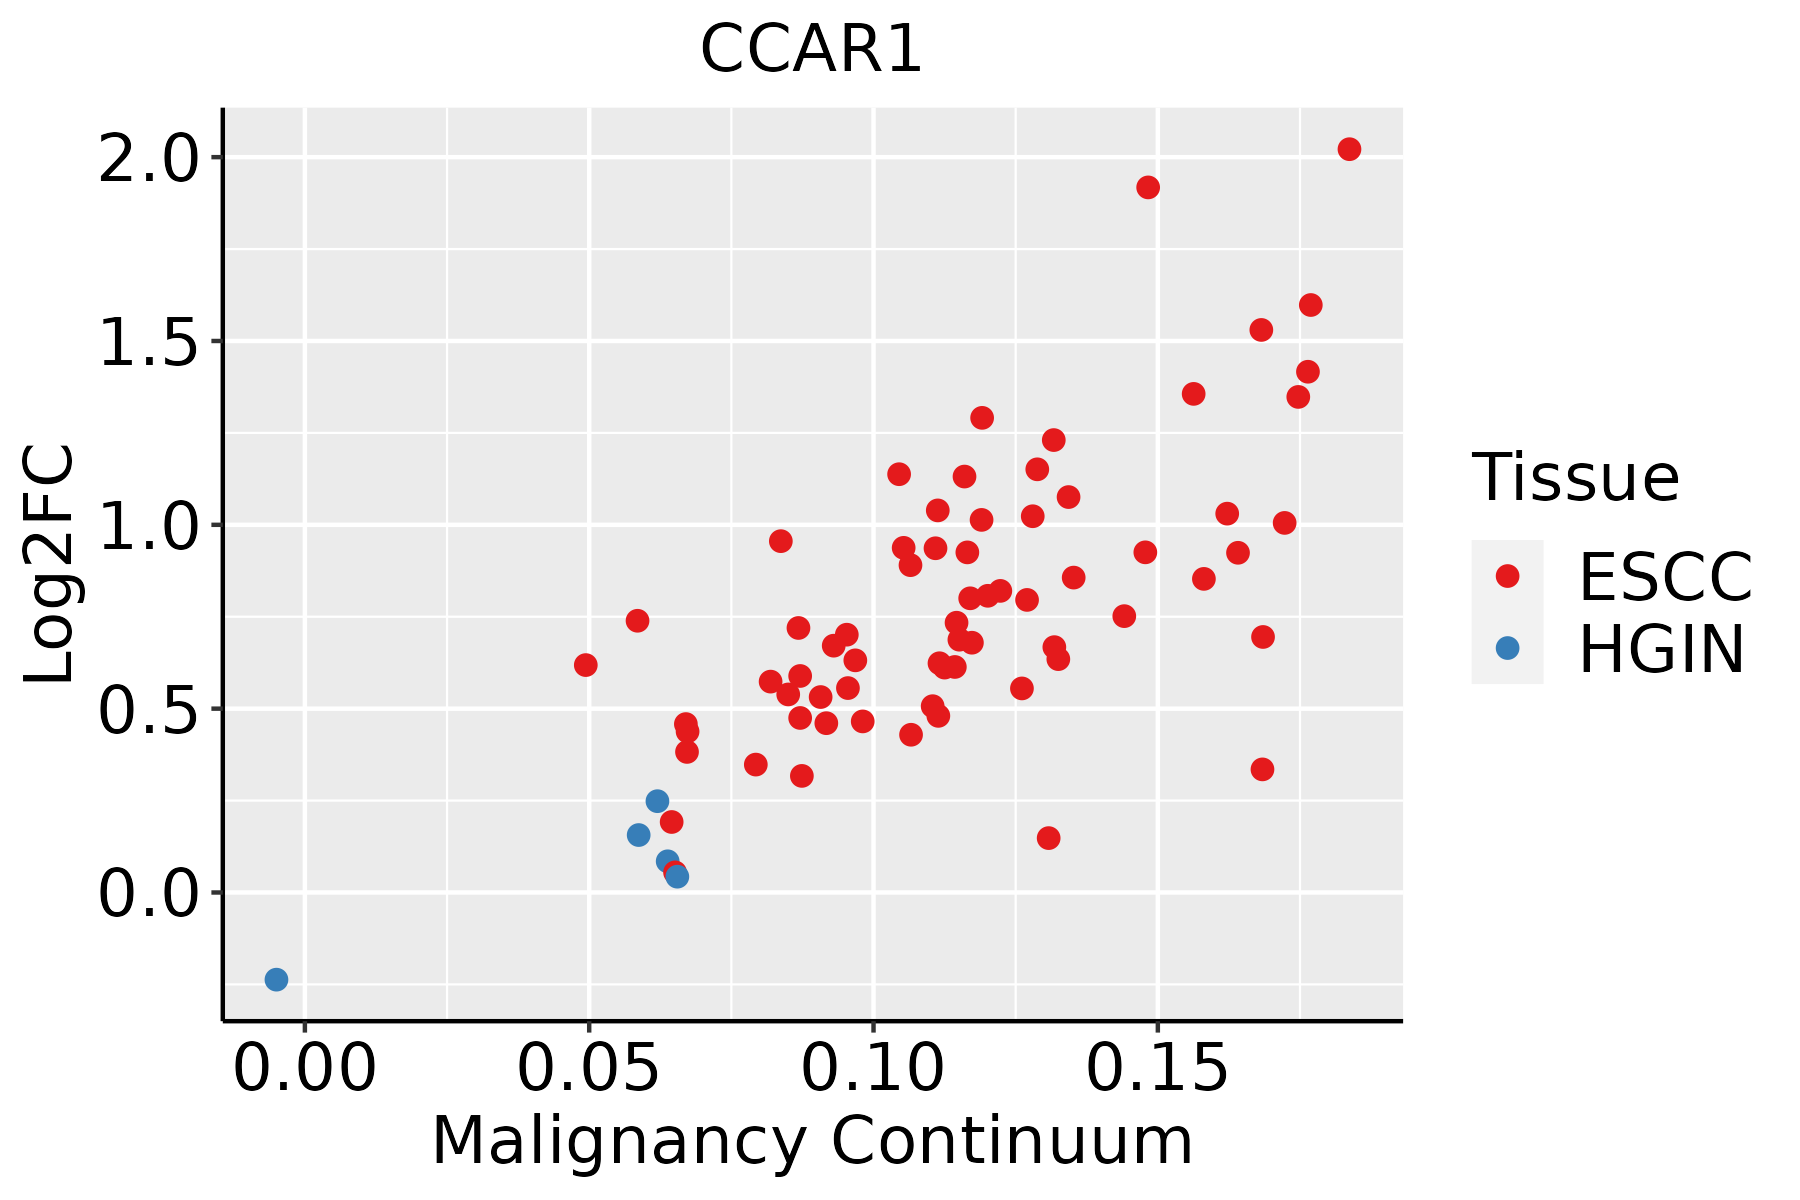 | ESCC: Esophageal squamous cell carcinoma |
| HGIN: High-grade intraepithelial neoplasias | ||
| LGIN: Low-grade intraepithelial neoplasias | ||
| Liver |  | HCC: Hepatocellular carcinoma |
| NAFLD: Non-alcoholic fatty liver disease | ||
| Oral Cavity | 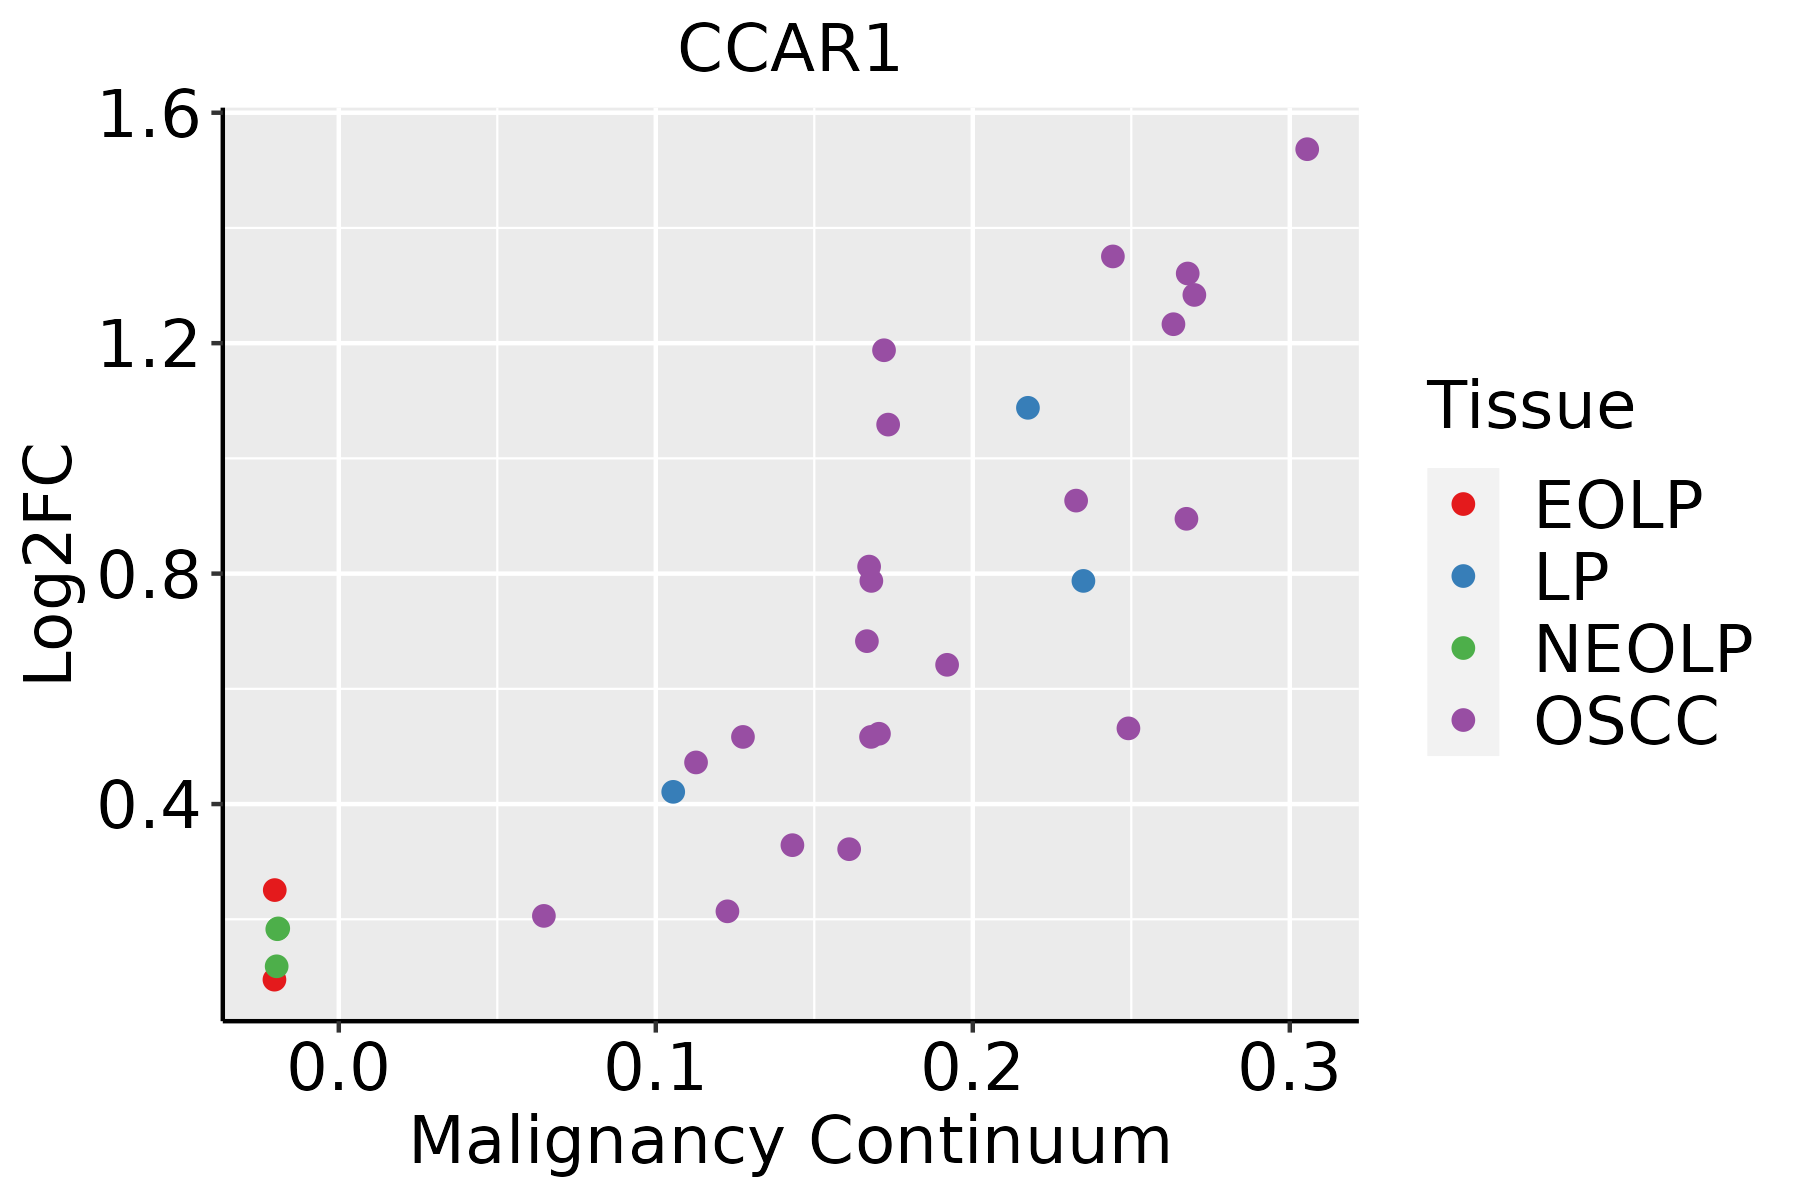 | EOLP: Erosive Oral lichen planus |
| LP: leukoplakia | ||
| NEOLP: Non-erosive oral lichen planus | ||
| OSCC: Oral squamous cell carcinoma | ||
| Prostate |  | BPH: Benign Prostatic Hyperplasia |
| Skin | 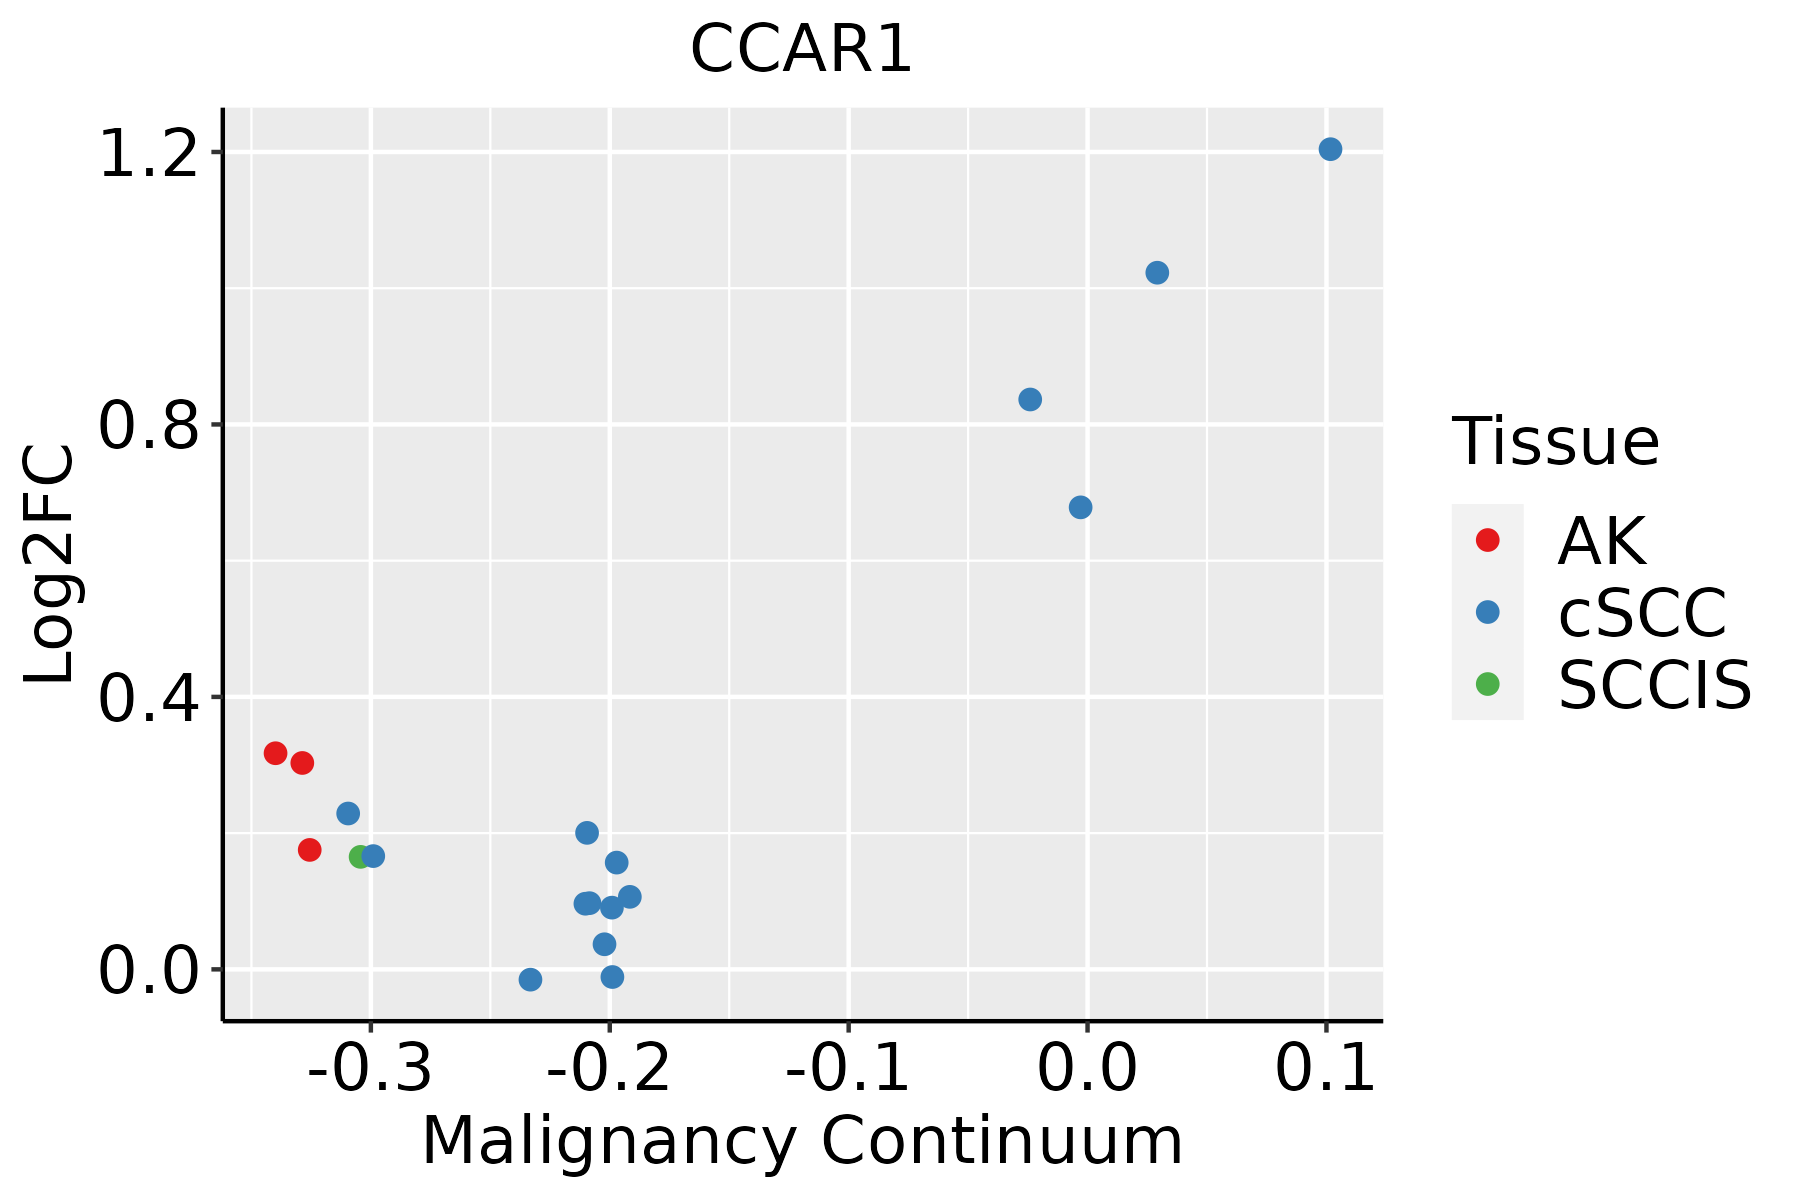 | AK: Actinic keratosis |
| cSCC: Cutaneous squamous cell carcinoma | ||
| SCCIS:squamous cell carcinoma in situ | ||
| Thyroid |  | ATC: Anaplastic thyroid cancer |
| HT: Hashimoto's thyroiditis | ||
| PTC: Papillary thyroid cancer |
| ∗log2FC in expression of this searched gene in stem-like cells from each diseased tissue sample relative to stem-like cells in normal samples in each tissue plotted against the malignancy continuum. Samples are colored based on if they are from different disease stage. |
Top |
Malignant transformation related pathway analysis |
| Find out the enriched GO biological processes and KEGG pathways involved in transition from healthy to precancer to cancer |
| Tissue | Disease Stage | Enriched GO biological Processes |
| Colorectum | AD |  |
| Colorectum | SER |  |
| Colorectum | MSS |  |
| Colorectum | MSI-H |  |
| Colorectum | FAP |  |
| ∗Top 15 enriched GO BP terms are showed in the bar plot of each disease state in each tissue. Each row represents a significant GO biological process which is colored according to the -log10(p.adjust). |
| Page: 1 2 3 4 5 6 7 8 9 |
| GO ID | Tissue | Disease Stage | Description | Gene Ratio | Bg Ratio | pvalue | p.adjust | Count |
| Page: 1 |
| Pathway ID | Tissue | Disease Stage | Description | Gene Ratio | Bg Ratio | pvalue | p.adjust | qvalue | Count |
| Page: 1 |
Top |
Cell-cell communication analysis |
| Identification of potential cell-cell interactions between two cell types and their ligand-receptor pairs for different disease states |
| Ligand | Receptor | LRpair | Pathway | Tissue | Disease Stage |
| Page: 1 |
Top |
Single-cell gene regulatory network inference analysis |
| Find out the significant the regulons (TFs) and the target genes of each regulon across cell types for different disease states |
| TF | Cell Type | Tissue | Disease Stage | Target Gene | RSS | Regulon Activity |
| ∗The dot plots of a searched regulon are shown for all cell subpopulations in each disease state of each tissue based on the regulon specific score inferred using pySCENIC and by calculating the average expression. |
| Page: 1 |
Top |
Somatic mutation of malignant transformation related genes |
| Annotation of somatic variants for genes involved in malignant transformation |
| Hugo Symbol | Variant Class | Variant Classification | dbSNP RS | HGVSc | HGVSp | HGVSp Short | SWISSPROT | BIOTYPE | SIFT | PolyPhen | Tumor Sample Barcode | Tissue | Histology | Sex | Age | Stage | Therapy Types | Drugs | Outcome |
| CCAR1 | SNV | Missense_Mutation | c.1983N>T | p.Gln661His | p.Q661H | Q8IX12 | protein_coding | deleterious(0) | probably_damaging(0.995) | TCGA-A2-A25A-01 | Breast | breast invasive carcinoma | Female | <65 | I/II | Unspecific | Cytoxan | SD | |
| CCAR1 | SNV | Missense_Mutation | c.3080N>C | p.Tyr1027Ser | p.Y1027S | Q8IX12 | protein_coding | deleterious(0.01) | probably_damaging(0.987) | TCGA-A8-A07W-01 | Breast | breast invasive carcinoma | Female | >=65 | III/IV | Hormone Therapy | exemestane | SD | |
| CCAR1 | SNV | Missense_Mutation | rs767729481 | c.1070N>A | p.Arg357His | p.R357H | Q8IX12 | protein_coding | tolerated(0.16) | probably_damaging(0.987) | TCGA-A8-A09Z-01 | Breast | breast invasive carcinoma | Female | >=65 | I/II | Unknown | Unknown | SD |
| CCAR1 | SNV | Missense_Mutation | novel | c.1058G>T | p.Arg353Leu | p.R353L | Q8IX12 | protein_coding | tolerated(0.12) | benign(0.056) | TCGA-AC-A3QQ-01 | Breast | breast invasive carcinoma | Female | <65 | I/II | Unknown | Unknown | SD |
| CCAR1 | SNV | Missense_Mutation | c.2391N>C | p.Glu797Asp | p.E797D | Q8IX12 | protein_coding | tolerated(0.48) | benign(0.003) | TCGA-AN-A0AR-01 | Breast | breast invasive carcinoma | Female | <65 | I/II | Unknown | Unknown | SD | |
| CCAR1 | SNV | Missense_Mutation | c.813G>T | p.Gln271His | p.Q271H | Q8IX12 | protein_coding | deleterious_low_confidence(0.01) | possibly_damaging(0.496) | TCGA-AN-A0FL-01 | Breast | breast invasive carcinoma | Female | <65 | I/II | Unknown | Unknown | SD | |
| CCAR1 | SNV | Missense_Mutation | c.1655G>A | p.Arg552His | p.R552H | Q8IX12 | protein_coding | deleterious(0) | probably_damaging(0.997) | TCGA-AO-A128-01 | Breast | breast invasive carcinoma | Female | <65 | I/II | Chemotherapy | doxorubicin | SD | |
| CCAR1 | SNV | Missense_Mutation | c.1945G>A | p.Glu649Lys | p.E649K | Q8IX12 | protein_coding | tolerated(0.17) | possibly_damaging(0.767) | TCGA-LL-A73Y-01 | Breast | breast invasive carcinoma | Female | >=65 | I/II | Chemotherapy | taxotere | SD | |
| CCAR1 | deletion | In_Frame_Del | novel | c.1508_1528delNNNNNNNNNNNNNNNNNNNNN | p.His503_Gly510delinsArg | p.H503_G510delinsR | Q8IX12 | protein_coding | TCGA-GM-A3XL-01 | Breast | breast invasive carcinoma | Female | <65 | I/II | Chemotherapy | fluorouracil | CR | ||
| CCAR1 | deletion | Frame_Shift_Del | novel | c.990_993delNNNN | p.Glu331AspfsTer40 | p.E331Dfs*40 | Q8IX12 | protein_coding | TCGA-LL-A5YM-01 | Breast | breast invasive carcinoma | Female | >=65 | III/IV | Unspecific | letrozole | PD |
| Page: 1 2 3 4 5 6 7 8 9 10 11 12 13 |
Top |
Related drugs of malignant transformation related genes |
| Identification of chemicals and drugs interact with genes involved in malignant transfromation |
| (DGIdb 4.0) |
| Entrez ID | Symbol | Category | Interaction Types | Drug Claim Name | Drug Name | PMIDs |
| Page: 1 |

Copyright 2023-Present -The University of Texas Health Science Center at Houston |