
|
|||||
|
 | |
| |
| |
| |
| |
| |
|
Gene: CC2D2A |
Gene summary for CC2D2A |
| Gene information | Species | Human | Gene symbol | CC2D2A | Gene ID | 57545 |
| Gene name | coiled-coil and C2 domain containing 2A | |
| Gene Alias | COACH2 | |
| Cytomap | 4p15.32 | |
| Gene Type | protein-coding | GO ID | GO:0000226 | UniProtAcc | Q9P2K1 |
Top |
Malignant transformation analysis |
| Identification of the aberrant gene expression in precancerous and cancerous lesions by comparing the gene expression of stem-like cells in diseased tissues with normal stem cells |
| Entrez ID | Symbol | Replicates | Species | Organ | Tissue | Adj P-value | Log2FC | Malignancy |
| 57545 | CC2D2A | HCC1_Meng | Human | Liver | HCC | 3.95e-35 | 2.17e-02 | 0.0246 |
| 57545 | CC2D2A | HCC2_Meng | Human | Liver | HCC | 1.28e-03 | 1.46e-03 | 0.0107 |
| 57545 | CC2D2A | HCC1 | Human | Liver | HCC | 4.34e-09 | 1.83e+00 | 0.5336 |
| 57545 | CC2D2A | HCC2 | Human | Liver | HCC | 1.51e-30 | 1.90e+00 | 0.5341 |
| 57545 | CC2D2A | HCC5 | Human | Liver | HCC | 1.06e-09 | 1.50e+00 | 0.4932 |
| 57545 | CC2D2A | C04 | Human | Oral cavity | OSCC | 3.67e-02 | 2.00e-01 | 0.2633 |
| 57545 | CC2D2A | C21 | Human | Oral cavity | OSCC | 4.62e-09 | 2.98e-01 | 0.2678 |
| 57545 | CC2D2A | C30 | Human | Oral cavity | OSCC | 1.29e-22 | 7.34e-01 | 0.3055 |
| 57545 | CC2D2A | C06 | Human | Oral cavity | OSCC | 2.03e-06 | 6.19e-01 | 0.2699 |
| 57545 | CC2D2A | SYSMH3 | Human | Oral cavity | OSCC | 1.45e-06 | 2.04e-01 | 0.2442 |
| Page: 1 |
| Tissue | Expression Dynamics | Abbreviation |
| Liver | 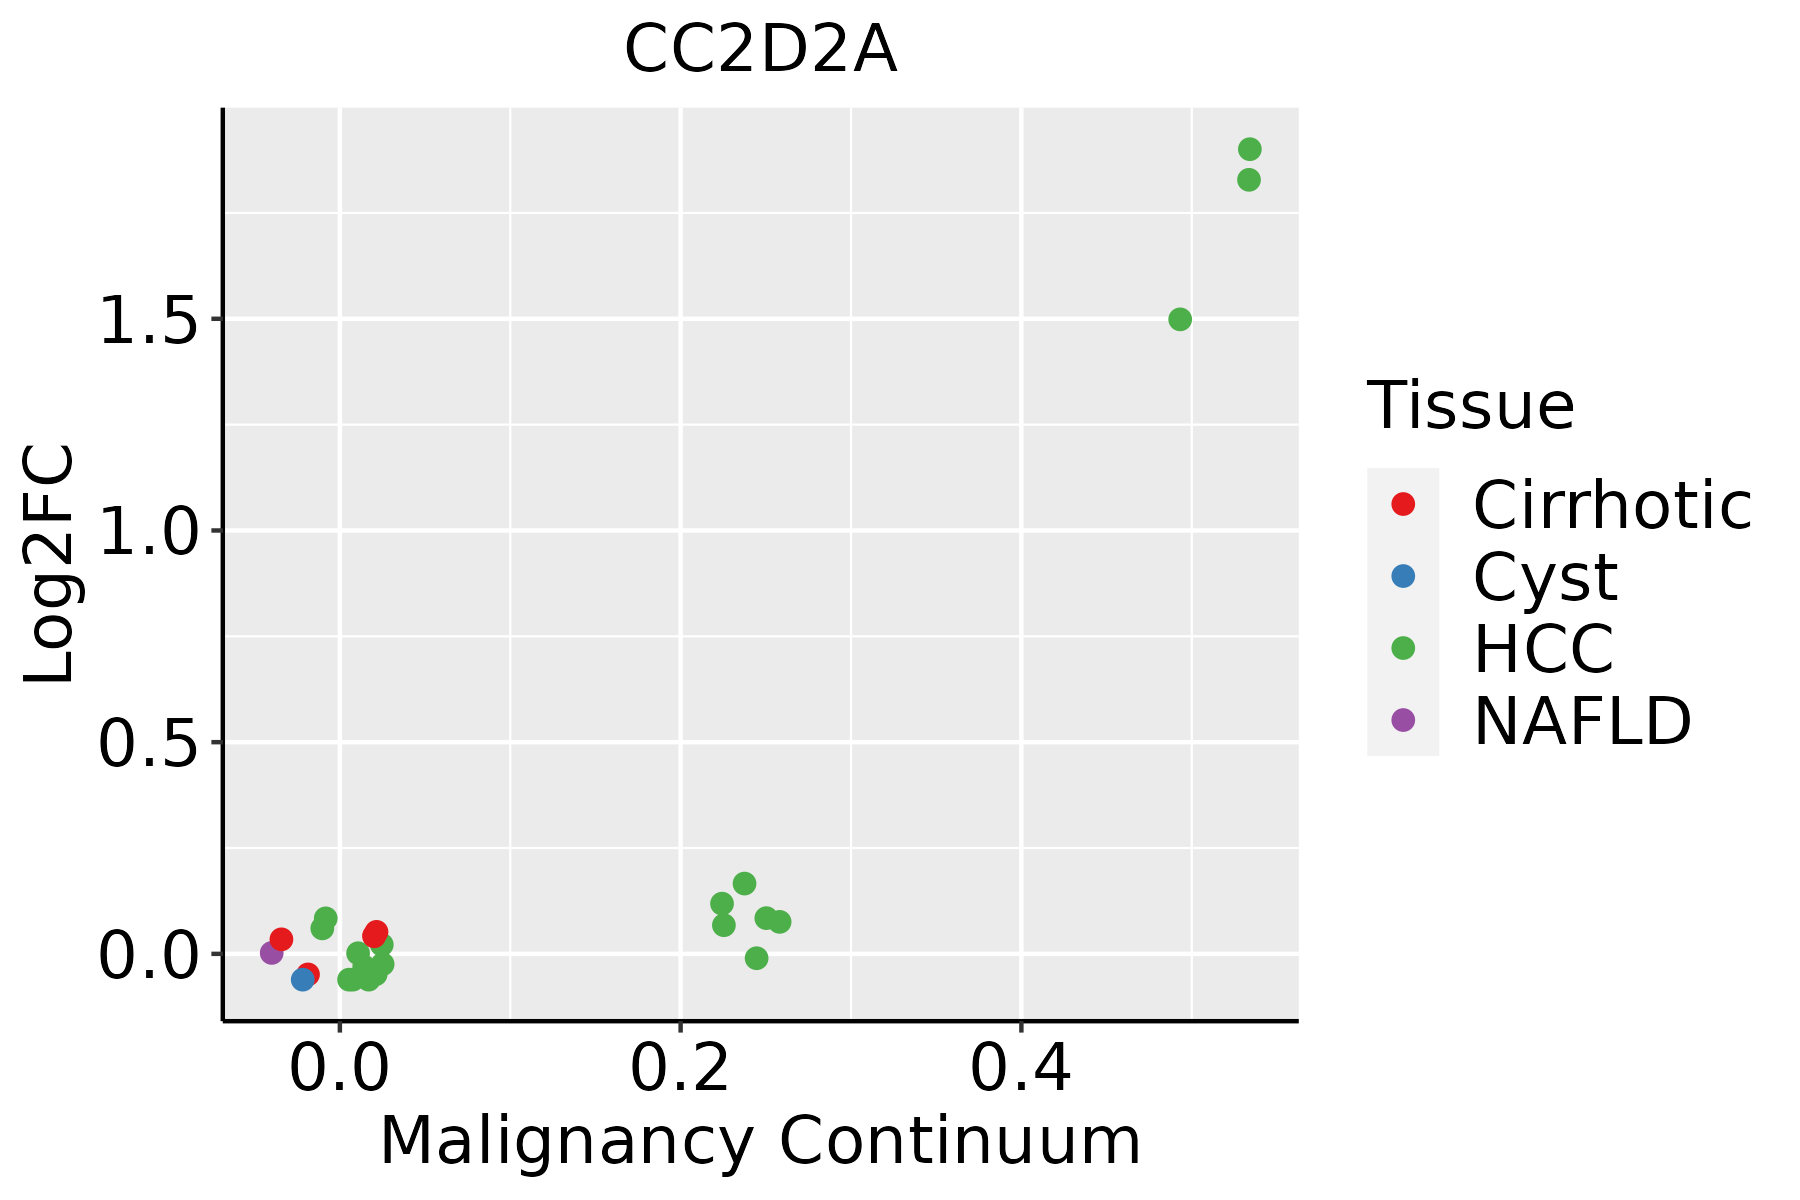 | HCC: Hepatocellular carcinoma |
| NAFLD: Non-alcoholic fatty liver disease | ||
| Oral Cavity |  | EOLP: Erosive Oral lichen planus |
| LP: leukoplakia | ||
| NEOLP: Non-erosive oral lichen planus | ||
| OSCC: Oral squamous cell carcinoma |
| ∗log2FC in expression of this searched gene in stem-like cells from each diseased tissue sample relative to stem-like cells in normal samples in each tissue plotted against the malignancy continuum. Samples are colored based on if they are from different disease stage. |
Top |
Malignant transformation related pathway analysis |
| Find out the enriched GO biological processes and KEGG pathways involved in transition from healthy to precancer to cancer |
| Tissue | Disease Stage | Enriched GO biological Processes |
| Colorectum | AD |  |
| Colorectum | SER |  |
| Colorectum | MSS |  |
| Colorectum | MSI-H |  |
| Colorectum | FAP |  |
| ∗Top 15 enriched GO BP terms are showed in the bar plot of each disease state in each tissue. Each row represents a significant GO biological process which is colored according to the -log10(p.adjust). |
| Page: 1 2 3 4 5 6 7 8 9 |
| GO ID | Tissue | Disease Stage | Description | Gene Ratio | Bg Ratio | pvalue | p.adjust | Count |
| GO:00018415 | Liver | HCC | neural tube formation | 62/7958 | 102/18723 | 1.47e-04 | 1.18e-03 | 62 |
| GO:00018433 | Liver | HCC | neural tube closure | 53/7958 | 88/18723 | 5.95e-04 | 3.75e-03 | 53 |
| GO:00140204 | Liver | HCC | primary neural tube formation | 56/7958 | 94/18723 | 6.19e-04 | 3.86e-03 | 56 |
| GO:00606063 | Liver | HCC | tube closure | 53/7958 | 89/18723 | 8.67e-04 | 5.14e-03 | 53 |
| GO:00016553 | Liver | HCC | urogenital system development | 170/7958 | 338/18723 | 2.15e-03 | 1.08e-02 | 170 |
| GO:00219154 | Liver | HCC | neural tube development | 82/7958 | 152/18723 | 2.83e-03 | 1.33e-02 | 82 |
| GO:00018222 | Liver | HCC | kidney development | 148/7958 | 293/18723 | 3.25e-03 | 1.49e-02 | 148 |
| GO:00720012 | Liver | HCC | renal system development | 152/7958 | 302/18723 | 3.45e-03 | 1.56e-02 | 152 |
| GO:00018384 | Liver | HCC | embryonic epithelial tube formation | 66/7958 | 121/18723 | 4.94e-03 | 2.07e-02 | 66 |
| GO:00721754 | Liver | HCC | epithelial tube formation | 70/7958 | 132/18723 | 9.29e-03 | 3.57e-02 | 70 |
| GO:00351484 | Liver | HCC | tube formation | 77/7958 | 148/18723 | 1.20e-02 | 4.39e-02 | 77 |
| GO:000184110 | Oral cavity | OSCC | neural tube formation | 60/7305 | 102/18723 | 3.90e-05 | 3.43e-04 | 60 |
| GO:00140208 | Oral cavity | OSCC | primary neural tube formation | 55/7305 | 94/18723 | 9.87e-05 | 7.43e-04 | 55 |
| GO:00018437 | Oral cavity | OSCC | neural tube closure | 52/7305 | 88/18723 | 1.06e-04 | 7.84e-04 | 52 |
| GO:00606066 | Oral cavity | OSCC | tube closure | 52/7305 | 89/18723 | 1.59e-04 | 1.10e-03 | 52 |
| GO:00018388 | Oral cavity | OSCC | embryonic epithelial tube formation | 66/7305 | 121/18723 | 3.70e-04 | 2.26e-03 | 66 |
| GO:003514810 | Oral cavity | OSCC | tube formation | 78/7305 | 148/18723 | 4.82e-04 | 2.85e-03 | 78 |
| GO:00163315 | Oral cavity | OSCC | morphogenesis of embryonic epithelium | 77/7305 | 147/18723 | 6.63e-04 | 3.72e-03 | 77 |
| GO:00016558 | Oral cavity | OSCC | urogenital system development | 160/7305 | 338/18723 | 1.03e-03 | 5.31e-03 | 160 |
| GO:00721758 | Oral cavity | OSCC | epithelial tube formation | 69/7305 | 132/18723 | 1.32e-03 | 6.56e-03 | 69 |
| Page: 1 2 |
| Pathway ID | Tissue | Disease Stage | Description | Gene Ratio | Bg Ratio | pvalue | p.adjust | qvalue | Count |
| Page: 1 |
Top |
Cell-cell communication analysis |
| Identification of potential cell-cell interactions between two cell types and their ligand-receptor pairs for different disease states |
| Ligand | Receptor | LRpair | Pathway | Tissue | Disease Stage |
| Page: 1 |
Top |
Single-cell gene regulatory network inference analysis |
| Find out the significant the regulons (TFs) and the target genes of each regulon across cell types for different disease states |
| TF | Cell Type | Tissue | Disease Stage | Target Gene | RSS | Regulon Activity |
| ∗The dot plots of a searched regulon are shown for all cell subpopulations in each disease state of each tissue based on the regulon specific score inferred using pySCENIC and by calculating the average expression. |
| Page: 1 |
Top |
Somatic mutation of malignant transformation related genes |
| Annotation of somatic variants for genes involved in malignant transformation |
| Hugo Symbol | Variant Class | Variant Classification | dbSNP RS | HGVSc | HGVSp | HGVSp Short | SWISSPROT | BIOTYPE | SIFT | PolyPhen | Tumor Sample Barcode | Tissue | Histology | Sex | Age | Stage | Therapy Types | Drugs | Outcome |
| CC2D2A | SNV | Missense_Mutation | c.1975A>T | p.Ser659Cys | p.S659C | Q9P2K1 | protein_coding | deleterious(0.01) | possibly_damaging(0.698) | TCGA-A2-A0T0-01 | Breast | breast invasive carcinoma | Female | <65 | I/II | Chemotherapy | taxotere | SD | |
| CC2D2A | SNV | Missense_Mutation | c.2740N>T | p.Leu914Phe | p.L914F | Q9P2K1 | protein_coding | deleterious(0.02) | probably_damaging(0.998) | TCGA-AC-A23H-01 | Breast | breast invasive carcinoma | Female | >=65 | I/II | Unknown | Unknown | PD | |
| CC2D2A | SNV | Missense_Mutation | novel | c.3074N>A | p.Arg1025Lys | p.R1025K | Q9P2K1 | protein_coding | deleterious(0) | probably_damaging(0.998) | TCGA-AC-A3W6-01 | Breast | breast invasive carcinoma | Female | >=65 | III/IV | Unknown | Unknown | SD |
| CC2D2A | SNV | Missense_Mutation | c.2482C>T | p.Arg828Trp | p.R828W | Q9P2K1 | protein_coding | tolerated(0.18) | possibly_damaging(0.888) | TCGA-AN-A046-01 | Breast | breast invasive carcinoma | Female | >=65 | I/II | Unknown | Unknown | SD | |
| CC2D2A | SNV | Missense_Mutation | c.3233N>T | p.Ala1078Val | p.A1078V | Q9P2K1 | protein_coding | tolerated(0.14) | benign(0.009) | TCGA-AN-A0AK-01 | Breast | breast invasive carcinoma | Female | >=65 | I/II | Unknown | Unknown | SD | |
| CC2D2A | SNV | Missense_Mutation | novel | c.4053G>C | p.Trp1351Cys | p.W1351C | Q9P2K1 | protein_coding | deleterious(0) | probably_damaging(1) | TCGA-AN-A0AL-01 | Breast | breast invasive carcinoma | Female | <65 | III/IV | Unknown | Unknown | SD |
| CC2D2A | SNV | Missense_Mutation | novel | c.1103N>T | p.Thr368Ile | p.T368I | Q9P2K1 | protein_coding | tolerated(0.09) | benign(0.047) | TCGA-BH-A0HF-01 | Breast | breast invasive carcinoma | Female | >=65 | I/II | Hormone Therapy | arimidex | SD |
| CC2D2A | SNV | Missense_Mutation | c.238G>T | p.Gly80Cys | p.G80C | Q9P2K1 | protein_coding | deleterious_low_confidence(0) | probably_damaging(0.976) | TCGA-BH-A18G-01 | Breast | breast invasive carcinoma | Female | >=65 | I/II | Unknown | Unknown | SD | |
| CC2D2A | insertion | Nonsense_Mutation | novel | c.4845_4846insTTTTGAAAGTAC | p.Ser1615_Leu1616insPheTerLysTyr | p.S1615_L1616insF*KY | Q9P2K1 | protein_coding | TCGA-AR-A0U0-01 | Breast | breast invasive carcinoma | Female | >=65 | I/II | Unknown | Unknown | SD | ||
| CC2D2A | insertion | Frame_Shift_Ins | novel | c.4847_4848insAG | p.Ile1617ValfsTer16 | p.I1617Vfs*16 | Q9P2K1 | protein_coding | TCGA-AR-A0U0-01 | Breast | breast invasive carcinoma | Female | >=65 | I/II | Unknown | Unknown | SD |
| Page: 1 2 3 4 5 6 7 8 9 10 11 12 13 14 15 |
Top |
Related drugs of malignant transformation related genes |
| Identification of chemicals and drugs interact with genes involved in malignant transfromation |
| (DGIdb 4.0) |
| Entrez ID | Symbol | Category | Interaction Types | Drug Claim Name | Drug Name | PMIDs |
| Page: 1 |

Copyright 2023-Present -The University of Texas Health Science Center at Houston |