Schematic overview of the cellular and molecular mechanisms involved in the cancer progression, including the proposed cellular and molecular mechanisms in cancer cells trajectory. AT1: alveolar type 1 cells; AT2: alveolar type 2 cells; AAH: atypical adenomatous hyperplasia; AIS: adenocarcinoma in situ; MIA: minimally invasive adenocarcinoma; IA: invasive adenocarcinoma; EMT: epithelial-mesenchymal transition

Home

Download

Statistics

Help

Contact

Center for Computational Systems Medicine
leaf

Gene summary

leaf

Malignant transformation analysis

leaf

Malignant transformation related pathway analysis

leaf

Cell-cell communication analysis

leaf

Single-cell gene regulatory network inference analysis

leaf

Somatic mutation of malignant transformation related genes

leaf

Related drugs of malignant transformation related genes

Gene: CC2D1A

Gene summary for CC2D1A

check button Gene summary.

Gene informationSpeciesHuman
Gene symbol

CC2D1A

Gene ID

54862

Gene namecoiled-coil and C2 domain containing 1A
Gene AliasAki-1
Cytomap19p13.12
Gene Typeprotein-coding
GO ID

GO:0000122

UniProtAcc

Q6P1N0


Top

Malignant transformation analysis

check button Identification of the aberrant gene expression in precancerous and cancerous lesions by comparing the gene expression of stem-like cells in diseased tissues with normal stem cells
check button Malignant transformation involving gene list.
Entrez IDSymbolReplicatesSpeciesOrganTissueAdj P-valueLog2FCMalignancy
54862CC2D1AHTA11_1391_2000001011HumanColorectumAD5.61e-034.58e-01-0.059
54862CC2D1AHTA11_546_2000001011HumanColorectumAD7.97e-034.14e-01-0.0842
54862CC2D1AHTA11_10711_2000001011HumanColorectumAD2.01e-034.43e-010.0338
54862CC2D1AHTA11_7696_3000711011HumanColorectumAD1.07e-106.04e-010.0674
54862CC2D1AA015-C-203HumanColorectumFAP1.06e-124.26e-02-0.1294
54862CC2D1AA002-C-201HumanColorectumFAP6.42e-03-4.92e-020.0324
54862CC2D1AA001-C-108HumanColorectumFAP2.37e-05-9.27e-02-0.0272
54862CC2D1AA002-C-205HumanColorectumFAP7.69e-09-2.46e-01-0.1236
54862CC2D1AA015-C-006HumanColorectumFAP7.24e-05-4.65e-02-0.0994
54862CC2D1AA015-C-106HumanColorectumFAP2.17e-042.72e-04-0.0511
54862CC2D1AA002-C-114HumanColorectumFAP1.85e-05-2.68e-02-0.1561
54862CC2D1AA015-C-104HumanColorectumFAP1.90e-12-2.86e-02-0.1899
54862CC2D1AA001-C-014HumanColorectumFAP1.63e-03-1.42e-010.0135
54862CC2D1AA002-C-016HumanColorectumFAP2.01e-10-2.26e-010.0521
54862CC2D1AA015-C-002HumanColorectumFAP5.12e-04-2.27e-01-0.0763
54862CC2D1AA001-C-203HumanColorectumFAP1.88e-05-8.55e-02-0.0481
54862CC2D1AA002-C-116HumanColorectumFAP2.75e-12-2.95e-01-0.0452
54862CC2D1AA014-C-008HumanColorectumFAP8.25e-04-1.80e-01-0.191
54862CC2D1AA018-E-020HumanColorectumFAP1.45e-07-2.19e-01-0.2034
54862CC2D1AF034HumanColorectumFAP1.90e-07-1.66e-01-0.0665
Page: 1 2 3 4 5 6 7 

check button Transcriptomic changes along malignancy continuum.
TissueExpression DynamicsAbbreviation
Colorectum (GSE201348)The image shows the transcriptomic changes along malignancy continuum.log2FC in expression of this searched gene in stem-like cells from each diseased tissue sample relative to stem-like cells in normal samples in each tissue plotted against the malignancy continuum. Samples are colored based on if they are from different disease stage.FAP: Familial adenomatous polyposis
CRC: Colorectal cancer
Colorectum (HTA11)The image shows the transcriptomic changes along malignancy continuum.log2FC in expression of this searched gene in stem-like cells from each diseased tissue sample relative to stem-like cells in normal samples in each tissue plotted against the malignancy continuum. Samples are colored based on if they are from different disease stage.AD: Adenomas
SER: Sessile serrated lesions
MSI-H: Microsatellite-high colorectal cancer
MSS: Microsatellite stable colorectal cancer
EsophagusThe image shows the transcriptomic changes along malignancy continuum.log2FC in expression of this searched gene in stem-like cells from each diseased tissue sample relative to stem-like cells in normal samples in each tissue plotted against the malignancy continuum. Samples are colored based on if they are from different disease stage.
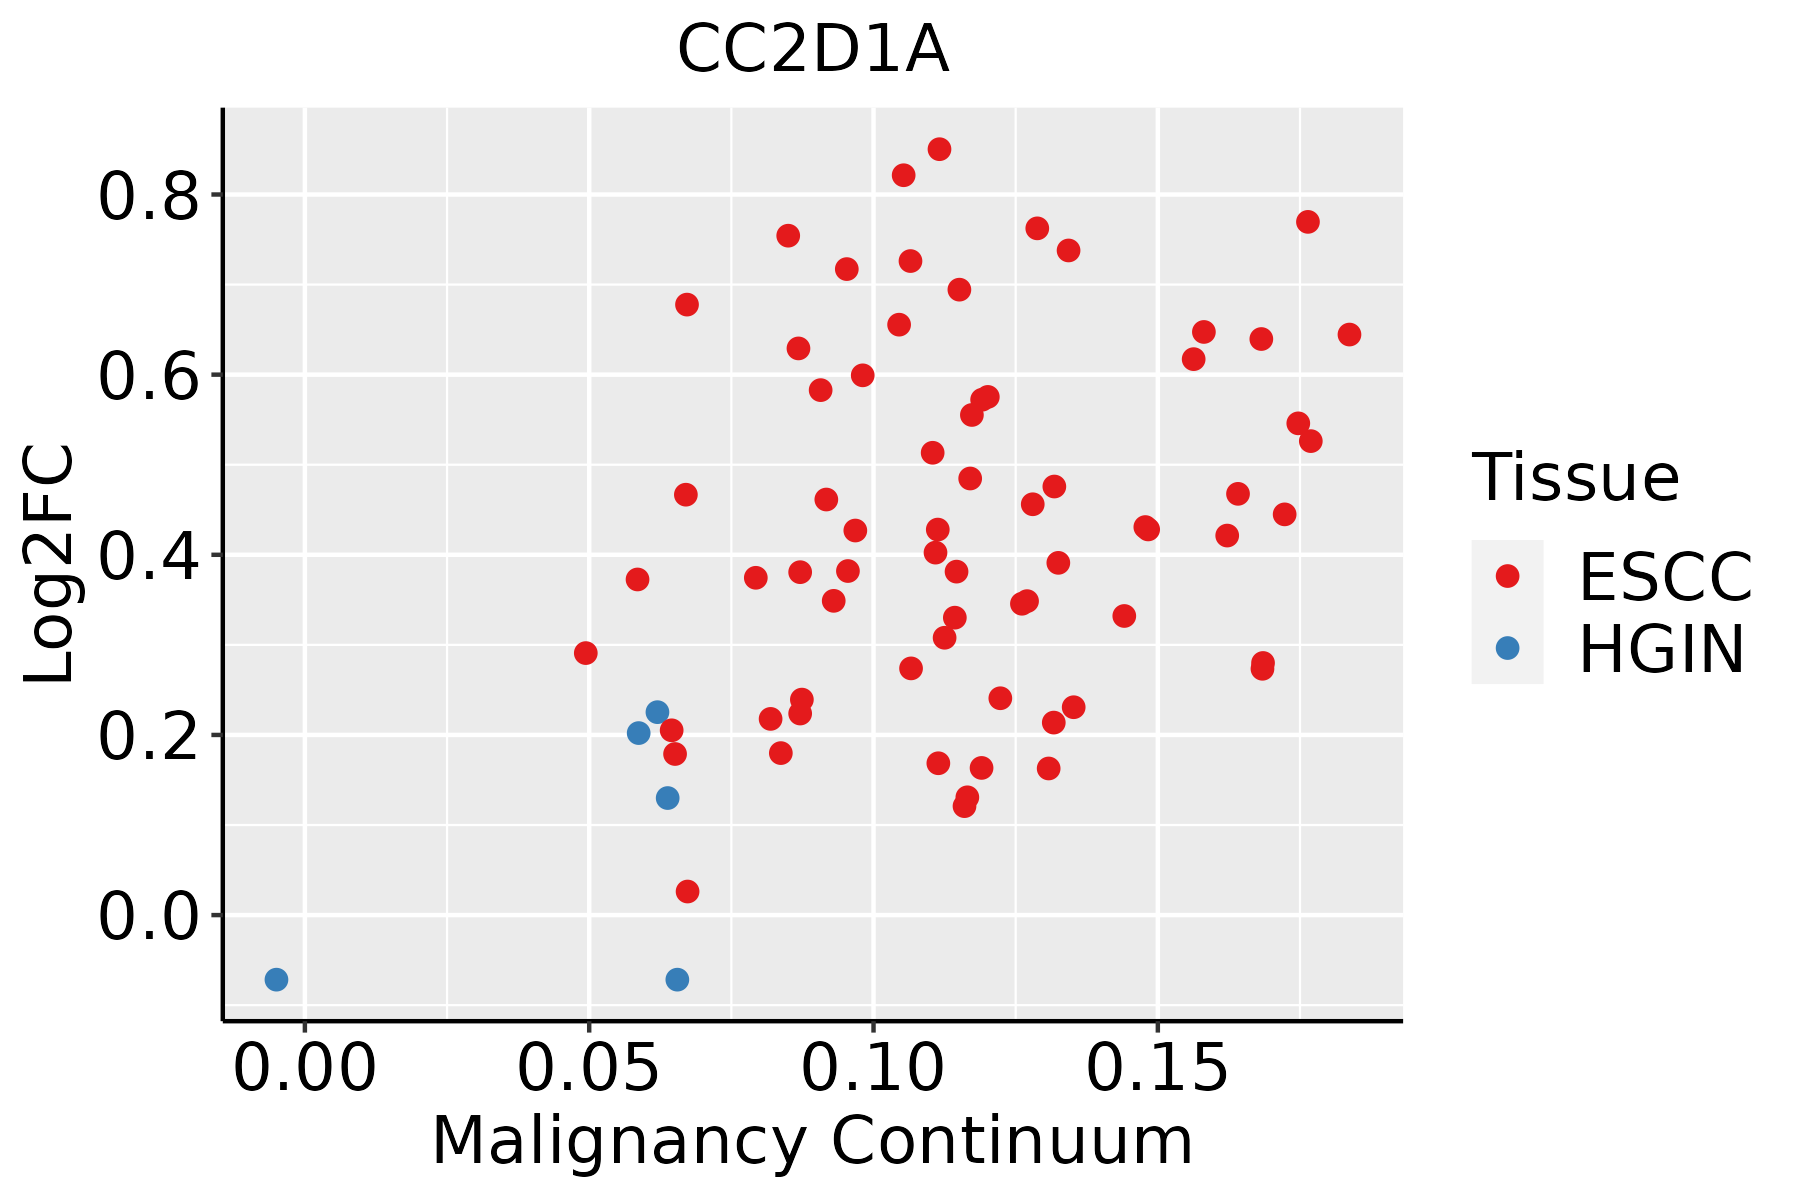
ESCC: Esophageal squamous cell carcinoma
HGIN: High-grade intraepithelial neoplasias
LGIN: Low-grade intraepithelial neoplasias
LungThe image shows the transcriptomic changes along malignancy continuum.log2FC in expression of this searched gene in stem-like cells from each diseased tissue sample relative to stem-like cells in normal samples in each tissue plotted against the malignancy continuum. Samples are colored based on if they are from different disease stage.
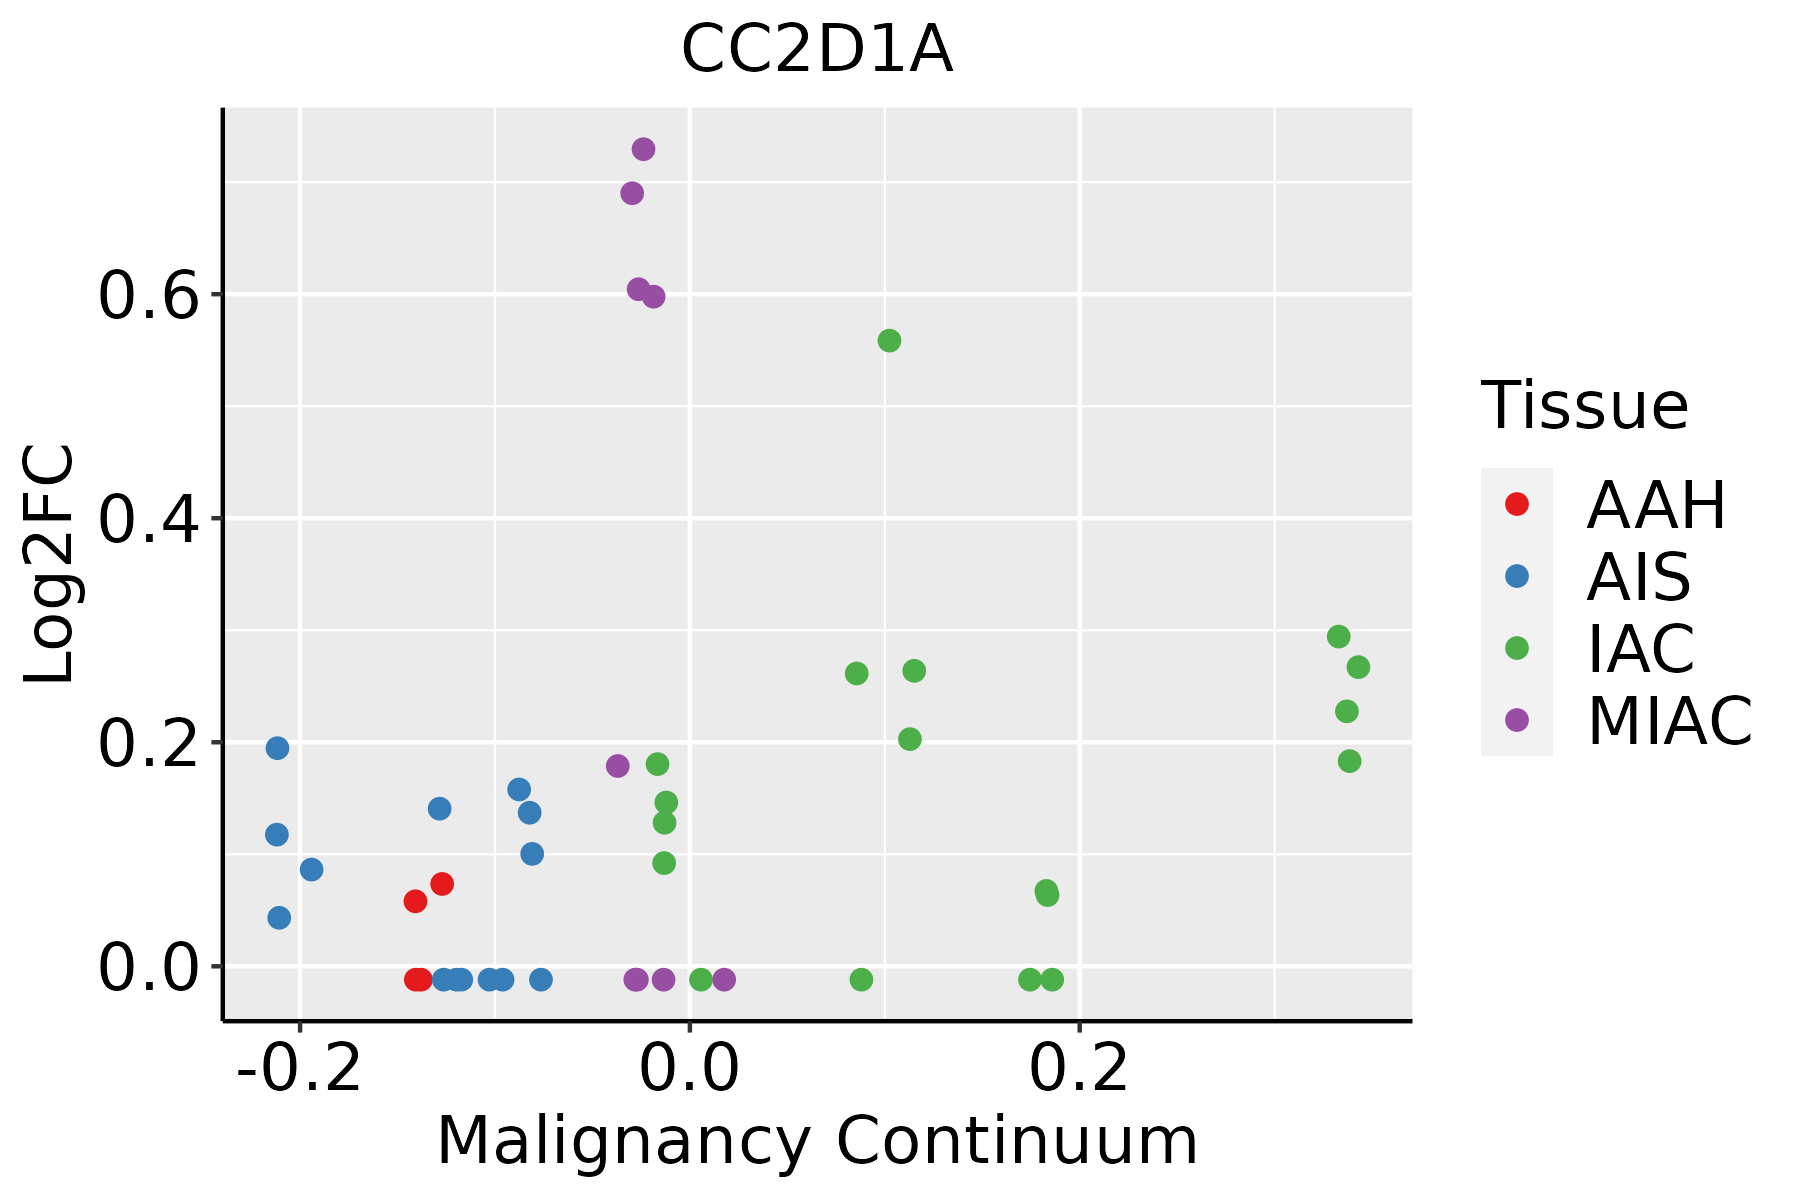
AAH: Atypical adenomatous hyperplasia
AIS: Adenocarcinoma in situ
IAC: Invasive lung adenocarcinoma
MIA: Minimally invasive adenocarcinoma
Oral CavityThe image shows the transcriptomic changes along malignancy continuum.log2FC in expression of this searched gene in stem-like cells from each diseased tissue sample relative to stem-like cells in normal samples in each tissue plotted against the malignancy continuum. Samples are colored based on if they are from different disease stage.
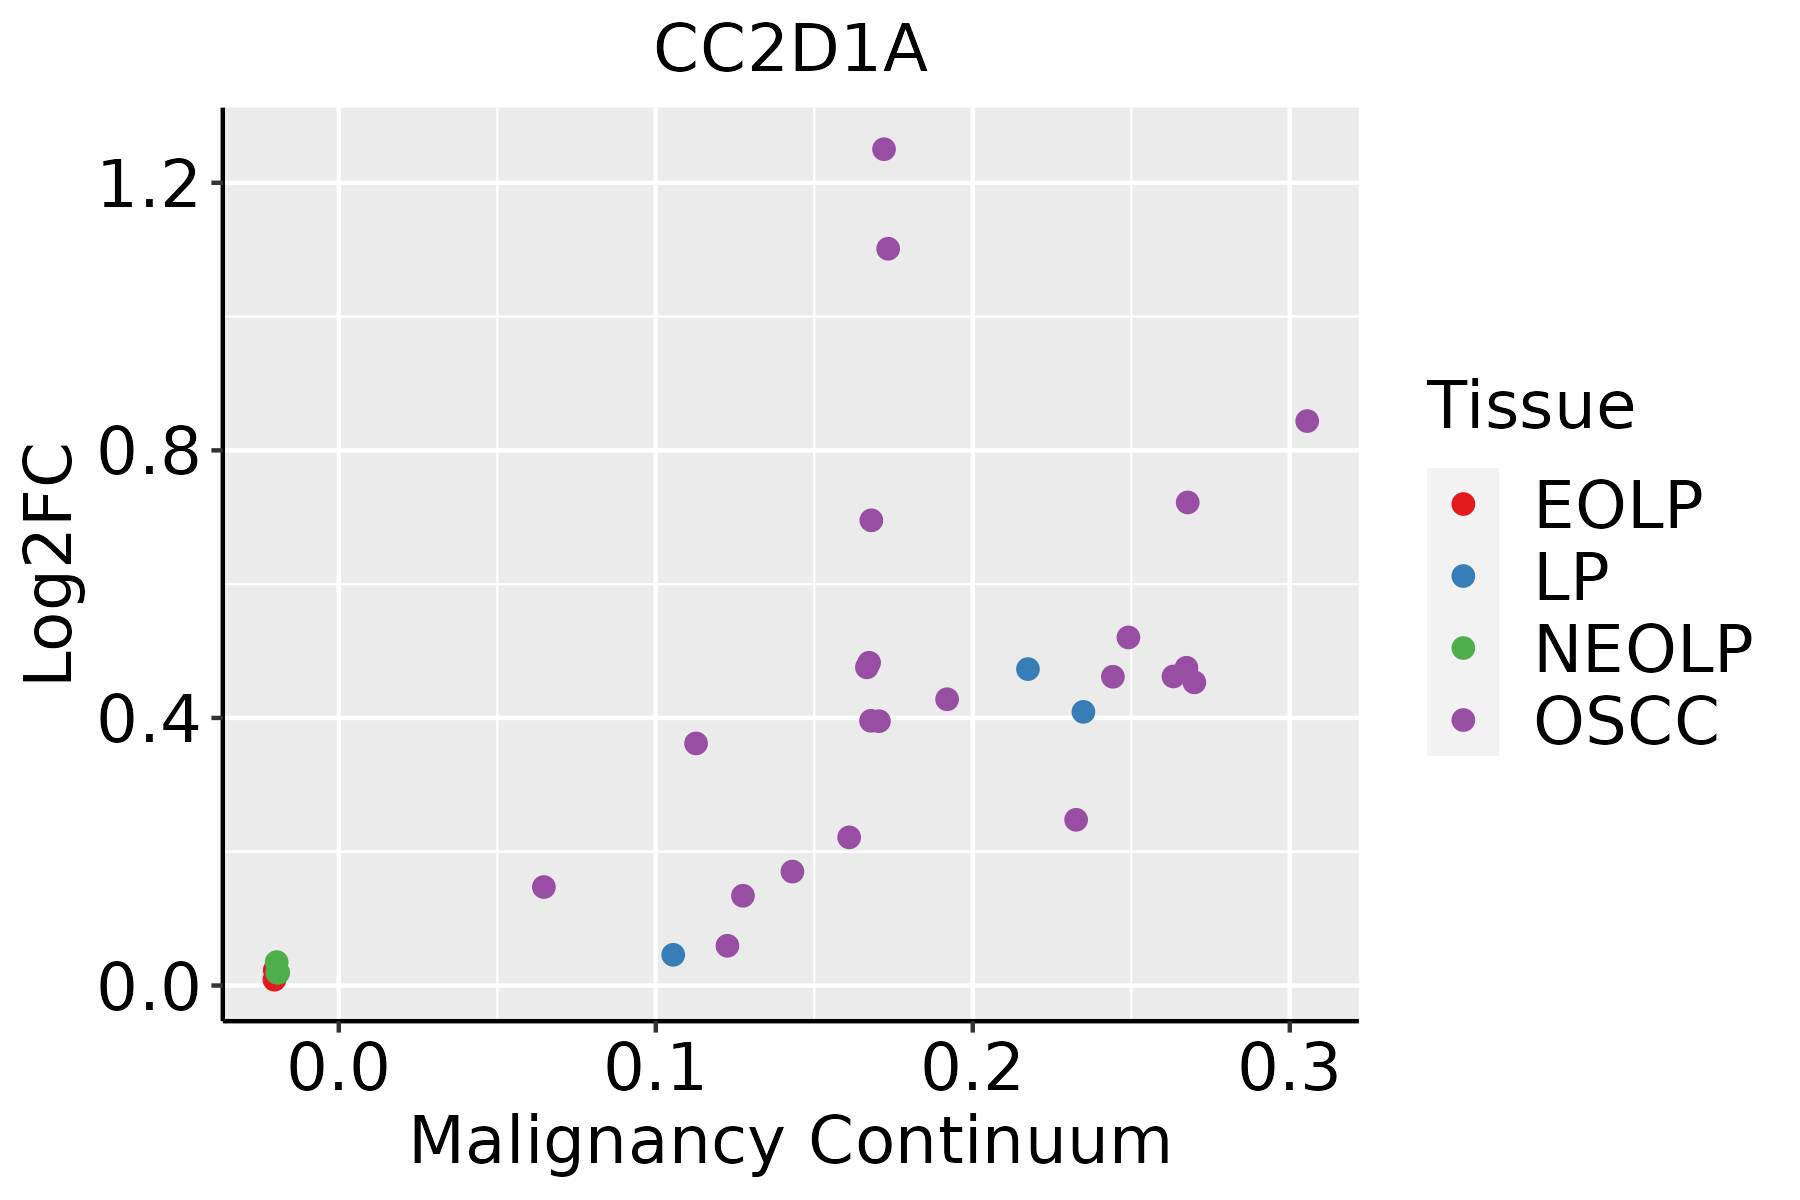
EOLP: Erosive Oral lichen planus
LP: leukoplakia
NEOLP: Non-erosive oral lichen planus
OSCC: Oral squamous cell carcinoma
SkinThe image shows the transcriptomic changes along malignancy continuum.log2FC in expression of this searched gene in stem-like cells from each diseased tissue sample relative to stem-like cells in normal samples in each tissue plotted against the malignancy continuum. Samples are colored based on if they are from different disease stage.
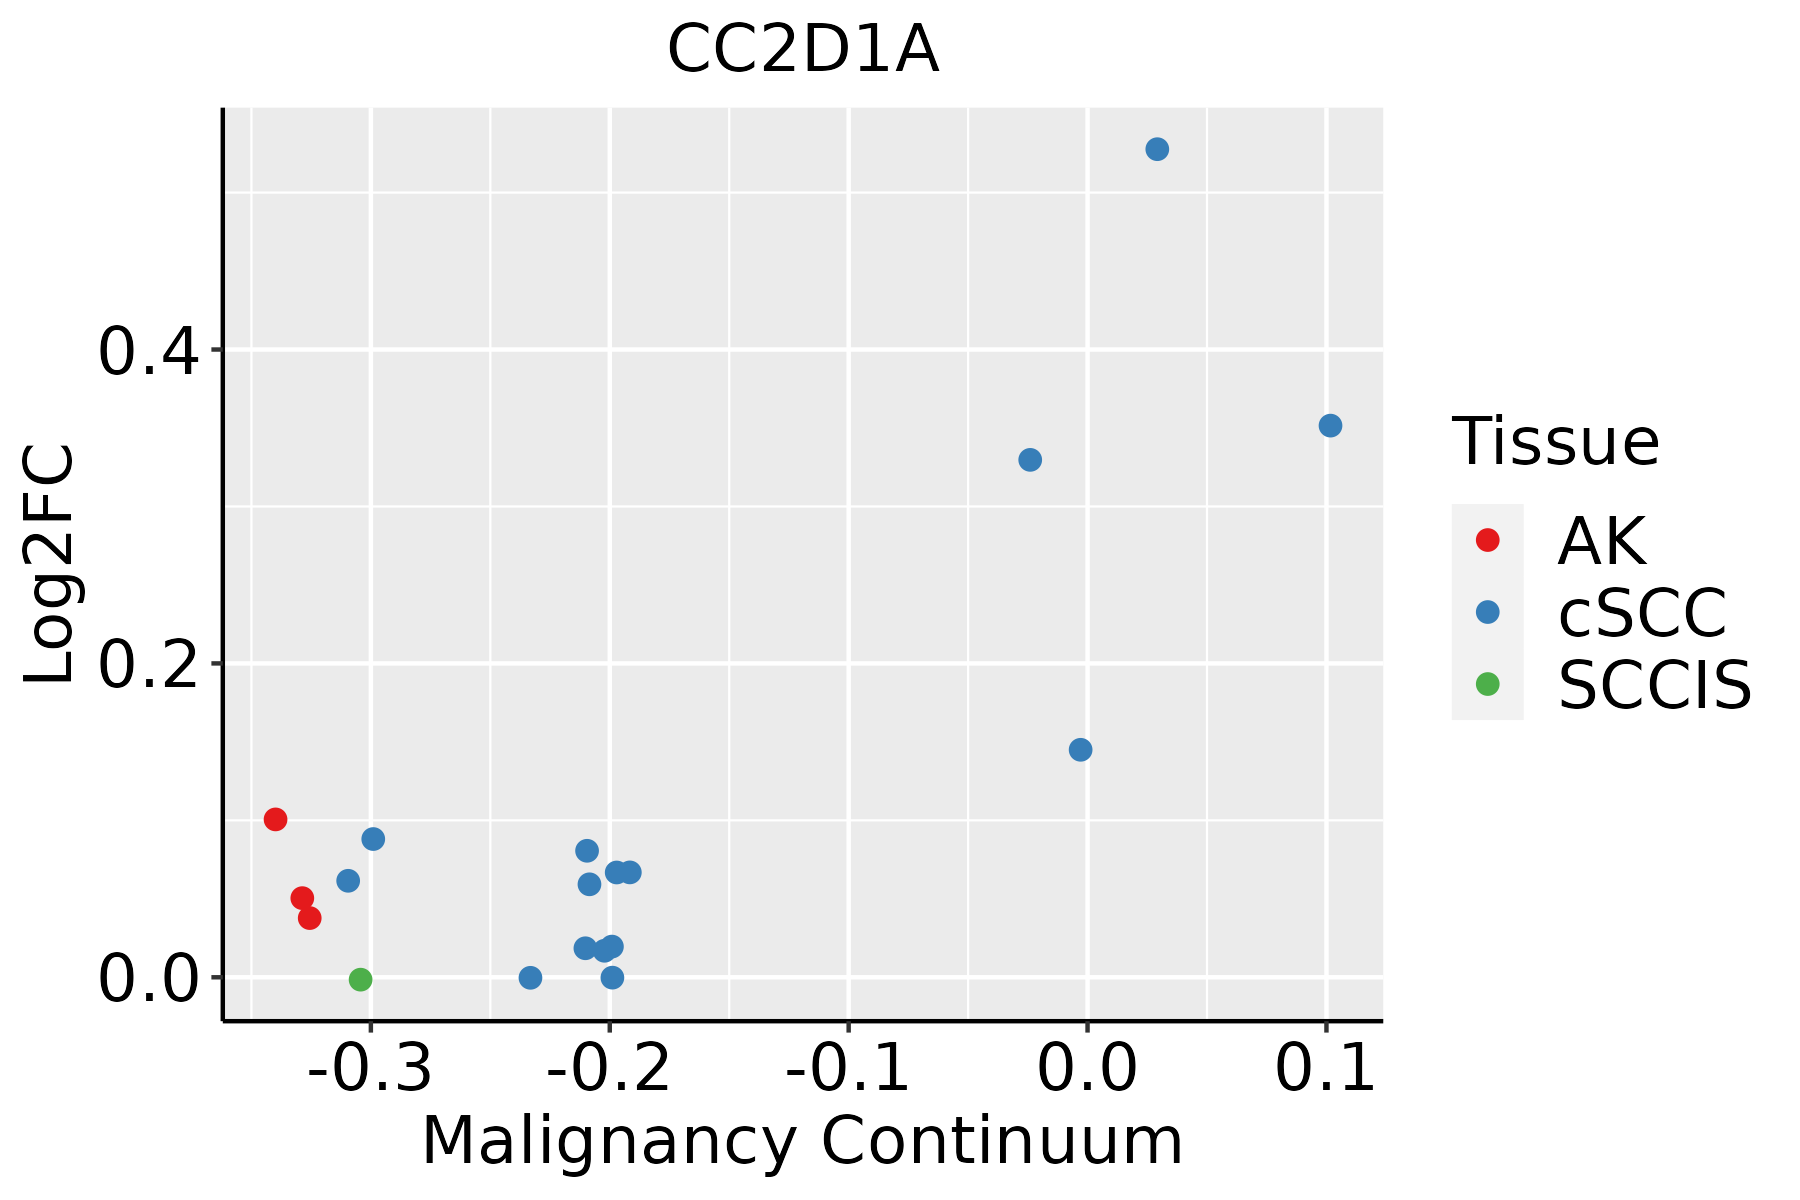
AK: Actinic keratosis
cSCC: Cutaneous squamous cell carcinoma
SCCIS:squamous cell carcinoma in situ
ThyroidThe image shows the transcriptomic changes along malignancy continuum.log2FC in expression of this searched gene in stem-like cells from each diseased tissue sample relative to stem-like cells in normal samples in each tissue plotted against the malignancy continuum. Samples are colored based on if they are from different disease stage.
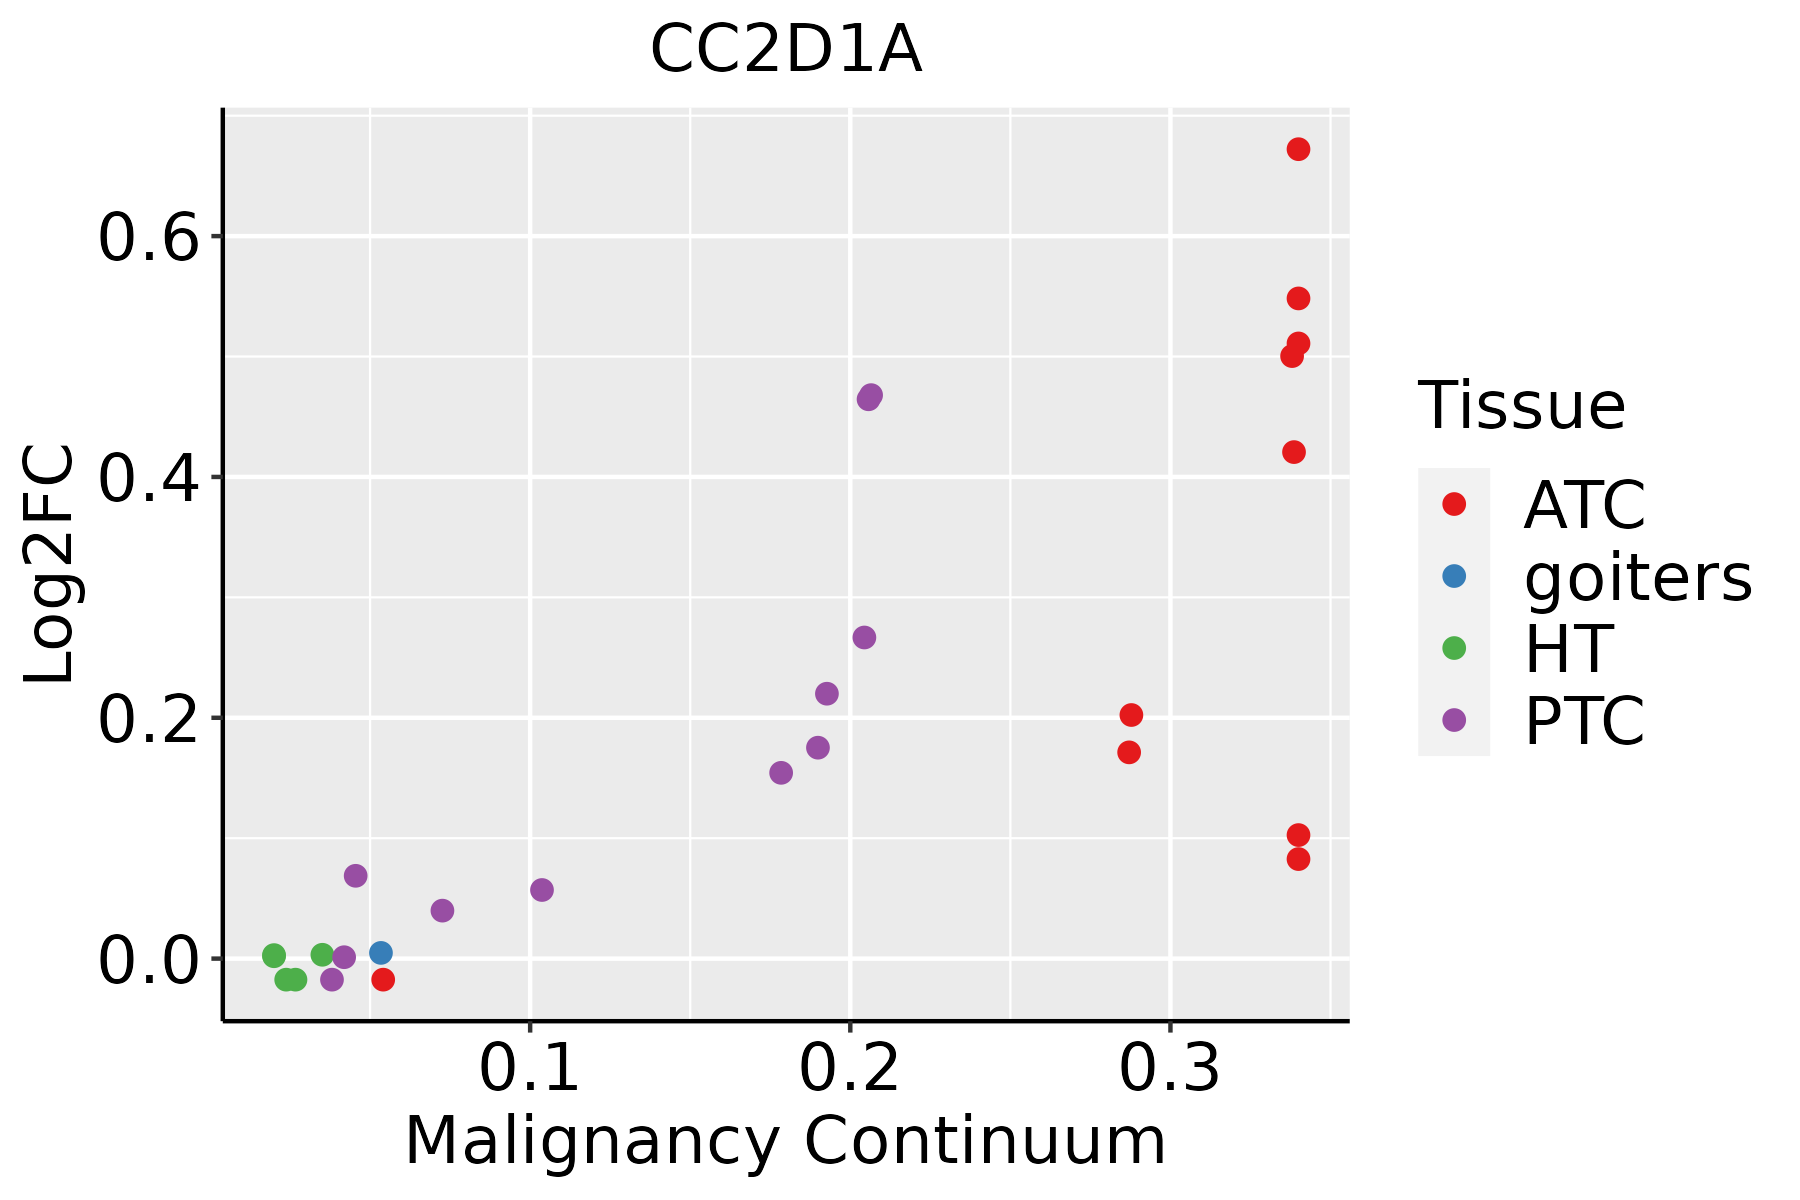
ATC: Anaplastic thyroid cancer
HT: Hashimoto's thyroiditis
PTC: Papillary thyroid cancer
∗log2FC in expression of this searched gene in stem-like cells from each diseased tissue sample relative to stem-like cells in normal samples in each tissue plotted against the malignancy continuum. Samples are colored based on if they are from different disease stage.

Top

Malignant transformation related pathway analysis

check buttonFind out the enriched GO biological processes and KEGG pathways involved in transition from healthy to precancer to cancer
check button Figure of enriched GO biological processes.
TissueDisease StageEnriched GO biological Processes
ColorectumADGO analysis - Figure of enriched GO biological processes: Top 15 enriched GO BP terms are showed in the bar plot of each disease state in each tissue. Each row represents a significant GO biological process which is colored according to the -log10(p.adjust).
ColorectumSERGO analysis - Figure of enriched GO biological processes: Top 15 enriched GO BP terms are showed in the bar plot of each disease state in each tissue. Each row represents a significant GO biological process which is colored according to the -log10(p.adjust).
ColorectumMSSGO analysis - Figure of enriched GO biological processes: Top 15 enriched GO BP terms are showed in the bar plot of each disease state in each tissue. Each row represents a significant GO biological process which is colored according to the -log10(p.adjust).
ColorectumMSI-HGO analysis - Figure of enriched GO biological processes: Top 15 enriched GO BP terms are showed in the bar plot of each disease state in each tissue. Each row represents a significant GO biological process which is colored according to the -log10(p.adjust).
ColorectumFAPGO analysis - Figure of enriched GO biological processes: Top 15 enriched GO BP terms are showed in the bar plot of each disease state in each tissue. Each row represents a significant GO biological process which is colored according to the -log10(p.adjust).
∗Top 15 enriched GO BP terms are showed in the bar plot of each disease state in each tissue. Each row represents a significant GO biological process which is colored according to the -log10(p.adjust).
Page: 1 2 3 4 5 6 7 8 9 

check button Enriched GO biological processes.
GO IDTissueDisease StageDescriptionGene RatioBg Ratiopvaluep.adjustCount
GO:0043123ColorectumADpositive regulation of I-kappaB kinase/NF-kappaB signaling60/3918186/187231.91e-042.56e-0360
GO:0043122ColorectumADregulation of I-kappaB kinase/NF-kappaB signaling76/3918249/187232.17e-042.85e-0376
GO:0007249ColorectumADI-kappaB kinase/NF-kappaB signaling82/3918281/187236.09e-046.40e-0382
GO:00431222ColorectumFAPregulation of I-kappaB kinase/NF-kappaB signaling56/2622249/187231.82e-042.69e-0356
GO:00431232ColorectumFAPpositive regulation of I-kappaB kinase/NF-kappaB signaling42/2622186/187231.01e-039.89e-0342
GO:00072492ColorectumFAPI-kappaB kinase/NF-kappaB signaling58/2622281/187231.37e-031.24e-0258
GO:00431223ColorectumCRCregulation of I-kappaB kinase/NF-kappaB signaling41/2078249/187236.39e-034.64e-0241
GO:004312220EsophagusHGINregulation of I-kappaB kinase/NF-kappaB signaling63/2587249/187238.91e-073.61e-0563
GO:000724918EsophagusHGINI-kappaB kinase/NF-kappaB signaling67/2587281/187233.84e-061.29e-0467
GO:004312317EsophagusHGINpositive regulation of I-kappaB kinase/NF-kappaB signaling49/2587186/187234.22e-061.40e-0449
GO:004312318EsophagusESCCpositive regulation of I-kappaB kinase/NF-kappaB signaling132/8552186/187232.07e-128.58e-11132
GO:0043122110EsophagusESCCregulation of I-kappaB kinase/NF-kappaB signaling167/8552249/187236.11e-122.32e-10167
GO:000724919EsophagusESCCI-kappaB kinase/NF-kappaB signaling183/8552281/187233.02e-111.01e-09183
GO:00987812EsophagusESCCncRNA transcription45/855256/187231.05e-071.72e-0645
GO:00093011EsophagusESCCsnRNA transcription16/855219/187236.45e-043.43e-0316
GO:00427951EsophagusESCCsnRNA transcription by RNA polymerase II13/855216/187234.05e-031.62e-0213
GO:004312218Oral cavityOSCCregulation of I-kappaB kinase/NF-kappaB signaling155/7305249/187237.79e-144.14e-12155
GO:004312310Oral cavityOSCCpositive regulation of I-kappaB kinase/NF-kappaB signaling122/7305186/187231.68e-138.52e-12122
GO:000724910Oral cavityOSCCI-kappaB kinase/NF-kappaB signaling169/7305281/187234.69e-132.25e-11169
GO:00987811Oral cavityOSCCncRNA transcription38/730556/187231.15e-051.18e-0438
Page: 1 2 

check button Enriched KEGG pathways.
Pathway IDTissueDisease StageDescriptionGene RatioBg Ratiopvaluep.adjustqvalueCount
Page: 1 

Top

Cell-cell communication analysis

check buttonIdentification of potential cell-cell interactions between two cell types and their ligand-receptor pairs for different disease states
LigandReceptorLRpairPathwayTissueDisease Stage
Page: 1 

Top

Single-cell gene regulatory network inference analysis

check buttonFind out the significant the regulons (TFs) and the target genes of each regulon across cell types for different disease states
TFCell TypeTissueDisease StageTarget GeneRSSRegulon Activity
∗The dot plots of a searched regulon are shown for all cell subpopulations in each disease state of each tissue based on the regulon specific score inferred using pySCENIC and by calculating the average expression.
Page: 1 

Top

Somatic mutation of malignant transformation related genes

check buttonAnnotation of somatic variants for genes involved in malignant transformation
Hugo SymbolVariant ClassVariant ClassificationdbSNP RSHGVScHGVSpHGVSp ShortSWISSPROTBIOTYPESIFTPolyPhenTumor Sample BarcodeTissueHistologySexAgeStageTherapy TypesDrugsOutcome
CC2D1ASNVMissense_Mutationc.593N>Ap.Gly198Glup.G198EQ6P1N0protein_codingdeleterious(0)probably_damaging(1)TCGA-A2-A0YK-01Breastbreast invasive carcinomaFemale<65I/IIChemotherapycytoxanSD
CC2D1ASNVMissense_Mutationrs747172992c.1762G>Ap.Glu588Lysp.E588KQ6P1N0protein_codingdeleterious(0.04)possibly_damaging(0.711)TCGA-B6-A0IK-01Breastbreast invasive carcinomaFemale<65III/IVUnknownUnknownPD
CC2D1ASNVMissense_Mutationrs750684031c.1081N>Cp.Val361Leup.V361LQ6P1N0protein_codingtolerated(0.29)benign(0.007)TCGA-BH-A0DZ-01Breastbreast invasive carcinomaFemale<65I/IIChemotherapydocetaxelSD
CC2D1ASNVMissense_Mutationc.1630N>Cp.Asp544Hisp.D544HQ6P1N0protein_codingdeleterious(0)probably_damaging(1)TCGA-D8-A1XZ-01Breastbreast invasive carcinomaFemale>=65III/IVHormone Therapytamoxiphen+anastrozolumSD
CC2D1ASNVMissense_Mutationnovelc.1064G>Ap.Arg355Glnp.R355QQ6P1N0protein_codingdeleterious(0.01)probably_damaging(0.996)TCGA-E2-A574-01Breastbreast invasive carcinomaFemale<65I/IIChemotherapyadriamycinSD
CC2D1ASNVMissense_Mutationnovelc.1342G>Ap.Glu448Lysp.E448KQ6P1N0protein_codingtolerated(0.13)possibly_damaging(0.815)TCGA-E2-A574-01Breastbreast invasive carcinomaFemale<65I/IIChemotherapyadriamycinSD
CC2D1ASNVMissense_Mutationc.2752N>Ap.Glu918Lysp.E918KQ6P1N0protein_codingdeleterious(0)possibly_damaging(0.777)TCGA-EW-A1J5-01Breastbreast invasive carcinomaFemale<65I/IIChemotherapyadriamycinSD
CC2D1AinsertionNonsense_Mutationnovelc.2557_2558insAGGCTTCTCTCTCCCTACTCCCTCCTGTGGTTCATGTCCATGAAp.Phe853Terp.F853*Q6P1N0protein_codingTCGA-A2-A0CU-01Breastbreast invasive carcinomaFemale>=65I/IIHormone TherapytamoxiphenSD
CC2D1ASNVMissense_Mutationc.2788N>Ap.Asp930Asnp.D930NQ6P1N0protein_codingdeleterious(0)benign(0.147)TCGA-C5-A1BM-01Cervixcervical & endocervical cancerFemale>=65I/IIUnknownUnknownSD
CC2D1ASNVMissense_Mutationnovelc.464G>Tp.Arg155Ilep.R155IQ6P1N0protein_codingdeleterious(0)benign(0.259)TCGA-EA-A3HU-01Cervixcervical & endocervical cancerFemale<65I/IIUnknownUnknownSD
Page: 1 2 3 4 5 6 7 8 9 10 

Top

Related drugs of malignant transformation related genes

check buttonIdentification of chemicals and drugs interact with genes involved in malignant transfromation
(DGIdb 4.0)
Entrez IDSymbolCategoryInteraction TypesDrug Claim NameDrug NamePMIDs
Page: 1