
|
|||||
|
 | |
| |
| |
| |
| |
| |
|
Gene: CBX8 |
Gene summary for CBX8 |
| Gene information | Species | Human | Gene symbol | CBX8 | Gene ID | 57332 |
| Gene name | chromobox 8 | |
| Gene Alias | PC3 | |
| Cytomap | 17q25.3 | |
| Gene Type | protein-coding | GO ID | GO:0000122 | UniProtAcc | Q9HC52 |
Top |
Malignant transformation analysis |
| Identification of the aberrant gene expression in precancerous and cancerous lesions by comparing the gene expression of stem-like cells in diseased tissues with normal stem cells |
| Entrez ID | Symbol | Replicates | Species | Organ | Tissue | Adj P-value | Log2FC | Malignancy |
| 57332 | CBX8 | LZE22T | Human | Esophagus | ESCC | 1.26e-02 | 2.69e-01 | 0.068 |
| 57332 | CBX8 | LZE24T | Human | Esophagus | ESCC | 6.80e-09 | 2.74e-01 | 0.0596 |
| 57332 | CBX8 | P2T-E | Human | Esophagus | ESCC | 6.43e-24 | 2.78e-01 | 0.1177 |
| 57332 | CBX8 | P4T-E | Human | Esophagus | ESCC | 2.45e-09 | 2.49e-01 | 0.1323 |
| 57332 | CBX8 | P5T-E | Human | Esophagus | ESCC | 1.50e-04 | 4.81e-02 | 0.1327 |
| 57332 | CBX8 | P8T-E | Human | Esophagus | ESCC | 2.65e-06 | 8.09e-02 | 0.0889 |
| 57332 | CBX8 | P9T-E | Human | Esophagus | ESCC | 1.67e-04 | 1.84e-01 | 0.1131 |
| 57332 | CBX8 | P10T-E | Human | Esophagus | ESCC | 9.47e-06 | 1.09e-01 | 0.116 |
| 57332 | CBX8 | P11T-E | Human | Esophagus | ESCC | 1.64e-04 | 2.54e-01 | 0.1426 |
| 57332 | CBX8 | P12T-E | Human | Esophagus | ESCC | 3.19e-11 | 1.55e-01 | 0.1122 |
| 57332 | CBX8 | P15T-E | Human | Esophagus | ESCC | 6.00e-04 | 1.46e-01 | 0.1149 |
| 57332 | CBX8 | P16T-E | Human | Esophagus | ESCC | 4.30e-10 | 2.14e-01 | 0.1153 |
| 57332 | CBX8 | P20T-E | Human | Esophagus | ESCC | 9.09e-22 | 4.57e-01 | 0.1124 |
| 57332 | CBX8 | P21T-E | Human | Esophagus | ESCC | 2.02e-06 | 1.22e-01 | 0.1617 |
| 57332 | CBX8 | P22T-E | Human | Esophagus | ESCC | 4.78e-13 | 2.42e-01 | 0.1236 |
| 57332 | CBX8 | P24T-E | Human | Esophagus | ESCC | 5.55e-11 | 7.04e-02 | 0.1287 |
| 57332 | CBX8 | P26T-E | Human | Esophagus | ESCC | 2.17e-22 | 4.24e-01 | 0.1276 |
| 57332 | CBX8 | P27T-E | Human | Esophagus | ESCC | 7.90e-03 | 7.40e-02 | 0.1055 |
| 57332 | CBX8 | P28T-E | Human | Esophagus | ESCC | 1.41e-10 | 2.34e-01 | 0.1149 |
| 57332 | CBX8 | P31T-E | Human | Esophagus | ESCC | 2.75e-12 | 2.34e-01 | 0.1251 |
| Page: 1 2 3 |
| Tissue | Expression Dynamics | Abbreviation |
| Esophagus | 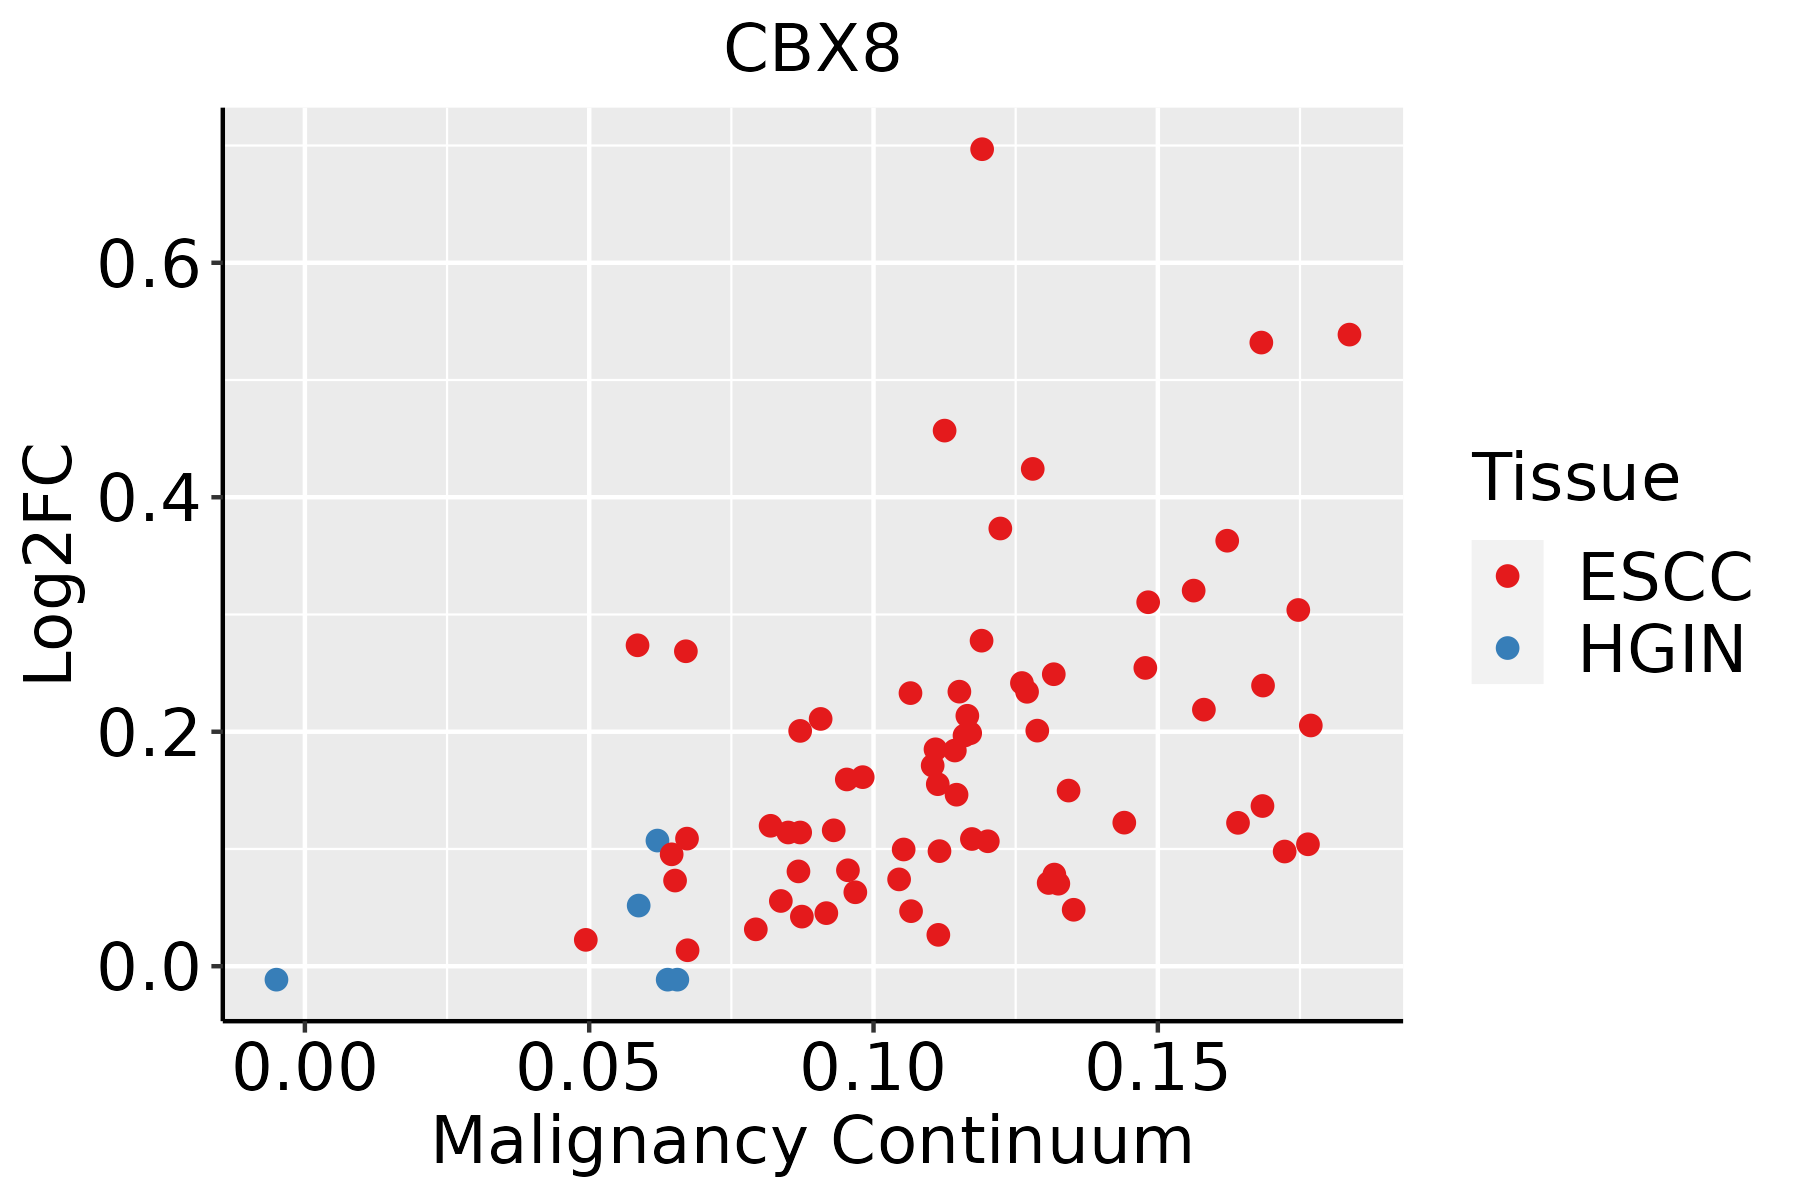 | ESCC: Esophageal squamous cell carcinoma |
| HGIN: High-grade intraepithelial neoplasias | ||
| LGIN: Low-grade intraepithelial neoplasias | ||
| Liver |  | HCC: Hepatocellular carcinoma |
| NAFLD: Non-alcoholic fatty liver disease |
| ∗log2FC in expression of this searched gene in stem-like cells from each diseased tissue sample relative to stem-like cells in normal samples in each tissue plotted against the malignancy continuum. Samples are colored based on if they are from different disease stage. |
Top |
Malignant transformation related pathway analysis |
| Find out the enriched GO biological processes and KEGG pathways involved in transition from healthy to precancer to cancer |
| Tissue | Disease Stage | Enriched GO biological Processes |
| Colorectum | AD |  |
| Colorectum | SER |  |
| Colorectum | MSS |  |
| Colorectum | MSI-H |  |
| Colorectum | FAP |  |
| ∗Top 15 enriched GO BP terms are showed in the bar plot of each disease state in each tissue. Each row represents a significant GO biological process which is colored according to the -log10(p.adjust). |
| Page: 1 2 3 4 5 6 7 8 9 |
| GO ID | Tissue | Disease Stage | Description | Gene Ratio | Bg Ratio | pvalue | p.adjust | Count |
| GO:001657015 | Esophagus | ESCC | histone modification | 323/8552 | 463/18723 | 2.61e-26 | 7.88e-24 | 323 |
| GO:0006979111 | Esophagus | ESCC | response to oxidative stress | 303/8552 | 446/18723 | 7.15e-22 | 1.30e-19 | 303 |
| GO:0062197111 | Esophagus | ESCC | cellular response to chemical stress | 234/8552 | 337/18723 | 5.37e-19 | 5.97e-17 | 234 |
| GO:0034599111 | Esophagus | ESCC | cellular response to oxidative stress | 197/8552 | 288/18723 | 3.76e-15 | 2.15e-13 | 197 |
| GO:005105215 | Esophagus | ESCC | regulation of DNA metabolic process | 232/8552 | 359/18723 | 2.40e-13 | 1.13e-11 | 232 |
| GO:005105417 | Esophagus | ESCC | positive regulation of DNA metabolic process | 139/8552 | 201/18723 | 1.20e-11 | 4.33e-10 | 139 |
| GO:0000302111 | Esophagus | ESCC | response to reactive oxygen species | 150/8552 | 222/18723 | 3.06e-11 | 1.02e-09 | 150 |
| GO:2001020110 | Esophagus | ESCC | regulation of response to DNA damage stimulus | 145/8552 | 219/18723 | 5.97e-10 | 1.50e-08 | 145 |
| GO:0042542111 | Esophagus | ESCC | response to hydrogen peroxide | 102/8552 | 146/18723 | 2.64e-09 | 5.81e-08 | 102 |
| GO:001657414 | Esophagus | ESCC | histone ubiquitination | 40/8552 | 47/18723 | 2.40e-08 | 4.55e-07 | 40 |
| GO:003461420 | Esophagus | ESCC | cellular response to reactive oxygen species | 103/8552 | 155/18723 | 1.34e-07 | 2.17e-06 | 103 |
| GO:00703018 | Esophagus | ESCC | cellular response to hydrogen peroxide | 68/8552 | 98/18723 | 1.70e-06 | 2.03e-05 | 68 |
| GO:20010228 | Esophagus | ESCC | positive regulation of response to DNA damage stimulus | 69/8552 | 105/18723 | 2.66e-05 | 2.22e-04 | 69 |
| GO:00062826 | Esophagus | ESCC | regulation of DNA repair | 82/8552 | 130/18723 | 4.65e-05 | 3.66e-04 | 82 |
| GO:00457395 | Esophagus | ESCC | positive regulation of DNA repair | 49/8552 | 73/18723 | 1.74e-04 | 1.14e-03 | 49 |
| GO:00329631 | Esophagus | ESCC | collagen metabolic process | 62/8552 | 104/18723 | 2.90e-03 | 1.22e-02 | 62 |
| GO:000697922 | Liver | HCC | response to oxidative stress | 281/7958 | 446/18723 | 9.75e-19 | 1.24e-16 | 281 |
| GO:001657021 | Liver | HCC | histone modification | 283/7958 | 463/18723 | 2.68e-16 | 2.33e-14 | 283 |
| GO:006219722 | Liver | HCC | cellular response to chemical stress | 216/7958 | 337/18723 | 6.86e-16 | 5.44e-14 | 216 |
| GO:003459922 | Liver | HCC | cellular response to oxidative stress | 183/7958 | 288/18723 | 3.65e-13 | 1.93e-11 | 183 |
| Page: 1 2 |
| Pathway ID | Tissue | Disease Stage | Description | Gene Ratio | Bg Ratio | pvalue | p.adjust | qvalue | Count |
| Page: 1 |
Top |
Cell-cell communication analysis |
| Identification of potential cell-cell interactions between two cell types and their ligand-receptor pairs for different disease states |
| Ligand | Receptor | LRpair | Pathway | Tissue | Disease Stage |
| Page: 1 |
Top |
Single-cell gene regulatory network inference analysis |
| Find out the significant the regulons (TFs) and the target genes of each regulon across cell types for different disease states |
| TF | Cell Type | Tissue | Disease Stage | Target Gene | RSS | Regulon Activity |
| ∗The dot plots of a searched regulon are shown for all cell subpopulations in each disease state of each tissue based on the regulon specific score inferred using pySCENIC and by calculating the average expression. |
| Page: 1 |
Top |
Somatic mutation of malignant transformation related genes |
| Annotation of somatic variants for genes involved in malignant transformation |
| Hugo Symbol | Variant Class | Variant Classification | dbSNP RS | HGVSc | HGVSp | HGVSp Short | SWISSPROT | BIOTYPE | SIFT | PolyPhen | Tumor Sample Barcode | Tissue | Histology | Sex | Age | Stage | Therapy Types | Drugs | Outcome |
| CBX8 | SNV | Missense_Mutation | novel | c.248C>T | p.Ala83Val | p.A83V | Q9HC52 | protein_coding | deleterious(0) | benign(0.228) | TCGA-A8-A07G-01 | Breast | breast invasive carcinoma | Female | >=65 | I/II | Chemotherapy | 5-fluorouracil | CR |
| CBX8 | SNV | Missense_Mutation | novel | c.1161N>T | p.Glu387Asp | p.E387D | Q9HC52 | protein_coding | tolerated(0.24) | possibly_damaging(0.675) | TCGA-AN-A046-01 | Breast | breast invasive carcinoma | Female | >=65 | I/II | Unknown | Unknown | SD |
| CBX8 | SNV | Missense_Mutation | novel | c.944N>A | p.Ser315Asn | p.S315N | Q9HC52 | protein_coding | tolerated(0.45) | benign(0.007) | TCGA-BH-A0DH-01 | Breast | breast invasive carcinoma | Female | <65 | I/II | Chemotherapy | cyclophosphamide | SD |
| CBX8 | SNV | Missense_Mutation | c.1155N>A | p.Phe385Leu | p.F385L | Q9HC52 | protein_coding | deleterious(0) | probably_damaging(0.985) | TCGA-C8-A12M-01 | Breast | breast invasive carcinoma | Female | >=65 | I/II | Unknown | Unknown | SD | |
| CBX8 | SNV | Missense_Mutation | c.146N>C | p.Leu49Pro | p.L49P | Q9HC52 | protein_coding | deleterious(0) | probably_damaging(1) | TCGA-D8-A1XQ-01 | Breast | breast invasive carcinoma | Female | >=65 | I/II | Unknown | Unknown | SD | |
| CBX8 | SNV | Missense_Mutation | c.986N>A | p.Gly329Glu | p.G329E | Q9HC52 | protein_coding | tolerated(0.18) | probably_damaging(0.998) | TCGA-E2-A15H-01 | Breast | breast invasive carcinoma | Female | <65 | I/II | Chemotherapy | herceptin | SD | |
| CBX8 | SNV | Missense_Mutation | c.647N>A | p.Gly216Asp | p.G216D | Q9HC52 | protein_coding | tolerated(0.42) | possibly_damaging(0.69) | TCGA-E2-A15H-01 | Breast | breast invasive carcinoma | Female | <65 | I/II | Chemotherapy | herceptin | SD | |
| CBX8 | SNV | Missense_Mutation | novel | c.802T>C | p.Ser268Pro | p.S268P | Q9HC52 | protein_coding | tolerated(0.38) | benign(0) | TCGA-A6-2678-01 | Colorectum | colon adenocarcinoma | Female | <65 | III/IV | Chemotherapy | 5-fluorouracil | SD |
| CBX8 | SNV | Missense_Mutation | c.214N>T | p.Arg72Cys | p.R72C | Q9HC52 | protein_coding | deleterious(0) | probably_damaging(0.994) | TCGA-A6-5665-01 | Colorectum | colon adenocarcinoma | Female | >=65 | I/II | Unknown | Unknown | PD | |
| CBX8 | SNV | Missense_Mutation | c.215N>A | p.Arg72His | p.R72H | Q9HC52 | protein_coding | deleterious(0) | probably_damaging(0.994) | TCGA-AA-3713-01 | Colorectum | colon adenocarcinoma | Male | >=65 | III/IV | Chemotherapy | 5-fluorouracil | PR |
| Page: 1 2 3 4 |
Top |
Related drugs of malignant transformation related genes |
| Identification of chemicals and drugs interact with genes involved in malignant transfromation |
| (DGIdb 4.0) |
| Entrez ID | Symbol | Category | Interaction Types | Drug Claim Name | Drug Name | PMIDs |
| Page: 1 |

Copyright 2023-Present -The University of Texas Health Science Center at Houston |