
|
|||||
|
 | |
| |
| |
| |
| |
| |
|
Gene: CBX3 |
Gene summary for CBX3 |
| Gene information | Species | Human | Gene symbol | CBX3 | Gene ID | 11335 |
| Gene name | chromobox 3 | |
| Gene Alias | HECH | |
| Cytomap | 7p15.2 | |
| Gene Type | protein-coding | GO ID | GO:0006139 | UniProtAcc | A4D177 |
Top |
Malignant transformation analysis |
| Identification of the aberrant gene expression in precancerous and cancerous lesions by comparing the gene expression of stem-like cells in diseased tissues with normal stem cells |
| Entrez ID | Symbol | Replicates | Species | Organ | Tissue | Adj P-value | Log2FC | Malignancy |
| 11335 | CBX3 | GSM4909282 | Human | Breast | IDC | 8.84e-14 | 4.14e-01 | -0.0288 |
| 11335 | CBX3 | GSM4909286 | Human | Breast | IDC | 9.60e-16 | -3.85e-01 | 0.1081 |
| 11335 | CBX3 | GSM4909287 | Human | Breast | IDC | 1.91e-02 | 1.00e-01 | 0.2057 |
| 11335 | CBX3 | GSM4909293 | Human | Breast | IDC | 8.91e-09 | 4.02e-01 | 0.1581 |
| 11335 | CBX3 | GSM4909294 | Human | Breast | IDC | 3.07e-04 | -2.29e-01 | 0.2022 |
| 11335 | CBX3 | GSM4909296 | Human | Breast | IDC | 4.63e-13 | -2.86e-03 | 0.1524 |
| 11335 | CBX3 | GSM4909297 | Human | Breast | IDC | 8.29e-18 | -1.56e-01 | 0.1517 |
| 11335 | CBX3 | GSM4909298 | Human | Breast | IDC | 1.59e-04 | 3.15e-01 | 0.1551 |
| 11335 | CBX3 | GSM4909304 | Human | Breast | IDC | 1.39e-16 | 5.38e-01 | 0.1636 |
| 11335 | CBX3 | GSM4909308 | Human | Breast | IDC | 5.53e-03 | 2.84e-01 | 0.158 |
| 11335 | CBX3 | GSM4909311 | Human | Breast | IDC | 2.09e-47 | 4.04e-02 | 0.1534 |
| 11335 | CBX3 | GSM4909312 | Human | Breast | IDC | 1.22e-13 | -2.80e-02 | 0.1552 |
| 11335 | CBX3 | GSM4909313 | Human | Breast | IDC | 1.18e-06 | -1.21e-01 | 0.0391 |
| 11335 | CBX3 | GSM4909315 | Human | Breast | IDC | 1.40e-07 | 3.08e-01 | 0.21 |
| 11335 | CBX3 | GSM4909316 | Human | Breast | IDC | 2.48e-13 | 2.91e-01 | 0.21 |
| 11335 | CBX3 | GSM4909319 | Human | Breast | IDC | 4.54e-49 | -2.30e-01 | 0.1563 |
| 11335 | CBX3 | GSM4909320 | Human | Breast | IDC | 7.42e-12 | 9.30e-02 | 0.1575 |
| 11335 | CBX3 | GSM4909321 | Human | Breast | IDC | 7.05e-18 | -3.21e-01 | 0.1559 |
| 11335 | CBX3 | brca3 | Human | Breast | Precancer | 7.28e-04 | 6.87e-02 | -0.0263 |
| 11335 | CBX3 | brca10 | Human | Breast | Precancer | 9.93e-03 | -3.25e-01 | -0.0029 |
| Page: 1 2 3 4 5 6 7 8 9 10 11 12 |
| Tissue | Expression Dynamics | Abbreviation |
| Breast | 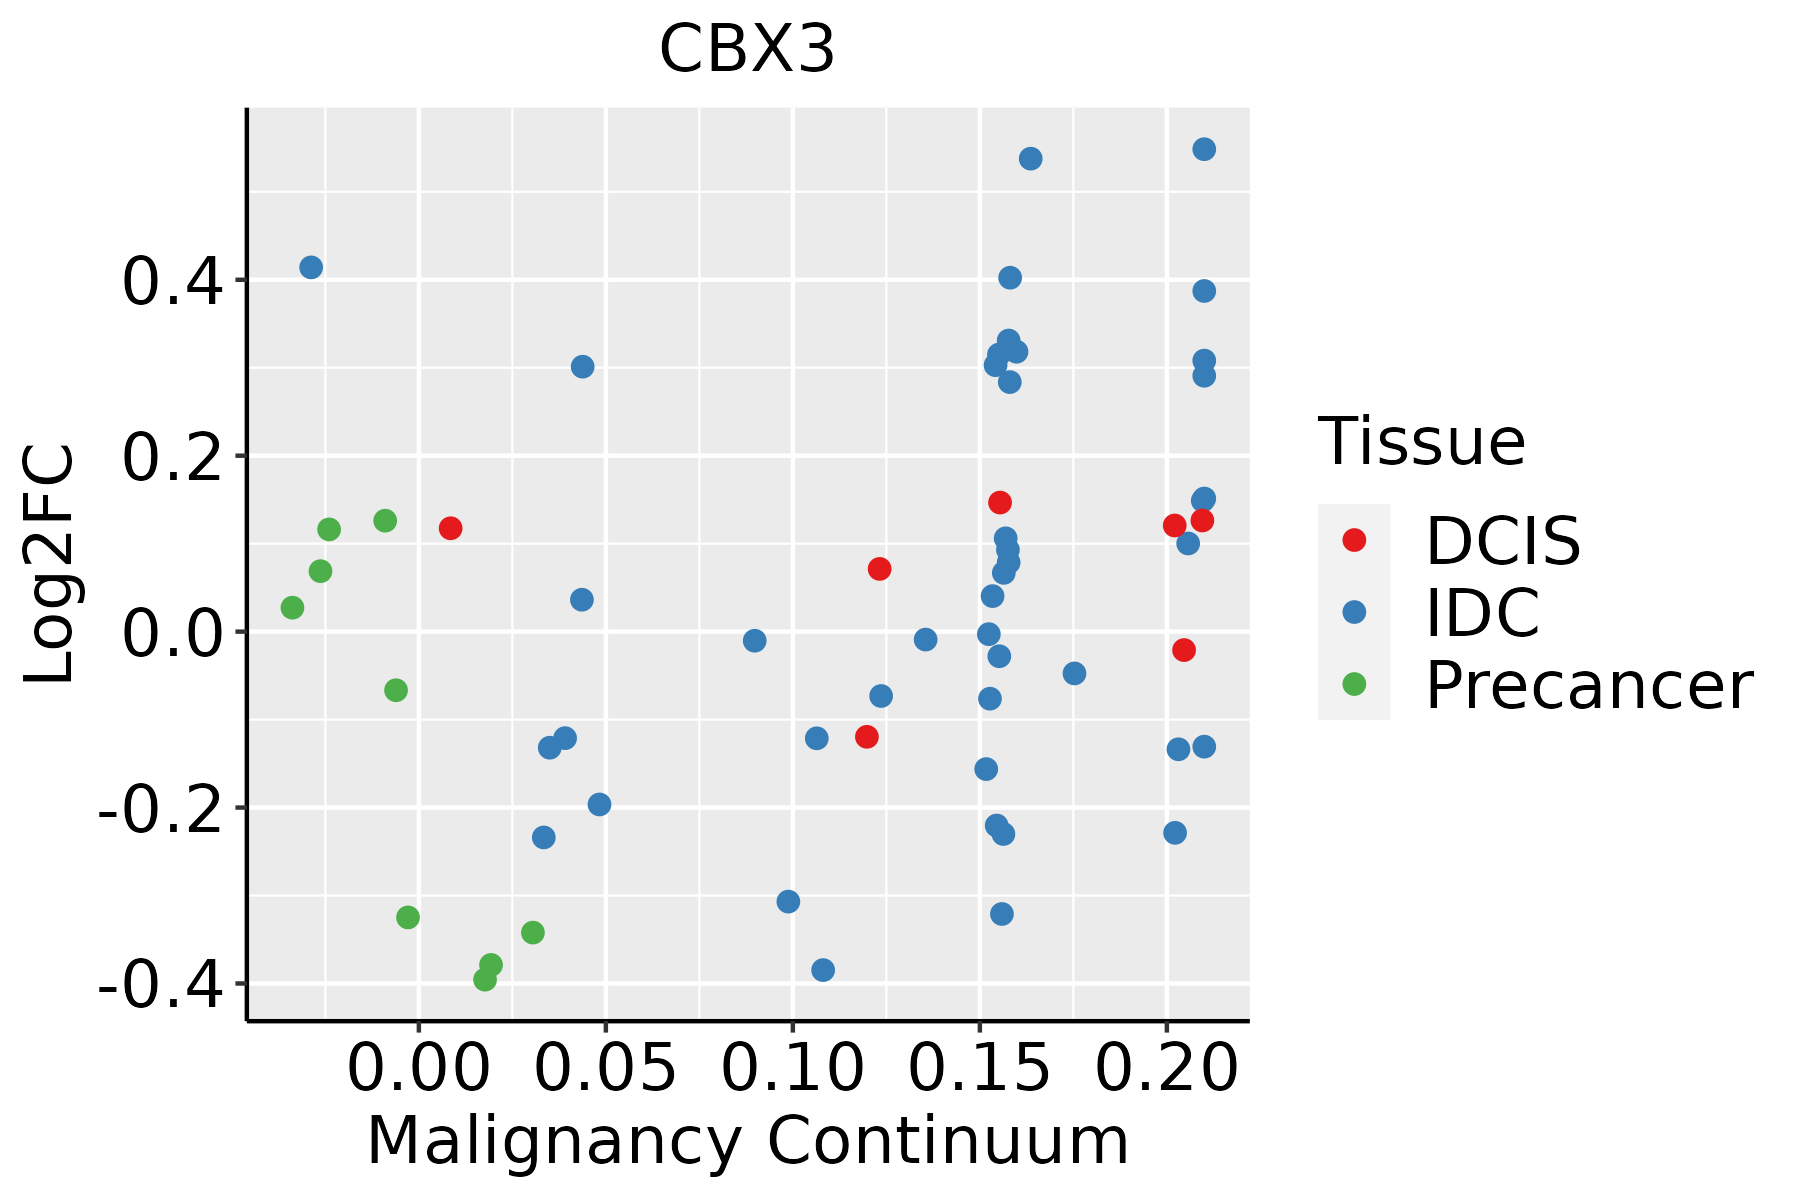 | IDC: Invasive ductal carcinoma |
| DCIS: Ductal carcinoma in situ | ||
| Precancer(BRCA1-mut): Precancerous lesion from BRCA1 mutation carriers | ||
| Colorectum (GSE201348) | 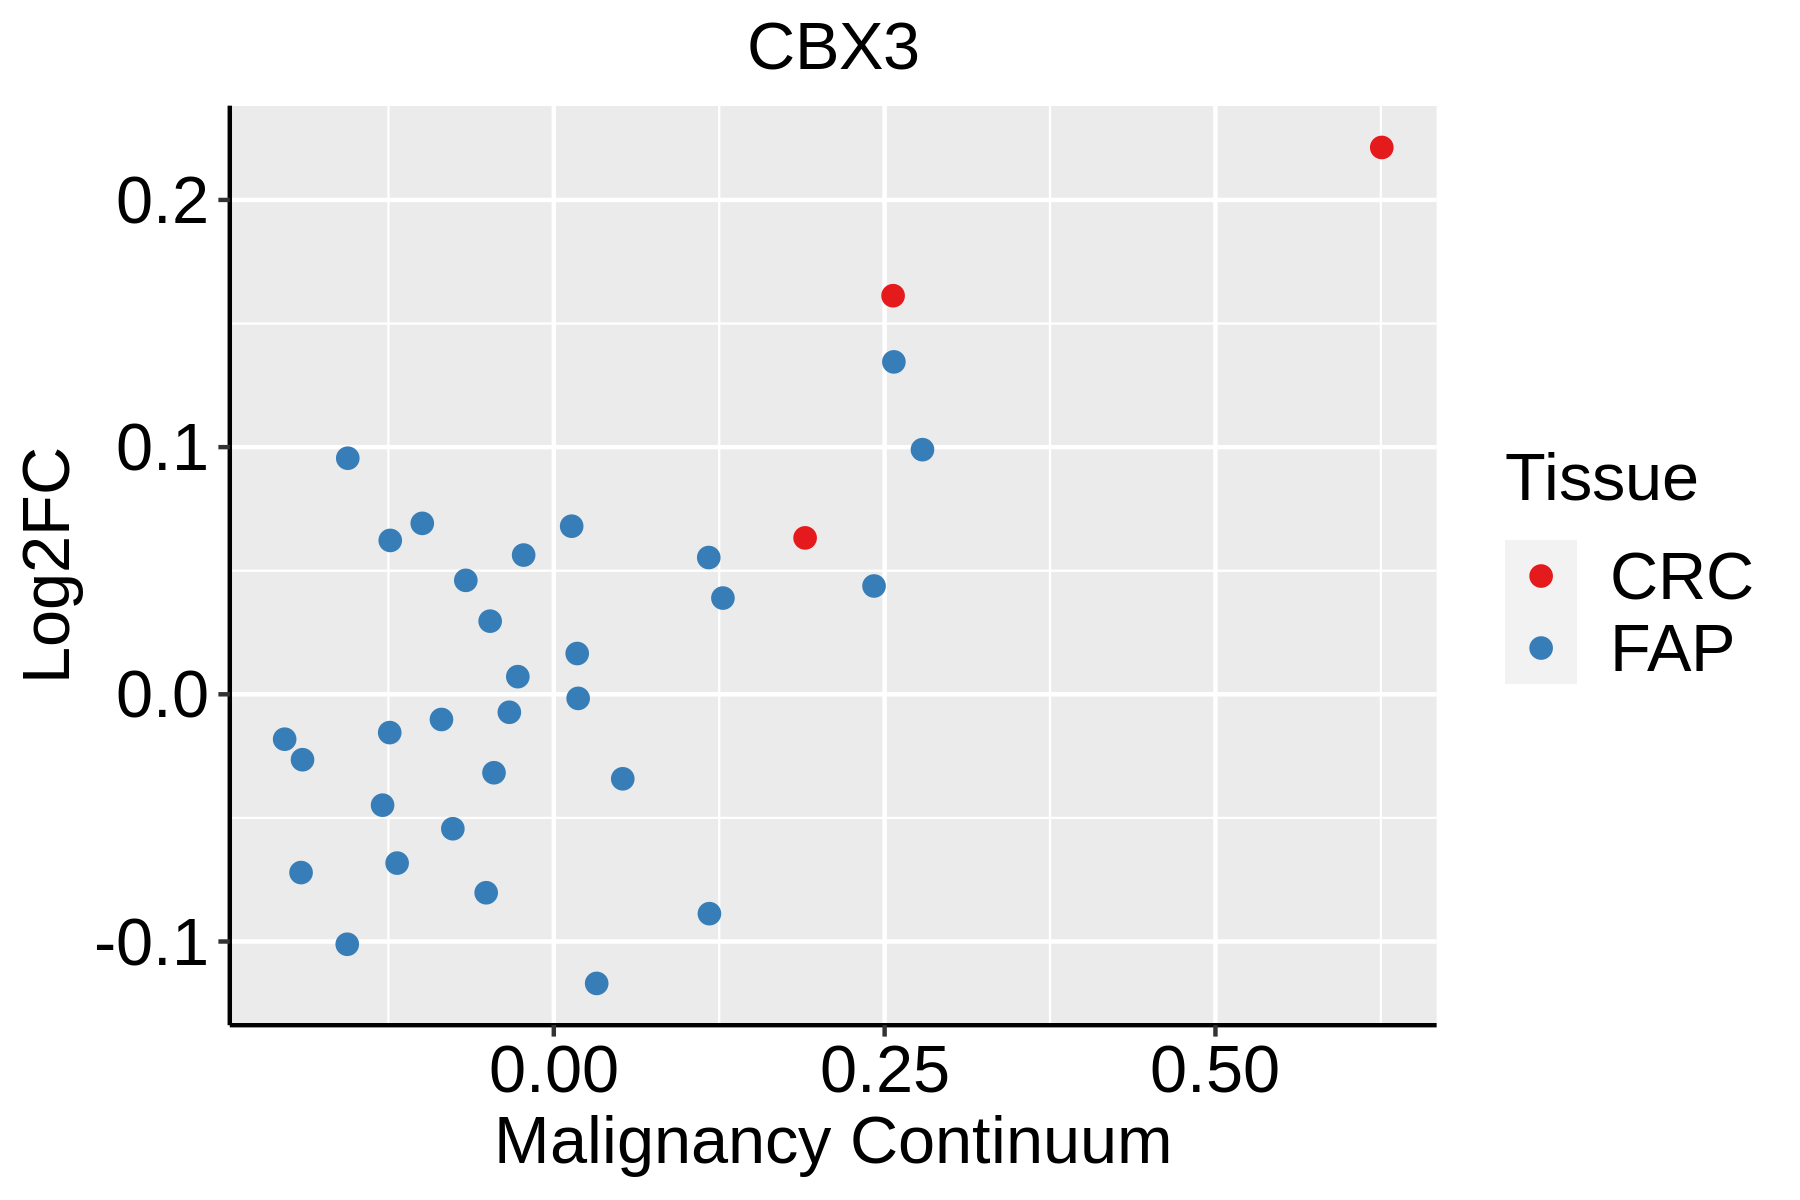 | FAP: Familial adenomatous polyposis |
| CRC: Colorectal cancer | ||
| Colorectum (HTA11) |  | AD: Adenomas |
| SER: Sessile serrated lesions | ||
| MSI-H: Microsatellite-high colorectal cancer | ||
| MSS: Microsatellite stable colorectal cancer | ||
| Endometrium | 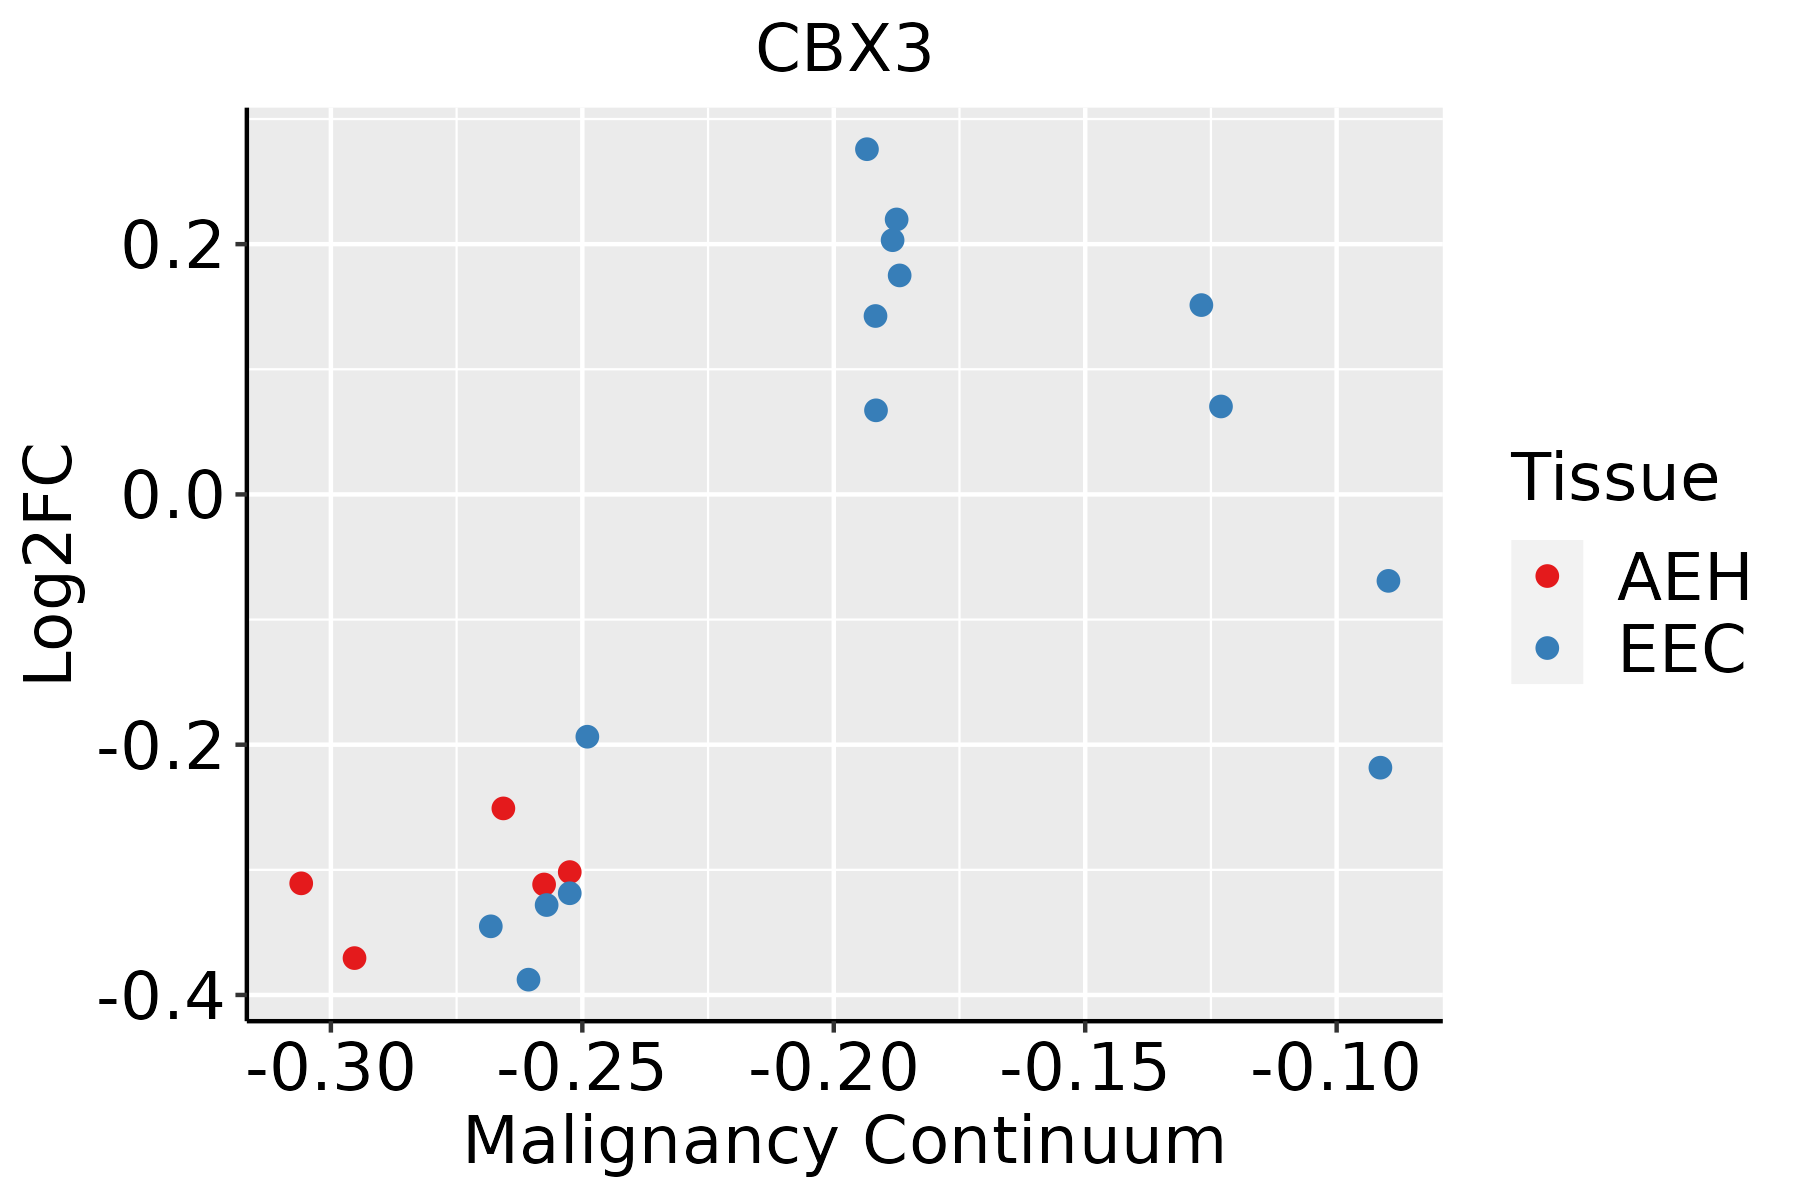 | AEH: Atypical endometrial hyperplasia |
| EEC: Endometrioid Cancer | ||
| Esophagus |  | ESCC: Esophageal squamous cell carcinoma |
| HGIN: High-grade intraepithelial neoplasias | ||
| LGIN: Low-grade intraepithelial neoplasias | ||
| GC | 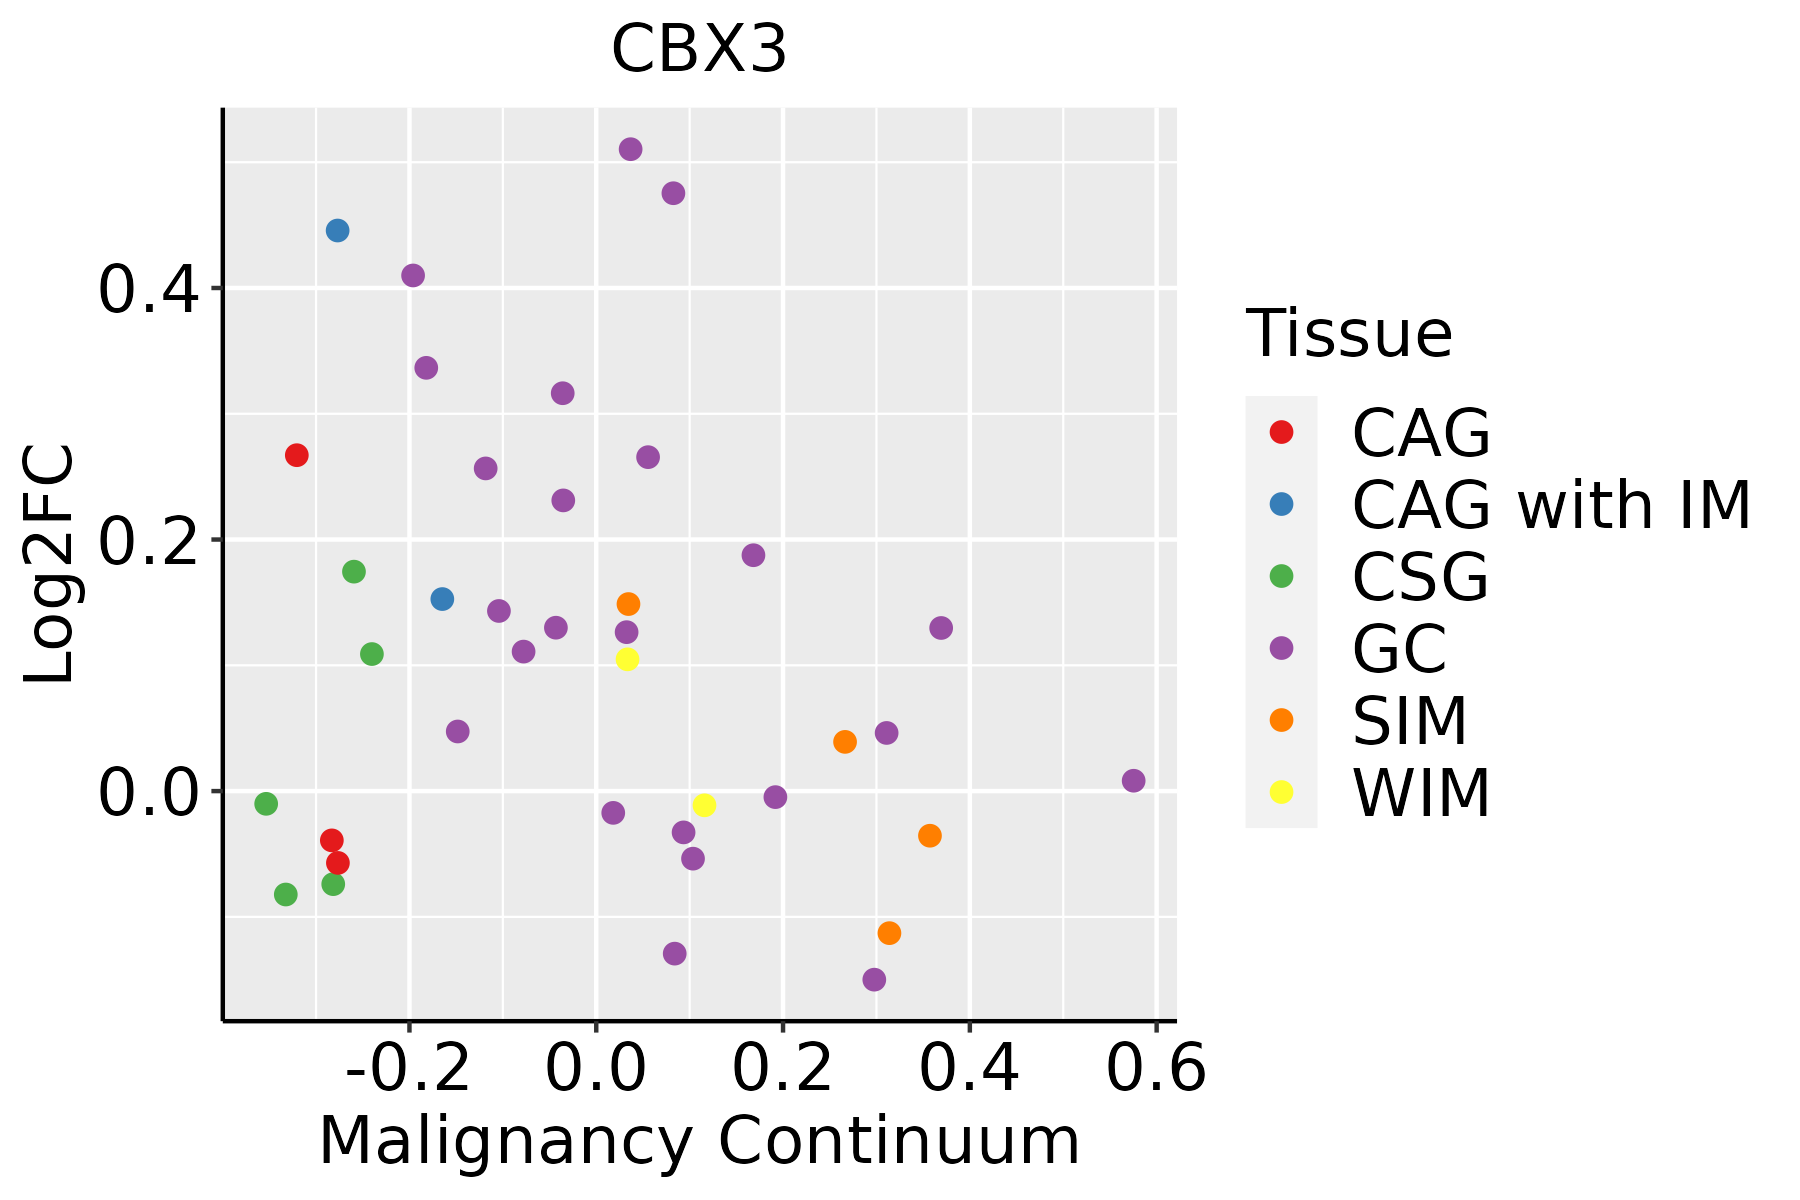 | CAG: Chronic atrophic gastritis |
| CAG with IM: Chronic atrophic gastritis with intestinal metaplasia | ||
| CSG: Chronic superficial gastritis | ||
| GC: Gastric cancer | ||
| SIM: Severe intestinal metaplasia | ||
| WIM: Wild intestinal metaplasia | ||
| Liver | 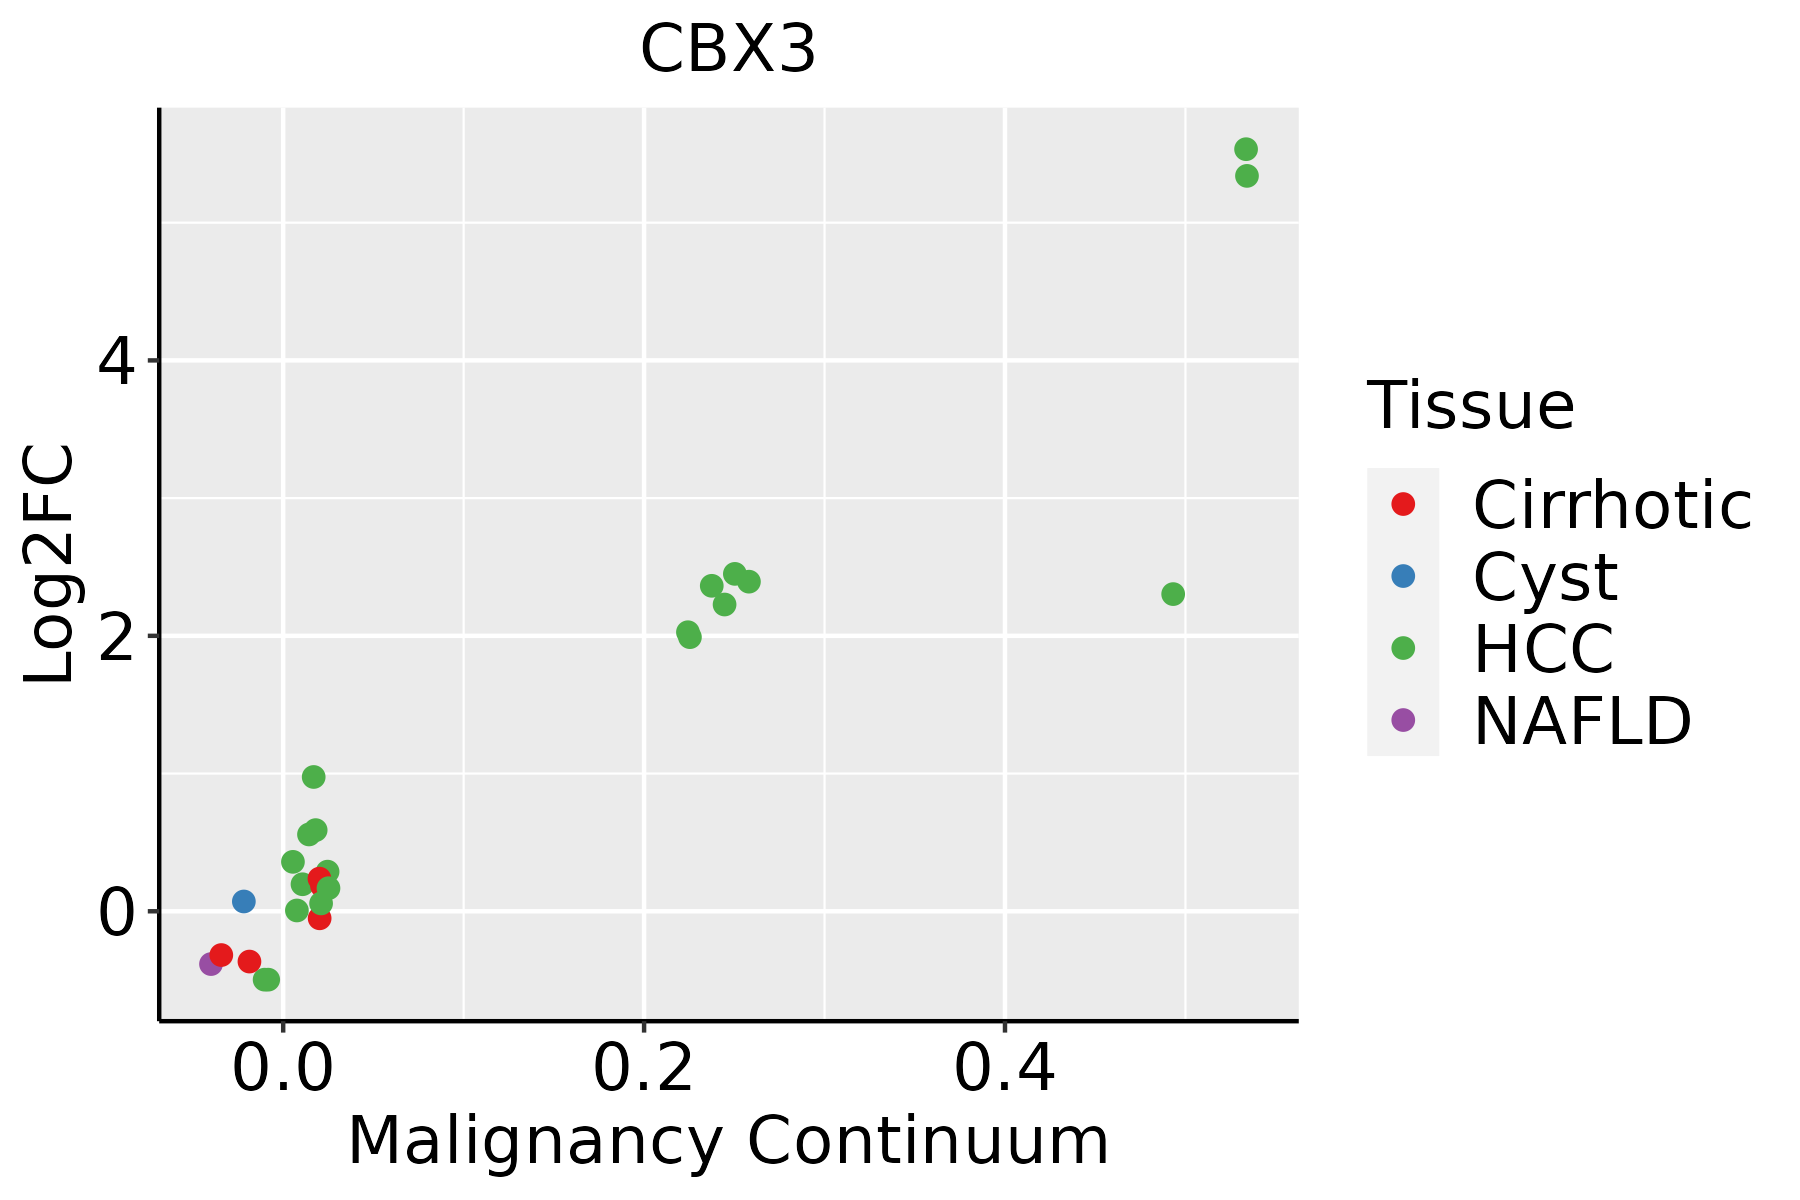 | HCC: Hepatocellular carcinoma |
| NAFLD: Non-alcoholic fatty liver disease | ||
| Oral Cavity | 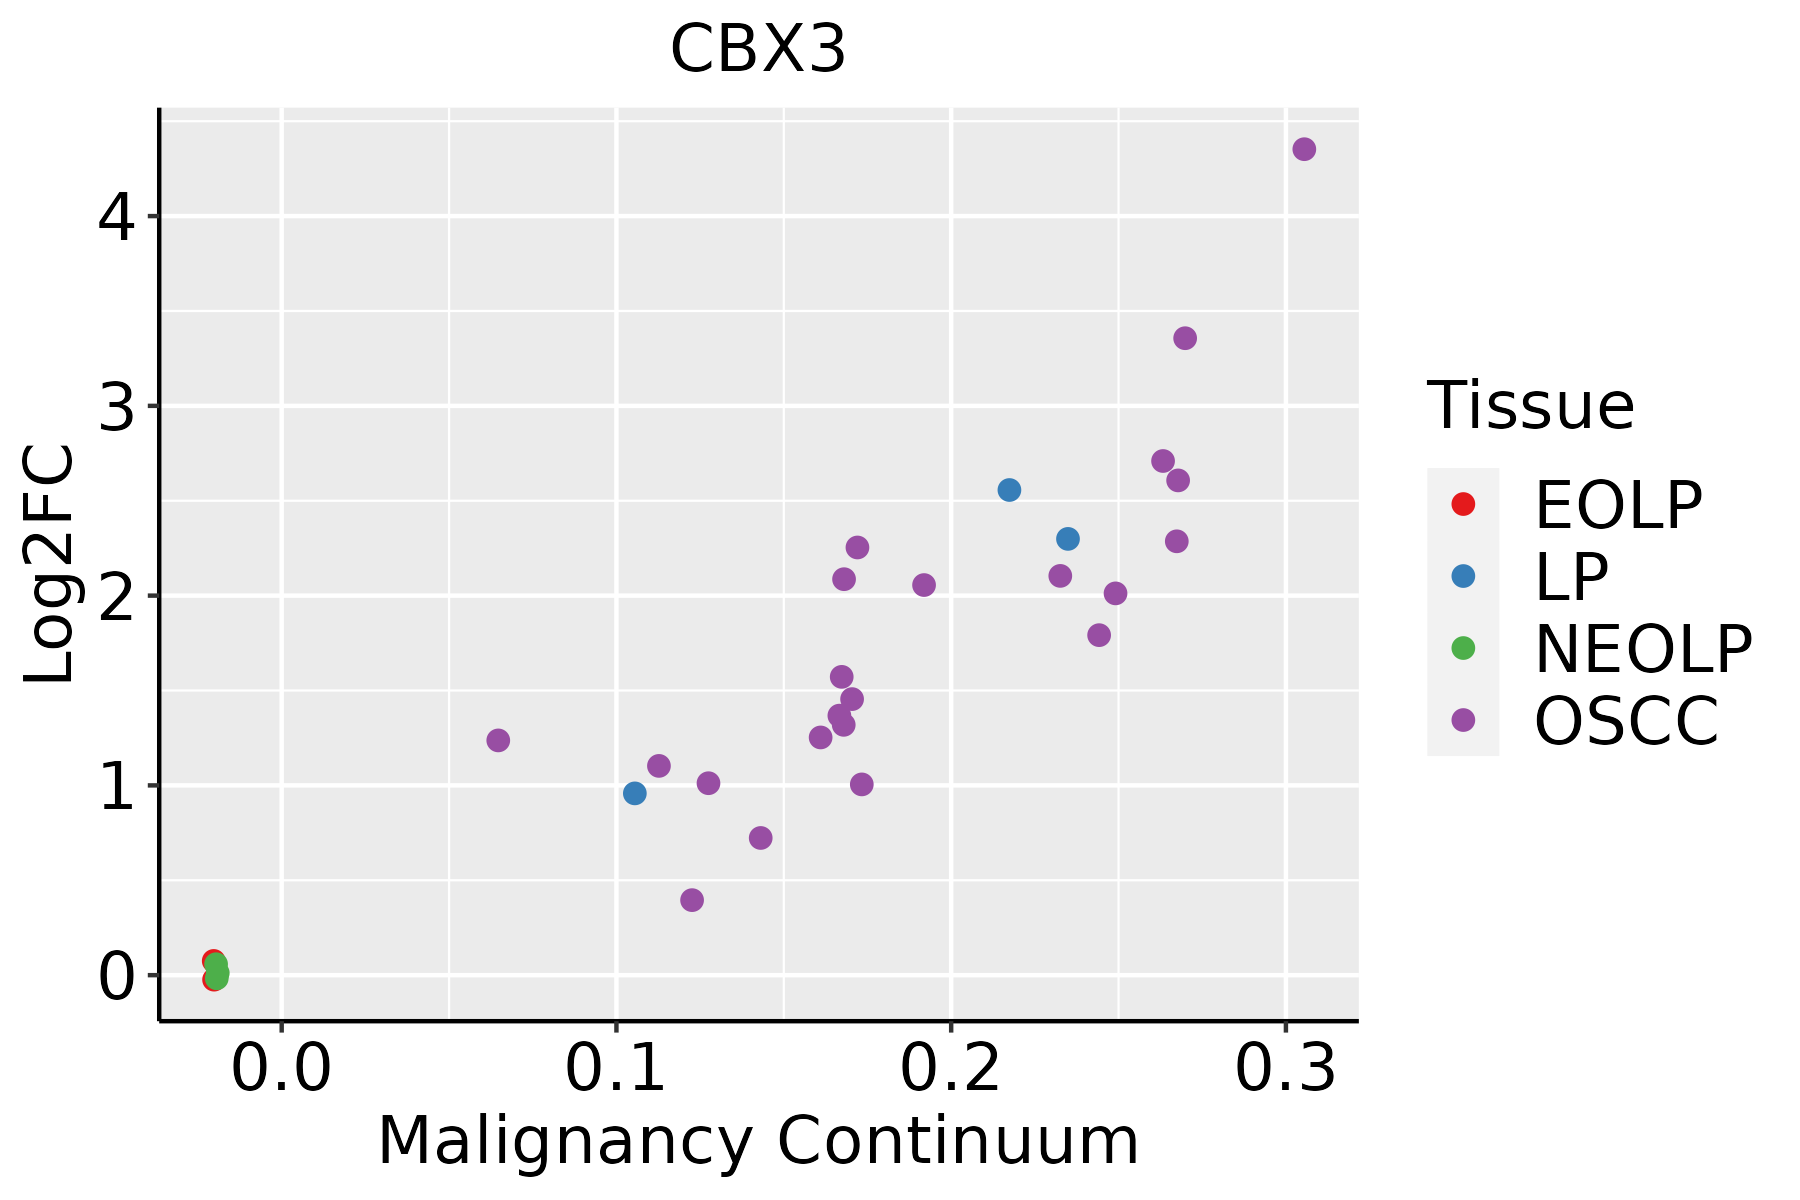 | EOLP: Erosive Oral lichen planus |
| LP: leukoplakia | ||
| NEOLP: Non-erosive oral lichen planus | ||
| OSCC: Oral squamous cell carcinoma | ||
| Prostate |  | BPH: Benign Prostatic Hyperplasia |
| Skin |  | AK: Actinic keratosis |
| cSCC: Cutaneous squamous cell carcinoma | ||
| SCCIS:squamous cell carcinoma in situ | ||
| Thyroid |  | ATC: Anaplastic thyroid cancer |
| HT: Hashimoto's thyroiditis | ||
| PTC: Papillary thyroid cancer |
| ∗log2FC in expression of this searched gene in stem-like cells from each diseased tissue sample relative to stem-like cells in normal samples in each tissue plotted against the malignancy continuum. Samples are colored based on if they are from different disease stage. |
Top |
Malignant transformation related pathway analysis |
| Find out the enriched GO biological processes and KEGG pathways involved in transition from healthy to precancer to cancer |
| Tissue | Disease Stage | Enriched GO biological Processes |
| Colorectum | AD |  |
| Colorectum | SER |  |
| Colorectum | MSS |  |
| Colorectum | MSI-H |  |
| Colorectum | FAP |  |
| ∗Top 15 enriched GO BP terms are showed in the bar plot of each disease state in each tissue. Each row represents a significant GO biological process which is colored according to the -log10(p.adjust). |
| Page: 1 2 3 4 5 6 7 8 9 |
| GO ID | Tissue | Disease Stage | Description | Gene Ratio | Bg Ratio | pvalue | p.adjust | Count |
| GO:00485117 | Breast | IDC | rhythmic process | 38/1434 | 298/18723 | 1.34e-03 | 1.39e-02 | 38 |
| GO:004851113 | Breast | DCIS | rhythmic process | 37/1390 | 298/18723 | 1.44e-03 | 1.47e-02 | 37 |
| GO:0048511 | Colorectum | AD | rhythmic process | 94/3918 | 298/18723 | 1.00e-05 | 2.34e-04 | 94 |
| GO:0006325 | Colorectum | AD | chromatin organization | 119/3918 | 409/18723 | 4.85e-05 | 8.33e-04 | 119 |
| GO:0006338 | Colorectum | AD | chromatin remodeling | 70/3918 | 255/18723 | 7.44e-03 | 4.53e-02 | 70 |
| GO:00485112 | Colorectum | MSS | rhythmic process | 89/3467 | 298/18723 | 1.17e-06 | 3.96e-05 | 89 |
| GO:00063252 | Colorectum | MSS | chromatin organization | 107/3467 | 409/18723 | 7.22e-05 | 1.21e-03 | 107 |
| GO:00485113 | Colorectum | FAP | rhythmic process | 72/2622 | 298/18723 | 1.67e-06 | 6.99e-05 | 72 |
| GO:00063253 | Colorectum | FAP | chromatin organization | 84/2622 | 409/18723 | 1.62e-04 | 2.47e-03 | 84 |
| GO:00485114 | Colorectum | CRC | rhythmic process | 64/2078 | 298/18723 | 1.43e-07 | 1.62e-05 | 64 |
| GO:00063254 | Colorectum | CRC | chromatin organization | 74/2078 | 409/18723 | 1.48e-05 | 4.61e-04 | 74 |
| GO:00485119 | Endometrium | AEH | rhythmic process | 67/2100 | 298/18723 | 1.69e-08 | 1.04e-06 | 67 |
| GO:00063258 | Endometrium | AEH | chromatin organization | 64/2100 | 409/18723 | 3.69e-03 | 2.52e-02 | 64 |
| GO:004851114 | Endometrium | EEC | rhythmic process | 67/2168 | 298/18723 | 5.86e-08 | 3.11e-06 | 67 |
| GO:000632513 | Endometrium | EEC | chromatin organization | 65/2168 | 409/18723 | 4.98e-03 | 3.14e-02 | 65 |
| GO:000632516 | Esophagus | HGIN | chromatin organization | 92/2587 | 409/18723 | 1.05e-06 | 4.16e-05 | 92 |
| GO:000632517 | Esophagus | ESCC | chromatin organization | 240/8552 | 409/18723 | 6.52e-08 | 1.14e-06 | 240 |
| GO:004851118 | Esophagus | ESCC | rhythmic process | 164/8552 | 298/18723 | 6.80e-04 | 3.57e-03 | 164 |
| GO:004851111 | Liver | Cirrhotic | rhythmic process | 103/4634 | 298/18723 | 8.47e-05 | 9.19e-04 | 103 |
| GO:004851121 | Liver | HCC | rhythmic process | 156/7958 | 298/18723 | 3.54e-04 | 2.46e-03 | 156 |
| Page: 1 2 |
| Pathway ID | Tissue | Disease Stage | Description | Gene Ratio | Bg Ratio | pvalue | p.adjust | qvalue | Count |
| hsa0513118 | Breast | Precancer | Shigellosis | 44/684 | 247/8465 | 3.91e-07 | 6.86e-06 | 5.26e-06 | 44 |
| hsa0513119 | Breast | Precancer | Shigellosis | 44/684 | 247/8465 | 3.91e-07 | 6.86e-06 | 5.26e-06 | 44 |
| hsa0513124 | Breast | IDC | Shigellosis | 47/867 | 247/8465 | 1.78e-05 | 2.00e-04 | 1.49e-04 | 47 |
| hsa0513134 | Breast | IDC | Shigellosis | 47/867 | 247/8465 | 1.78e-05 | 2.00e-04 | 1.49e-04 | 47 |
| hsa0513144 | Breast | DCIS | Shigellosis | 46/846 | 247/8465 | 2.06e-05 | 2.38e-04 | 1.75e-04 | 46 |
| hsa0513154 | Breast | DCIS | Shigellosis | 46/846 | 247/8465 | 2.06e-05 | 2.38e-04 | 1.75e-04 | 46 |
| hsa05131 | Colorectum | AD | Shigellosis | 109/2092 | 247/8465 | 1.09e-11 | 2.44e-10 | 1.55e-10 | 109 |
| hsa051311 | Colorectum | AD | Shigellosis | 109/2092 | 247/8465 | 1.09e-11 | 2.44e-10 | 1.55e-10 | 109 |
| hsa051314 | Colorectum | MSS | Shigellosis | 94/1875 | 247/8465 | 6.82e-09 | 1.34e-07 | 8.23e-08 | 94 |
| hsa051315 | Colorectum | MSS | Shigellosis | 94/1875 | 247/8465 | 6.82e-09 | 1.34e-07 | 8.23e-08 | 94 |
| hsa051316 | Colorectum | MSI-H | Shigellosis | 40/797 | 247/8465 | 4.28e-04 | 5.34e-03 | 4.47e-03 | 40 |
| hsa051317 | Colorectum | MSI-H | Shigellosis | 40/797 | 247/8465 | 4.28e-04 | 5.34e-03 | 4.47e-03 | 40 |
| hsa051318 | Colorectum | FAP | Shigellosis | 76/1404 | 247/8465 | 1.57e-08 | 5.84e-07 | 3.55e-07 | 76 |
| hsa051319 | Colorectum | FAP | Shigellosis | 76/1404 | 247/8465 | 1.57e-08 | 5.84e-07 | 3.55e-07 | 76 |
| hsa0513110 | Colorectum | CRC | Shigellosis | 59/1091 | 247/8465 | 1.19e-06 | 5.41e-05 | 3.66e-05 | 59 |
| hsa0513111 | Colorectum | CRC | Shigellosis | 59/1091 | 247/8465 | 1.19e-06 | 5.41e-05 | 3.66e-05 | 59 |
| hsa0513126 | Endometrium | AEH | Shigellosis | 78/1197 | 247/8465 | 9.23e-13 | 2.00e-11 | 1.46e-11 | 78 |
| hsa05131111 | Endometrium | AEH | Shigellosis | 78/1197 | 247/8465 | 9.23e-13 | 2.00e-11 | 1.46e-11 | 78 |
| hsa0513127 | Endometrium | EEC | Shigellosis | 79/1237 | 247/8465 | 1.80e-12 | 3.95e-11 | 2.95e-11 | 79 |
| hsa0513136 | Endometrium | EEC | Shigellosis | 79/1237 | 247/8465 | 1.80e-12 | 3.95e-11 | 2.95e-11 | 79 |
| Page: 1 2 3 |
Top |
Cell-cell communication analysis |
| Identification of potential cell-cell interactions between two cell types and their ligand-receptor pairs for different disease states |
| Ligand | Receptor | LRpair | Pathway | Tissue | Disease Stage |
| Page: 1 |
Top |
Single-cell gene regulatory network inference analysis |
| Find out the significant the regulons (TFs) and the target genes of each regulon across cell types for different disease states |
| TF | Cell Type | Tissue | Disease Stage | Target Gene | RSS | Regulon Activity |
| ∗The dot plots of a searched regulon are shown for all cell subpopulations in each disease state of each tissue based on the regulon specific score inferred using pySCENIC and by calculating the average expression. |
| Page: 1 |
Top |
Somatic mutation of malignant transformation related genes |
| Annotation of somatic variants for genes involved in malignant transformation |
| Hugo Symbol | Variant Class | Variant Classification | dbSNP RS | HGVSc | HGVSp | HGVSp Short | SWISSPROT | BIOTYPE | SIFT | PolyPhen | Tumor Sample Barcode | Tissue | Histology | Sex | Age | Stage | Therapy Types | Drugs | Outcome |
| CBX3 | SNV | Missense_Mutation | c.420N>A | p.Met140Ile | p.M140I | Q13185 | protein_coding | tolerated(0.35) | benign(0.015) | TCGA-E2-A10C-01 | Breast | breast invasive carcinoma | Female | <65 | I/II | Chemotherapy | cytoxan | SD | |
| CBX3 | SNV | Missense_Mutation | c.185A>C | p.Glu62Ala | p.E62A | Q13185 | protein_coding | deleterious(0) | probably_damaging(0.96) | TCGA-FU-A3HZ-01 | Cervix | cervical & endocervical cancer | Female | <65 | I/II | Chemotherapy | cisplatin | CR | |
| CBX3 | SNV | Missense_Mutation | c.458C>T | p.Ala153Val | p.A153V | Q13185 | protein_coding | deleterious(0) | possibly_damaging(0.606) | TCGA-AA-3977-01 | Colorectum | colon adenocarcinoma | Male | >=65 | I/II | Unknown | Unknown | SD | |
| CBX3 | SNV | Missense_Mutation | c.153G>C | p.Trp51Cys | p.W51C | Q13185 | protein_coding | deleterious(0) | probably_damaging(0.999) | TCGA-AG-A00C-01 | Colorectum | rectum adenocarcinoma | Female | <65 | III/IV | Chemotherapy | 5-fluorouracil | CR | |
| CBX3 | deletion | Frame_Shift_Del | c.36delN | p.Lys14AsnfsTer23 | p.K14Nfs*23 | Q13185 | protein_coding | TCGA-A6-5661-01 | Colorectum | colon adenocarcinoma | Female | >=65 | I/II | Unknown | Unknown | SD | |||
| CBX3 | deletion | Frame_Shift_Del | c.26delN | p.Met11TrpfsTer26 | p.M11Wfs*26 | Q13185 | protein_coding | TCGA-A6-6780-01 | Colorectum | colon adenocarcinoma | Male | >=65 | I/II | Unknown | Unknown | SD | |||
| CBX3 | deletion | Frame_Shift_Del | c.31delA | p.Met11TrpfsTer26 | p.M11Wfs*26 | Q13185 | protein_coding | TCGA-AD-6889-01 | Colorectum | colon adenocarcinoma | Male | >=65 | I/II | Chemotherapy | xeloda | PD | |||
| CBX3 | deletion | Frame_Shift_Del | c.26delN | p.Met11TrpfsTer26 | p.M11Wfs*26 | Q13185 | protein_coding | TCGA-G4-6586-01 | Colorectum | colon adenocarcinoma | Female | >=65 | I/II | Unknown | Unknown | SD | |||
| CBX3 | SNV | Missense_Mutation | novel | c.477G>T | p.Lys159Asn | p.K159N | Q13185 | protein_coding | deleterious(0.02) | probably_damaging(0.959) | TCGA-A5-A0G1-01 | Endometrium | uterine corpus endometrioid carcinoma | Female | >=65 | I/II | Unknown | Unknown | SD |
| CBX3 | SNV | Missense_Mutation | novel | c.4G>A | p.Ala2Thr | p.A2T | Q13185 | protein_coding | deleterious_low_confidence(0.01) | possibly_damaging(0.483) | TCGA-A5-A0G2-01 | Endometrium | uterine corpus endometrioid carcinoma | Female | <65 | III/IV | Unknown | Unknown | SD |
| Page: 1 2 3 4 |
Top |
Related drugs of malignant transformation related genes |
| Identification of chemicals and drugs interact with genes involved in malignant transfromation |
| (DGIdb 4.0) |
| Entrez ID | Symbol | Category | Interaction Types | Drug Claim Name | Drug Name | PMIDs |
| Page: 1 |

Copyright 2023-Present -The University of Texas Health Science Center at Houston |