
|
|||||
|
 | |
| |
| |
| |
| |
| |
|
Gene: CBWD5 |
Gene summary for CBWD5 |
| Gene information | Species | Human | Gene symbol | CBWD5 | Gene ID | 220869 |
| Gene name | COBW domain containing 5 | |
| Gene Alias | CBWD3 | |
| Cytomap | 9q21.11 | |
| Gene Type | protein-coding | GO ID | GO:0005575 | UniProtAcc | O60748 |
Top |
Malignant transformation analysis |
| Identification of the aberrant gene expression in precancerous and cancerous lesions by comparing the gene expression of stem-like cells in diseased tissues with normal stem cells |
| Entrez ID | Symbol | Replicates | Species | Organ | Tissue | Adj P-value | Log2FC | Malignancy |
| 220869 | CBWD5 | HTA11_3410_2000001011 | Human | Colorectum | AD | 1.86e-02 | -2.21e-01 | 0.0155 |
| 220869 | CBWD5 | HTA11_99999965062_69753 | Human | Colorectum | MSI-H | 7.15e-06 | 1.39e+00 | 0.3487 |
| 220869 | CBWD5 | A015-C-203 | Human | Colorectum | FAP | 1.10e-07 | -2.13e-01 | -0.1294 |
| 220869 | CBWD5 | A002-C-201 | Human | Colorectum | FAP | 4.07e-03 | -1.13e-01 | 0.0324 |
| 220869 | CBWD5 | A002-C-205 | Human | Colorectum | FAP | 5.15e-08 | -1.98e-01 | -0.1236 |
| 220869 | CBWD5 | A015-C-005 | Human | Colorectum | FAP | 6.94e-03 | -2.12e-01 | -0.0336 |
| 220869 | CBWD5 | A015-C-006 | Human | Colorectum | FAP | 1.26e-03 | -1.95e-01 | -0.0994 |
| 220869 | CBWD5 | A002-C-114 | Human | Colorectum | FAP | 8.68e-08 | -2.54e-01 | -0.1561 |
| 220869 | CBWD5 | A015-C-104 | Human | Colorectum | FAP | 5.71e-07 | -2.38e-01 | -0.1899 |
| 220869 | CBWD5 | A002-C-016 | Human | Colorectum | FAP | 1.73e-05 | -5.29e-02 | 0.0521 |
| 220869 | CBWD5 | A015-C-002 | Human | Colorectum | FAP | 2.63e-02 | -1.95e-01 | -0.0763 |
| 220869 | CBWD5 | A002-C-116 | Human | Colorectum | FAP | 2.38e-07 | -1.93e-01 | -0.0452 |
| 220869 | CBWD5 | A014-C-008 | Human | Colorectum | FAP | 9.65e-03 | -1.96e-02 | -0.191 |
| 220869 | CBWD5 | A018-E-020 | Human | Colorectum | FAP | 6.50e-06 | -1.23e-01 | -0.2034 |
| 220869 | CBWD5 | F034 | Human | Colorectum | FAP | 3.72e-04 | -1.25e-01 | -0.0665 |
| 220869 | CBWD5 | CRC-3-11773 | Human | Colorectum | CRC | 2.90e-02 | 1.68e-01 | 0.2564 |
| 220869 | CBWD5 | LZE4T | Human | Esophagus | ESCC | 2.56e-17 | 6.83e-01 | 0.0811 |
| 220869 | CBWD5 | LZE5T | Human | Esophagus | ESCC | 4.49e-06 | 9.09e-01 | 0.0514 |
| 220869 | CBWD5 | LZE7T | Human | Esophagus | ESCC | 4.27e-21 | 9.63e-01 | 0.0667 |
| 220869 | CBWD5 | LZE8T | Human | Esophagus | ESCC | 2.35e-20 | 6.88e-01 | 0.067 |
| Page: 1 2 3 4 5 6 |
| Tissue | Expression Dynamics | Abbreviation |
| Colorectum (GSE201348) |  | FAP: Familial adenomatous polyposis |
| CRC: Colorectal cancer | ||
| Colorectum (HTA11) | 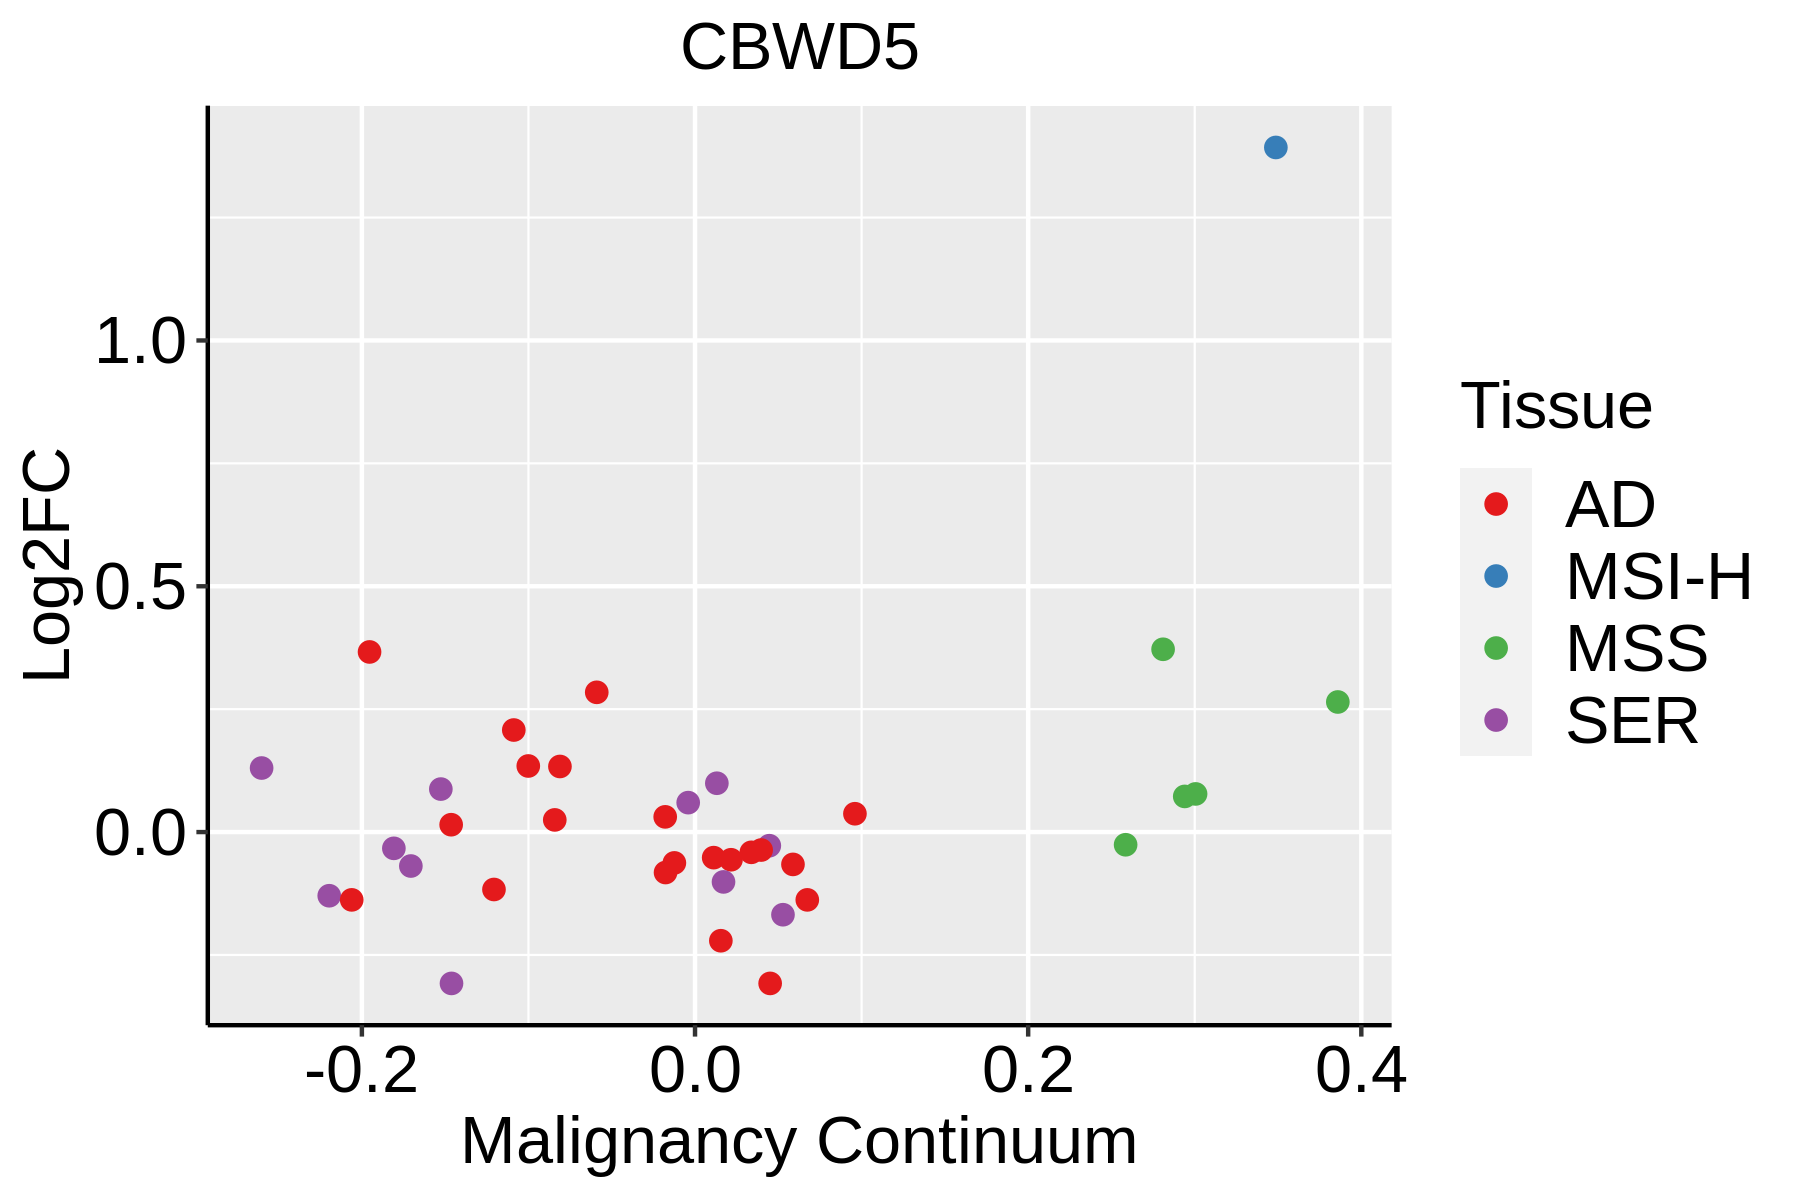 | AD: Adenomas |
| SER: Sessile serrated lesions | ||
| MSI-H: Microsatellite-high colorectal cancer | ||
| MSS: Microsatellite stable colorectal cancer | ||
| Esophagus |  | ESCC: Esophageal squamous cell carcinoma |
| HGIN: High-grade intraepithelial neoplasias | ||
| LGIN: Low-grade intraepithelial neoplasias | ||
| Liver | 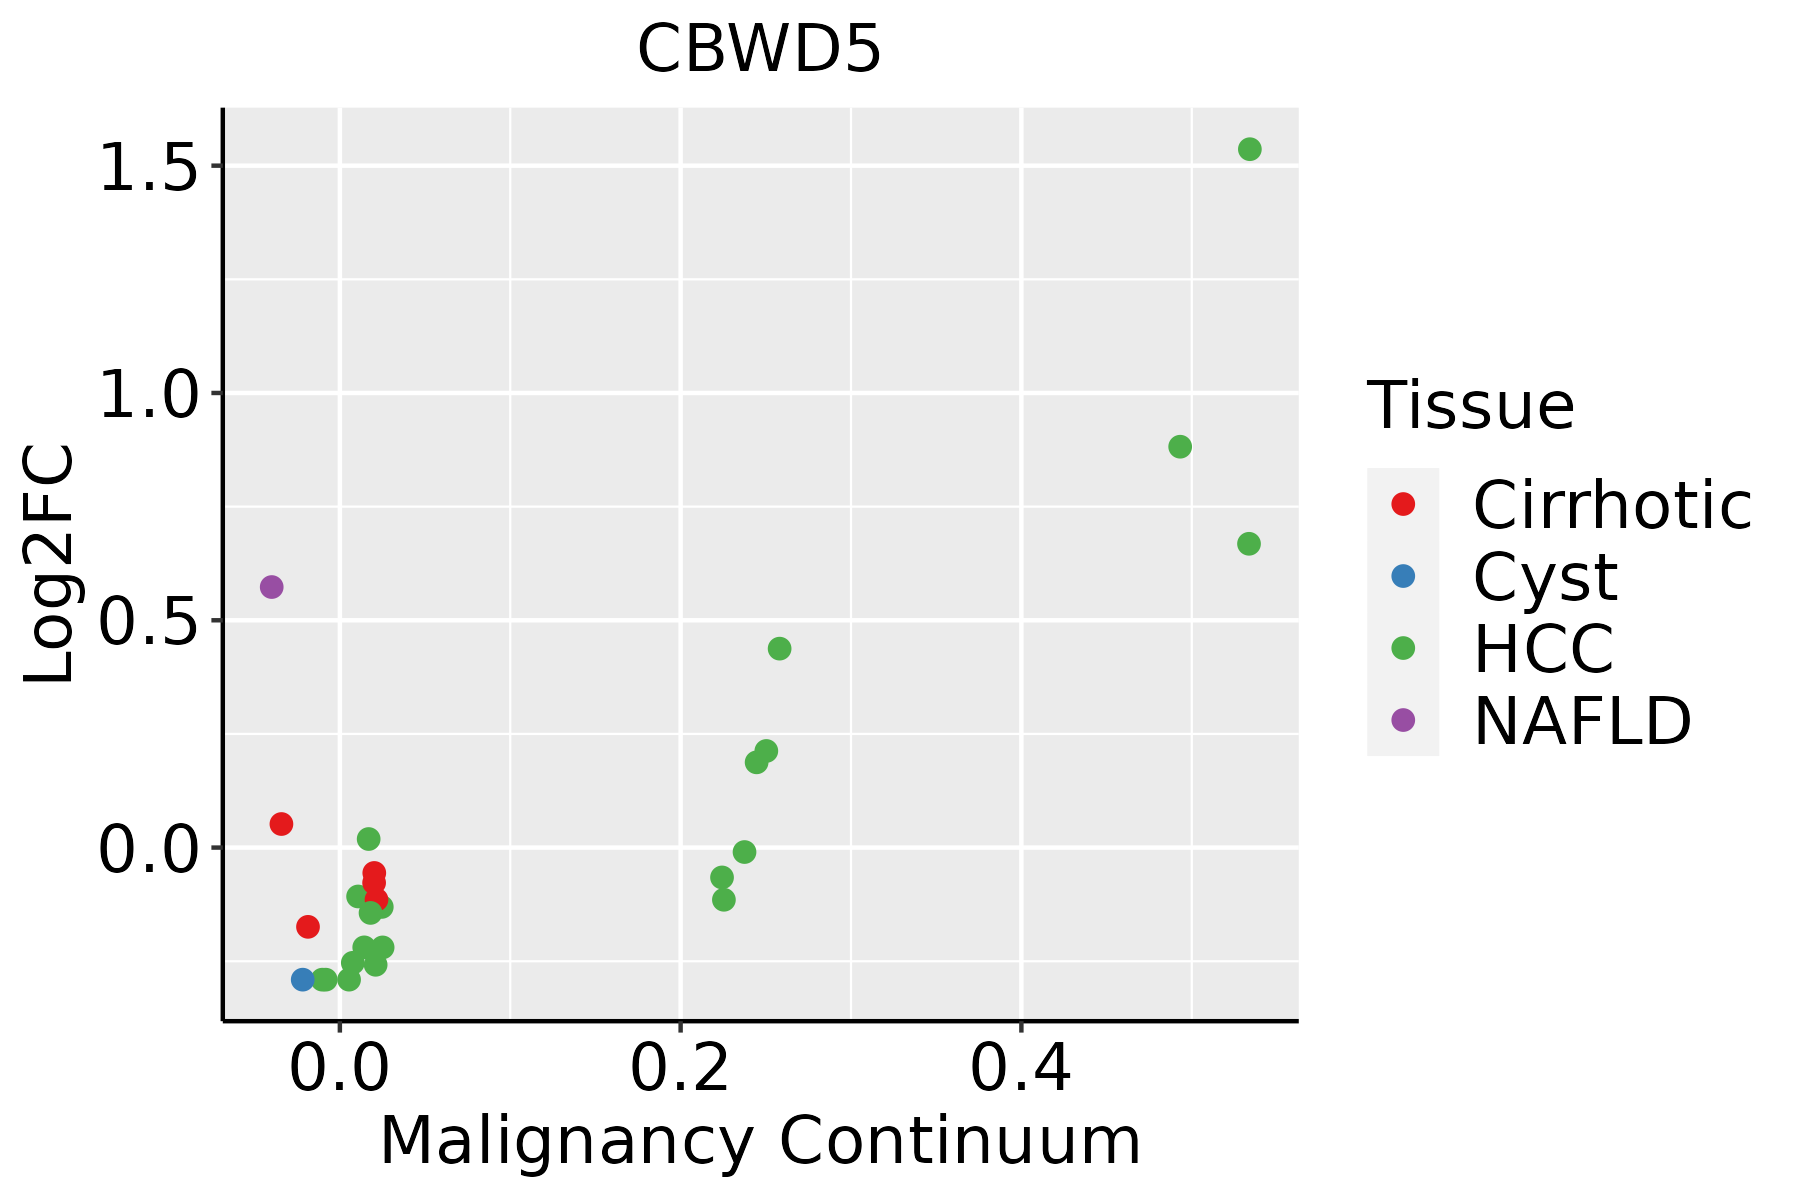 | HCC: Hepatocellular carcinoma |
| NAFLD: Non-alcoholic fatty liver disease | ||
| Oral Cavity | 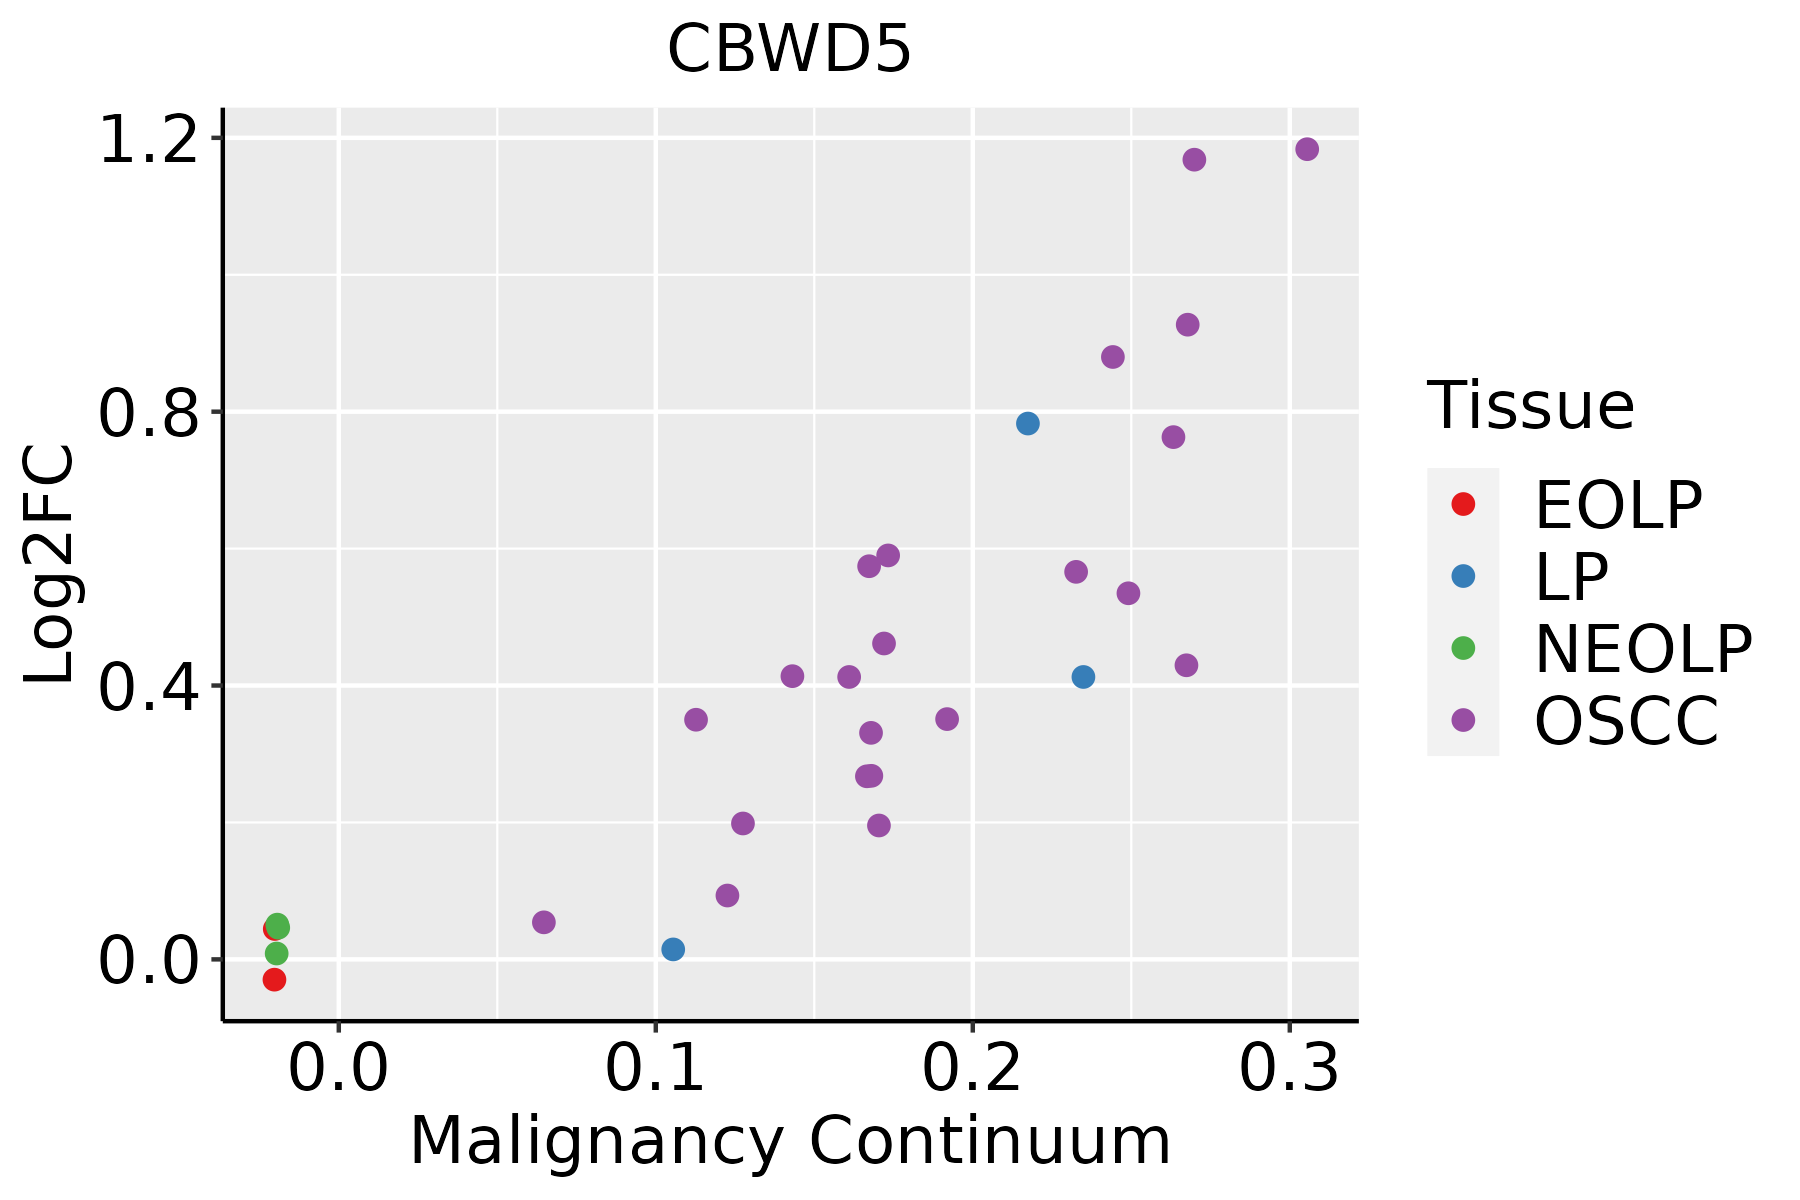 | EOLP: Erosive Oral lichen planus |
| LP: leukoplakia | ||
| NEOLP: Non-erosive oral lichen planus | ||
| OSCC: Oral squamous cell carcinoma |
| ∗log2FC in expression of this searched gene in stem-like cells from each diseased tissue sample relative to stem-like cells in normal samples in each tissue plotted against the malignancy continuum. Samples are colored based on if they are from different disease stage. |
Top |
Malignant transformation related pathway analysis |
| Find out the enriched GO biological processes and KEGG pathways involved in transition from healthy to precancer to cancer |
| Tissue | Disease Stage | Enriched GO biological Processes |
| Colorectum | AD |  |
| Colorectum | SER |  |
| Colorectum | MSS |  |
| Colorectum | MSI-H |  |
| Colorectum | FAP |  |
| ∗Top 15 enriched GO BP terms are showed in the bar plot of each disease state in each tissue. Each row represents a significant GO biological process which is colored according to the -log10(p.adjust). |
| Page: 1 2 3 4 5 6 7 8 9 |
| GO ID | Tissue | Disease Stage | Description | Gene Ratio | Bg Ratio | pvalue | p.adjust | Count |
| Page: 1 |
| Pathway ID | Tissue | Disease Stage | Description | Gene Ratio | Bg Ratio | pvalue | p.adjust | qvalue | Count |
| Page: 1 |
Top |
Cell-cell communication analysis |
| Identification of potential cell-cell interactions between two cell types and their ligand-receptor pairs for different disease states |
| Ligand | Receptor | LRpair | Pathway | Tissue | Disease Stage |
| Page: 1 |
Top |
Single-cell gene regulatory network inference analysis |
| Find out the significant the regulons (TFs) and the target genes of each regulon across cell types for different disease states |
| TF | Cell Type | Tissue | Disease Stage | Target Gene | RSS | Regulon Activity |
| ∗The dot plots of a searched regulon are shown for all cell subpopulations in each disease state of each tissue based on the regulon specific score inferred using pySCENIC and by calculating the average expression. |
| Page: 1 |
Top |
Somatic mutation of malignant transformation related genes |
| Annotation of somatic variants for genes involved in malignant transformation |
| Hugo Symbol | Variant Class | Variant Classification | dbSNP RS | HGVSc | HGVSp | HGVSp Short | SWISSPROT | BIOTYPE | SIFT | PolyPhen | Tumor Sample Barcode | Tissue | Histology | Sex | Age | Stage | Therapy Types | Drugs | Outcome |
| CBWD5 | SNV | Missense_Mutation | novel | c.406N>A | p.Glu136Lys | p.E136K | Q5RIA9 | protein_coding | deleterious(0.05) | possibly_damaging(0.571) | TCGA-AC-A23H-01 | Breast | breast invasive carcinoma | Female | >=65 | I/II | Unknown | Unknown | PD |
| CBWD5 | SNV | Missense_Mutation | rs371887218 | c.61G>C | p.Glu21Gln | p.E21Q | Q5RIA9 | protein_coding | tolerated(0.17) | possibly_damaging(0.451) | TCGA-DR-A0ZM-01 | Cervix | cervical & endocervical cancer | Female | <65 | III/IV | Unspecific | Cisplatin | SD |
| CBWD5 | SNV | Missense_Mutation | novel | c.1058N>A | p.Arg353Lys | p.R353K | Q5RIA9 | protein_coding | tolerated(0.2) | possibly_damaging(0.506) | TCGA-VS-A954-01 | Cervix | cervical & endocervical cancer | Female | >=65 | III/IV | Chemotherapy | cisplatin | CR |
| CBWD5 | SNV | Missense_Mutation | novel | c.1006G>A | p.Glu336Lys | p.E336K | Q5RIA9 | protein_coding | deleterious(0.04) | possibly_damaging(0.893) | TCGA-ZJ-A8QR-01 | Cervix | cervical & endocervical cancer | Female | <65 | I/II | Unknown | Unknown | SD |
| CBWD5 | SNV | Missense_Mutation | novel | c.258N>C | p.Lys86Asn | p.K86N | Q5RIA9 | protein_coding | deleterious(0) | probably_damaging(0.999) | TCGA-A6-3809-01 | Colorectum | colon adenocarcinoma | Female | >=65 | I/II | Unknown | Unknown | SD |
| CBWD5 | SNV | Missense_Mutation | novel | c.807N>G | p.His269Gln | p.H269Q | Q5RIA9 | protein_coding | deleterious(0) | probably_damaging(0.967) | TCGA-DM-A1D0-01 | Colorectum | colon adenocarcinoma | Female | >=65 | I/II | Unknown | Unknown | SD |
| CBWD5 | SNV | Missense_Mutation | novel | c.22N>A | p.Val8Met | p.V8M | Q5RIA9 | protein_coding | deleterious_low_confidence(0.02) | benign(0.309) | TCGA-A5-A0G1-01 | Endometrium | uterine corpus endometrioid carcinoma | Female | >=65 | I/II | Unknown | Unknown | SD |
| CBWD5 | SNV | Missense_Mutation | novel | c.674N>A | p.Gly225Glu | p.G225E | Q5RIA9 | protein_coding | deleterious(0.02) | possibly_damaging(0.6) | TCGA-A5-A0G2-01 | Endometrium | uterine corpus endometrioid carcinoma | Female | <65 | III/IV | Unknown | Unknown | SD |
| CBWD5 | SNV | Missense_Mutation | novel | c.796N>G | p.Thr266Ala | p.T266A | Q5RIA9 | protein_coding | tolerated(0.37) | benign(0) | TCGA-A5-A0G2-01 | Endometrium | uterine corpus endometrioid carcinoma | Female | <65 | III/IV | Unknown | Unknown | SD |
| CBWD5 | SNV | Missense_Mutation | novel | c.1126N>G | p.Thr376Ala | p.T376A | Q5RIA9 | protein_coding | tolerated(0.16) | benign(0.013) | TCGA-A5-A0G2-01 | Endometrium | uterine corpus endometrioid carcinoma | Female | <65 | III/IV | Unknown | Unknown | SD |
| Page: 1 2 3 |
Top |
Related drugs of malignant transformation related genes |
| Identification of chemicals and drugs interact with genes involved in malignant transfromation |
| (DGIdb 4.0) |
| Entrez ID | Symbol | Category | Interaction Types | Drug Claim Name | Drug Name | PMIDs |
| Page: 1 |

Copyright 2023-Present -The University of Texas Health Science Center at Houston |