
|
|||||
|
 | |
| |
| |
| |
| |
| |
|
Gene: CBWD2 |
Gene summary for CBWD2 |
| Gene information | Species | Human | Gene symbol | CBWD2 | Gene ID | 150472 |
| Gene name | COBW domain containing 2 | |
| Gene Alias | CBWD2 | |
| Cytomap | 2q14.1 | |
| Gene Type | protein-coding | GO ID | GO:0005575 | UniProtAcc | C9J3G2 |
Top |
Malignant transformation analysis |
| Identification of the aberrant gene expression in precancerous and cancerous lesions by comparing the gene expression of stem-like cells in diseased tissues with normal stem cells |
| Entrez ID | Symbol | Replicates | Species | Organ | Tissue | Adj P-value | Log2FC | Malignancy |
| 150472 | CBWD2 | HTA11_99999965062_69753 | Human | Colorectum | MSI-H | 1.61e-02 | 9.05e-01 | 0.3487 |
| 150472 | CBWD2 | HTA11_99999965104_69814 | Human | Colorectum | MSS | 1.96e-09 | 6.91e-01 | 0.281 |
| 150472 | CBWD2 | A015-C-203 | Human | Colorectum | FAP | 1.41e-07 | -1.87e-01 | -0.1294 |
| 150472 | CBWD2 | A002-C-201 | Human | Colorectum | FAP | 1.74e-04 | -2.19e-01 | 0.0324 |
| 150472 | CBWD2 | A001-C-108 | Human | Colorectum | FAP | 4.41e-03 | -7.53e-02 | -0.0272 |
| 150472 | CBWD2 | A002-C-205 | Human | Colorectum | FAP | 2.87e-06 | -2.11e-01 | -0.1236 |
| 150472 | CBWD2 | A015-C-006 | Human | Colorectum | FAP | 3.64e-02 | -1.33e-01 | -0.0994 |
| 150472 | CBWD2 | A002-C-114 | Human | Colorectum | FAP | 9.68e-04 | -1.62e-01 | -0.1561 |
| 150472 | CBWD2 | A015-C-104 | Human | Colorectum | FAP | 7.26e-07 | -1.81e-01 | -0.1899 |
| 150472 | CBWD2 | A002-C-016 | Human | Colorectum | FAP | 1.80e-05 | -1.86e-01 | 0.0521 |
| 150472 | CBWD2 | A001-C-203 | Human | Colorectum | FAP | 4.17e-03 | -1.53e-01 | -0.0481 |
| 150472 | CBWD2 | A002-C-116 | Human | Colorectum | FAP | 2.24e-10 | -2.53e-01 | -0.0452 |
| 150472 | CBWD2 | A014-C-008 | Human | Colorectum | FAP | 4.72e-02 | -1.40e-01 | -0.191 |
| 150472 | CBWD2 | A018-E-020 | Human | Colorectum | FAP | 1.91e-03 | -1.33e-01 | -0.2034 |
| 150472 | CBWD2 | F034 | Human | Colorectum | FAP | 1.12e-05 | -2.11e-01 | -0.0665 |
| 150472 | CBWD2 | LZE2D | Human | Esophagus | HGIN | 1.03e-06 | 5.46e-01 | 0.0642 |
| 150472 | CBWD2 | LZE2T | Human | Esophagus | ESCC | 7.06e-08 | 7.78e-01 | 0.082 |
| 150472 | CBWD2 | LZE4T | Human | Esophagus | ESCC | 1.39e-23 | 6.42e-01 | 0.0811 |
| 150472 | CBWD2 | LZE5T | Human | Esophagus | ESCC | 3.71e-10 | 6.77e-01 | 0.0514 |
| 150472 | CBWD2 | LZE7T | Human | Esophagus | ESCC | 9.24e-13 | 7.35e-01 | 0.0667 |
| Page: 1 2 3 4 5 |
| Tissue | Expression Dynamics | Abbreviation |
| Colorectum (GSE201348) |  | FAP: Familial adenomatous polyposis |
| CRC: Colorectal cancer | ||
| Colorectum (HTA11) |  | AD: Adenomas |
| SER: Sessile serrated lesions | ||
| MSI-H: Microsatellite-high colorectal cancer | ||
| MSS: Microsatellite stable colorectal cancer | ||
| Esophagus | 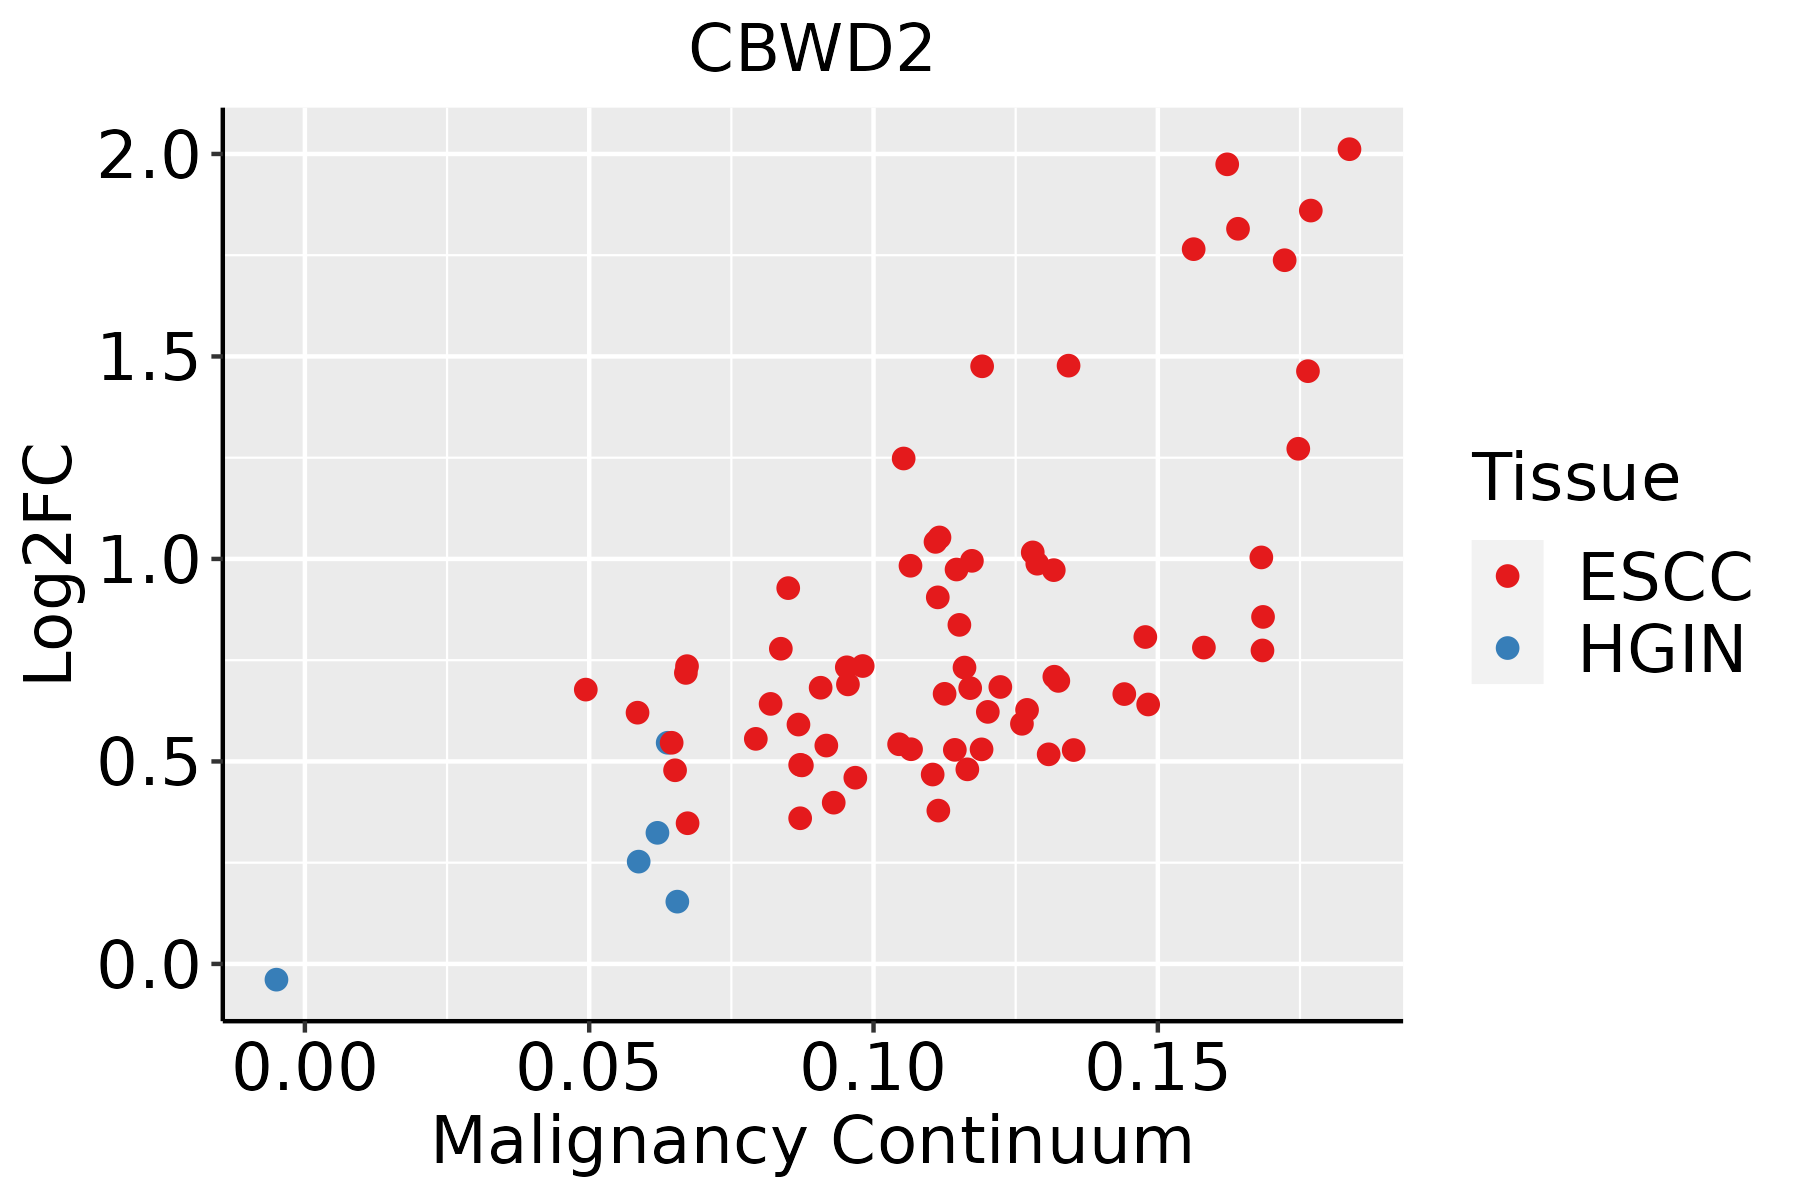 | ESCC: Esophageal squamous cell carcinoma |
| HGIN: High-grade intraepithelial neoplasias | ||
| LGIN: Low-grade intraepithelial neoplasias | ||
| Liver | 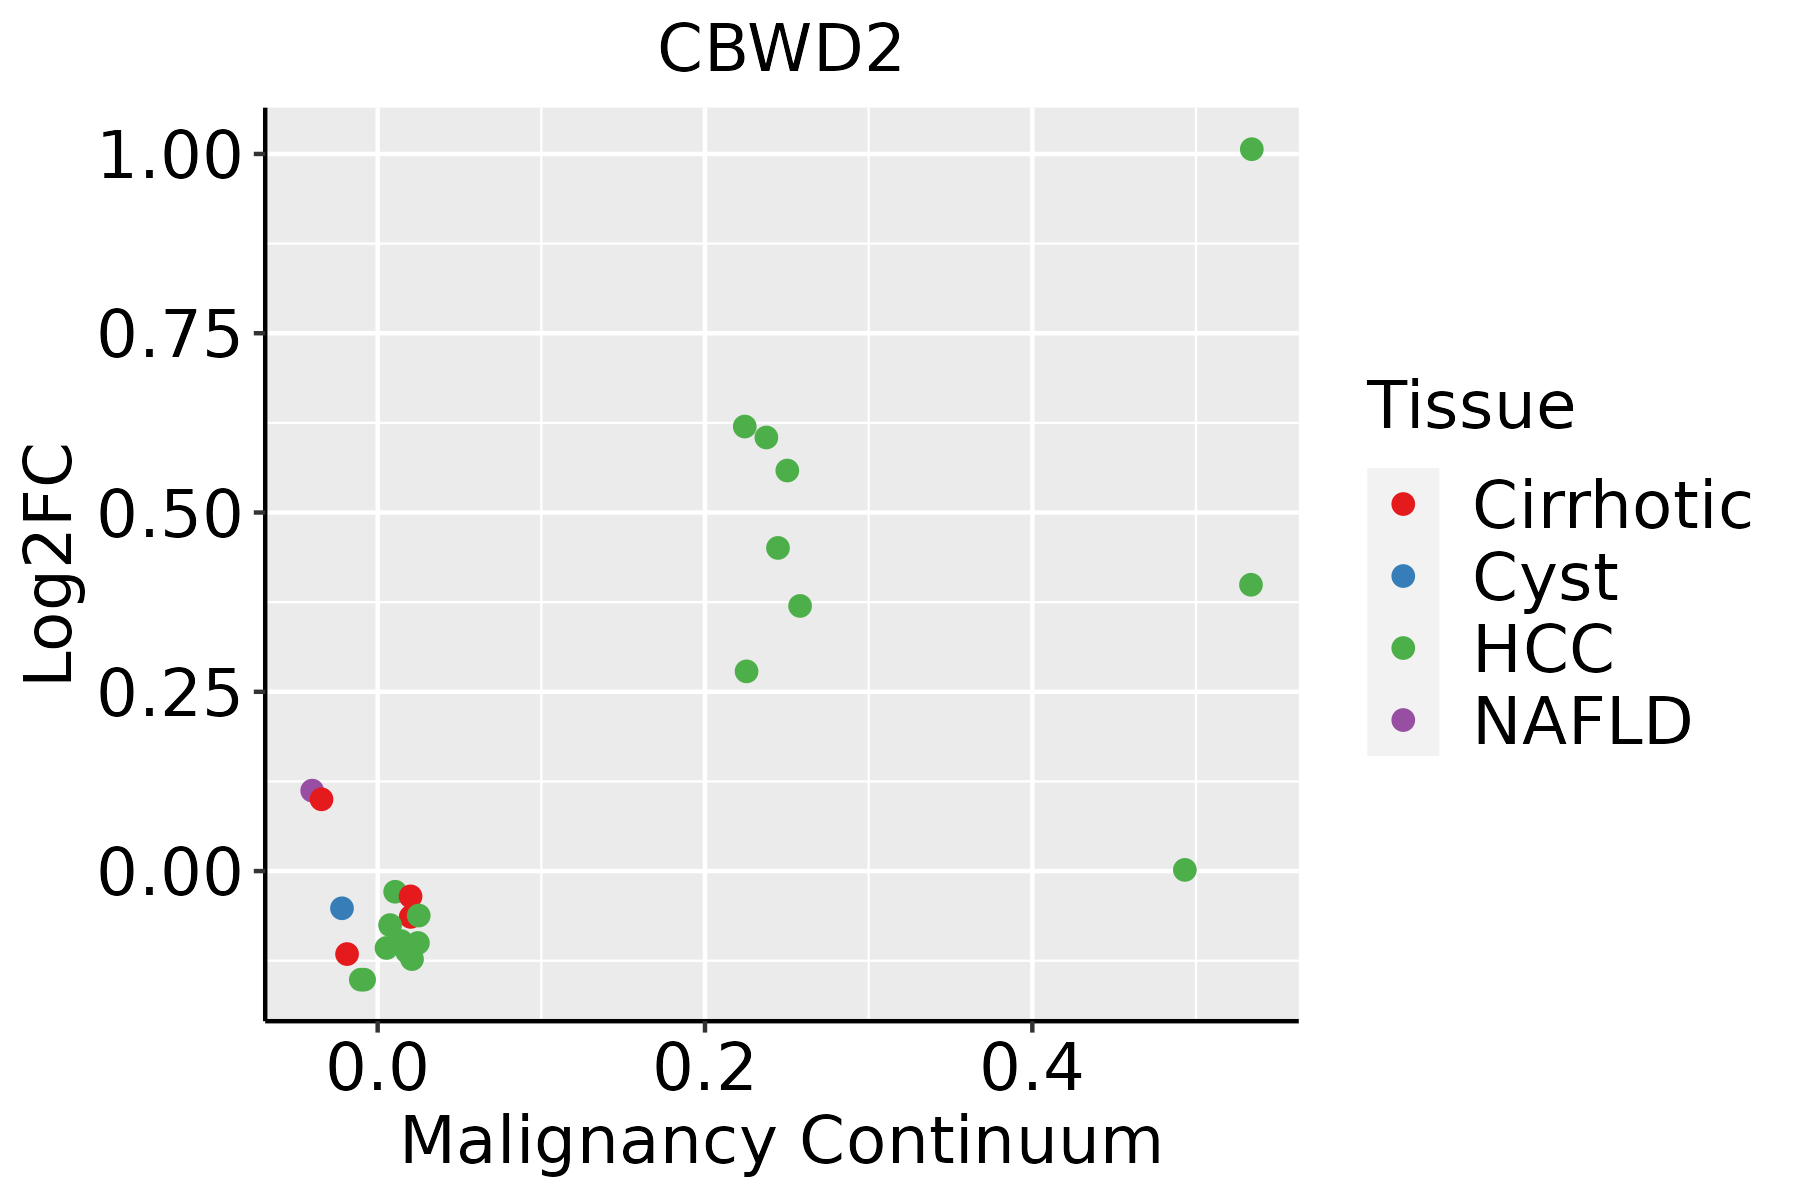 | HCC: Hepatocellular carcinoma |
| NAFLD: Non-alcoholic fatty liver disease | ||
| Skin | 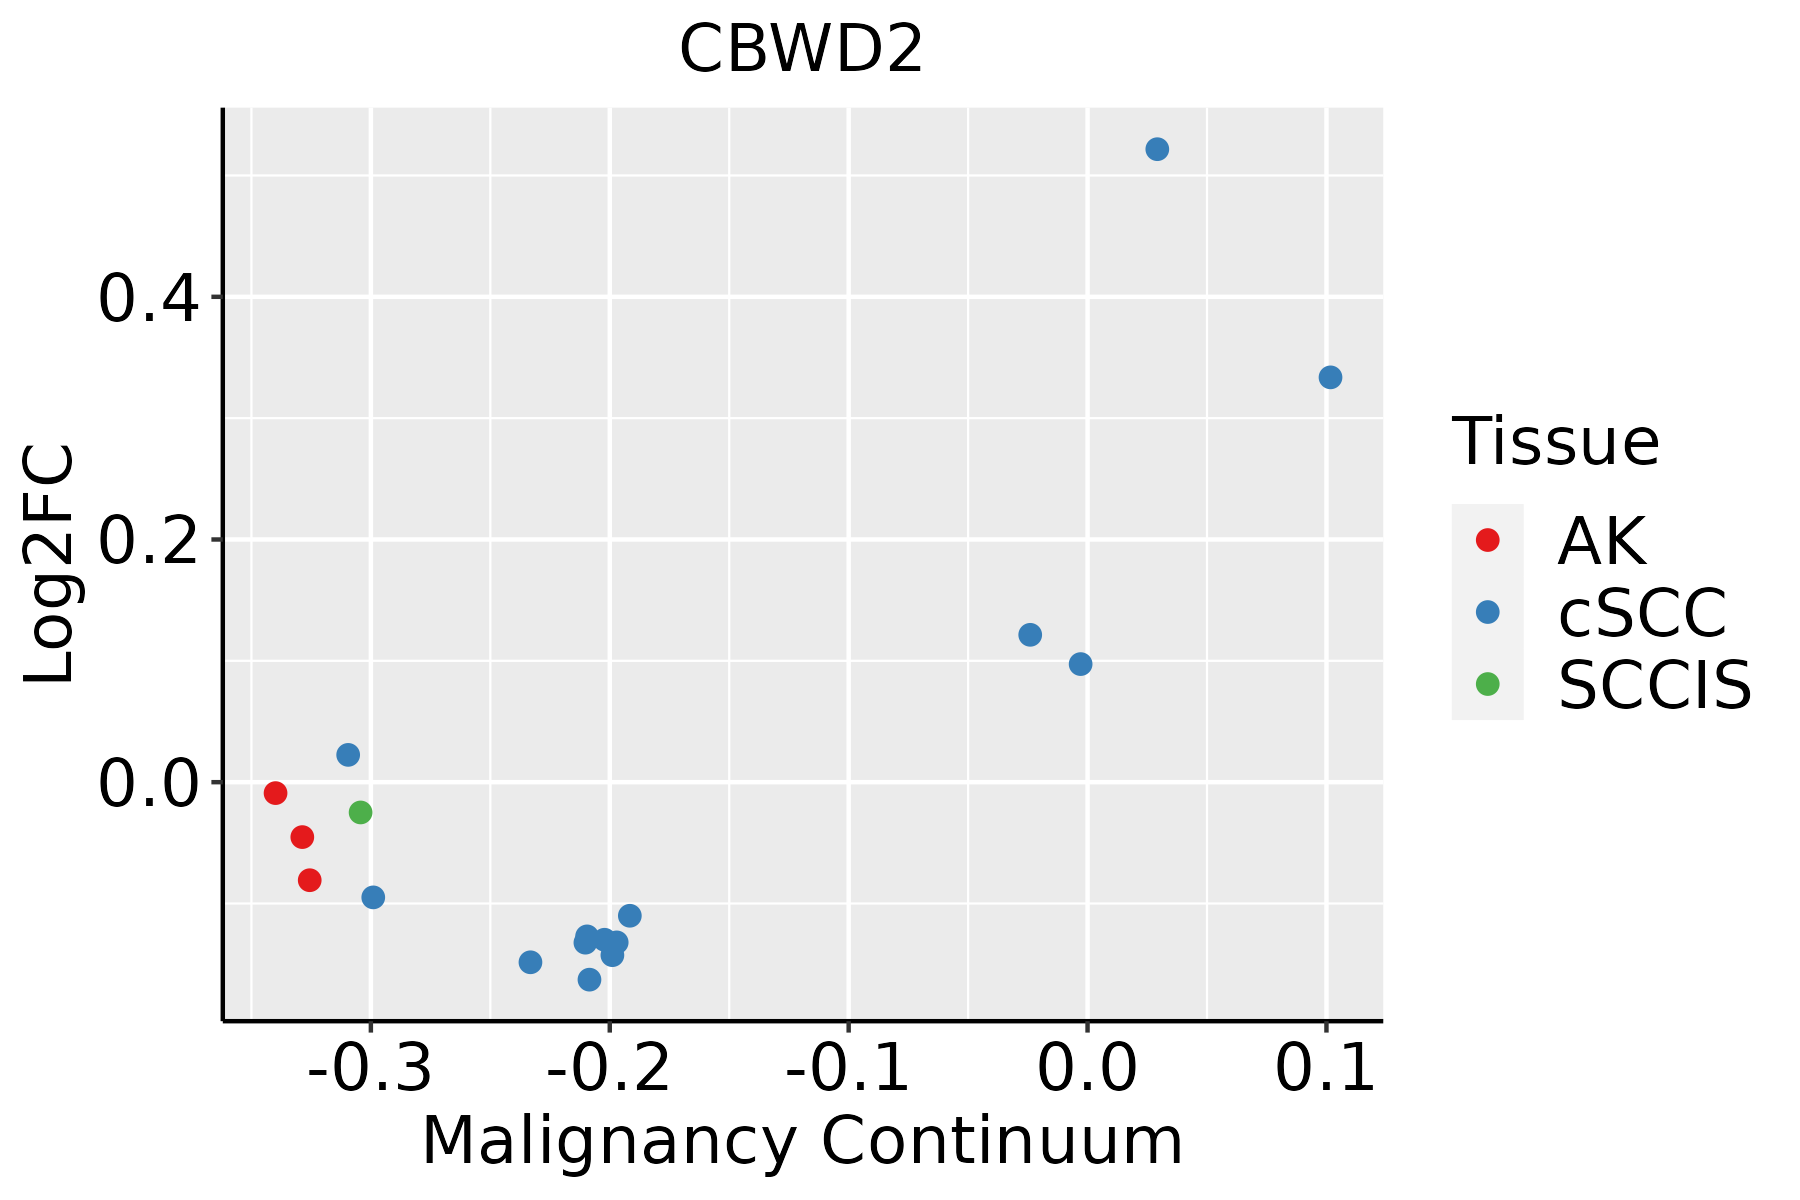 | AK: Actinic keratosis |
| cSCC: Cutaneous squamous cell carcinoma | ||
| SCCIS:squamous cell carcinoma in situ |
| ∗log2FC in expression of this searched gene in stem-like cells from each diseased tissue sample relative to stem-like cells in normal samples in each tissue plotted against the malignancy continuum. Samples are colored based on if they are from different disease stage. |
Top |
Malignant transformation related pathway analysis |
| Find out the enriched GO biological processes and KEGG pathways involved in transition from healthy to precancer to cancer |
| Tissue | Disease Stage | Enriched GO biological Processes |
| Colorectum | AD |  |
| Colorectum | SER |  |
| Colorectum | MSS |  |
| Colorectum | MSI-H |  |
| Colorectum | FAP |  |
| ∗Top 15 enriched GO BP terms are showed in the bar plot of each disease state in each tissue. Each row represents a significant GO biological process which is colored according to the -log10(p.adjust). |
| Page: 1 2 3 4 5 6 7 8 9 |
| GO ID | Tissue | Disease Stage | Description | Gene Ratio | Bg Ratio | pvalue | p.adjust | Count |
| Page: 1 |
| Pathway ID | Tissue | Disease Stage | Description | Gene Ratio | Bg Ratio | pvalue | p.adjust | qvalue | Count |
| Page: 1 |
Top |
Cell-cell communication analysis |
| Identification of potential cell-cell interactions between two cell types and their ligand-receptor pairs for different disease states |
| Ligand | Receptor | LRpair | Pathway | Tissue | Disease Stage |
| Page: 1 |
Top |
Single-cell gene regulatory network inference analysis |
| Find out the significant the regulons (TFs) and the target genes of each regulon across cell types for different disease states |
| TF | Cell Type | Tissue | Disease Stage | Target Gene | RSS | Regulon Activity |
| ∗The dot plots of a searched regulon are shown for all cell subpopulations in each disease state of each tissue based on the regulon specific score inferred using pySCENIC and by calculating the average expression. |
| Page: 1 |
Top |
Somatic mutation of malignant transformation related genes |
| Annotation of somatic variants for genes involved in malignant transformation |
| Hugo Symbol | Variant Class | Variant Classification | dbSNP RS | HGVSc | HGVSp | HGVSp Short | SWISSPROT | BIOTYPE | SIFT | PolyPhen | Tumor Sample Barcode | Tissue | Histology | Sex | Age | Stage | Therapy Types | Drugs | Outcome |
| CBWD2 | SNV | Missense_Mutation | novel | c.561C>G | p.Ile187Met | p.I187M | Q8IUF1 | protein_coding | tolerated(0.27) | benign(0.219) | TCGA-EA-A1QS-01 | Cervix | cervical & endocervical cancer | Female | <65 | I/II | Unknown | Unknown | SD |
| CBWD2 | SNV | Missense_Mutation | novel | c.17G>A | p.Gly6Glu | p.G6E | Q8IUF1 | protein_coding | tolerated_low_confidence(0.11) | benign(0.074) | TCGA-EA-A43B-01 | Cervix | cervical & endocervical cancer | Female | <65 | I/II | Chemotherapy | cisplatin | CR |
| CBWD2 | SNV | Missense_Mutation | novel | c.53N>G | p.Asp18Gly | p.D18G | Q8IUF1 | protein_coding | tolerated(0.06) | possibly_damaging(0.468) | TCGA-EK-A2IP-01 | Cervix | cervical & endocervical cancer | Female | <65 | I/II | Unknown | Unknown | SD |
| CBWD2 | SNV | Missense_Mutation | c.463N>C | p.Glu155Gln | p.E155Q | Q8IUF1 | protein_coding | tolerated(0.05) | possibly_damaging(0.524) | TCGA-EK-A3GJ-01 | Cervix | cervical & endocervical cancer | Female | <65 | I/II | Unknown | Unknown | SD | |
| CBWD2 | SNV | Missense_Mutation | novel | c.158N>A | p.Ala53Asp | p.A53D | Q8IUF1 | protein_coding | deleterious(0) | probably_damaging(0.994) | TCGA-AA-3492-01 | Colorectum | colon adenocarcinoma | Female | >=65 | I/II | Unknown | Unknown | SD |
| CBWD2 | SNV | Missense_Mutation | novel | c.378G>T | p.Lys126Asn | p.K126N | Q8IUF1 | protein_coding | deleterious(0.02) | probably_damaging(0.928) | TCGA-A5-A1OF-01 | Endometrium | uterine corpus endometrioid carcinoma | Female | <65 | I/II | Unknown | Unknown | SD |
| CBWD2 | SNV | Missense_Mutation | novel | c.1087N>G | p.Asn363Asp | p.N363D | Q8IUF1 | protein_coding | tolerated(0.07) | benign(0.168) | TCGA-AP-A1DV-01 | Endometrium | uterine corpus endometrioid carcinoma | Female | <65 | I/II | Unknown | Unknown | SD |
| CBWD2 | SNV | Missense_Mutation | novel | c.475N>T | p.Asp159Tyr | p.D159Y | Q8IUF1 | protein_coding | deleterious(0) | probably_damaging(0.995) | TCGA-AP-A1E0-01 | Endometrium | uterine corpus endometrioid carcinoma | Female | <65 | III/IV | Chemotherapy | paclitaxel | SD |
| CBWD2 | SNV | Missense_Mutation | novel | c.123N>T | p.Lys41Asn | p.K41N | Q8IUF1 | protein_coding | deleterious(0) | benign(0.424) | TCGA-AX-A1CE-01 | Endometrium | uterine corpus endometrioid carcinoma | Female | <65 | I/II | Unspecific | Paclitaxel | SD |
| CBWD2 | SNV | Missense_Mutation | c.1058N>T | p.Arg353Ile | p.R353I | Q8IUF1 | protein_coding | deleterious(0.04) | probably_damaging(0.931) | TCGA-B5-A0JY-01 | Endometrium | uterine corpus endometrioid carcinoma | Female | <65 | III/IV | Chemotherapy | doxorubicin | SD |
| Page: 1 2 3 |
Top |
Related drugs of malignant transformation related genes |
| Identification of chemicals and drugs interact with genes involved in malignant transfromation |
| (DGIdb 4.0) |
| Entrez ID | Symbol | Category | Interaction Types | Drug Claim Name | Drug Name | PMIDs |
| Page: 1 |

Copyright 2023-Present -The University of Texas Health Science Center at Houston |