
|
|||||
|
 | |
| |
| |
| |
| |
| |
|
Gene: CBR4 |
Gene summary for CBR4 |
| Gene information | Species | Human | Gene symbol | CBR4 | Gene ID | 84869 |
| Gene name | carbonyl reductase 4 | |
| Gene Alias | SDR45C1 | |
| Cytomap | 4q32.3 | |
| Gene Type | protein-coding | GO ID | GO:0006066 | UniProtAcc | Q8N4T8 |
Top |
Malignant transformation analysis |
| Identification of the aberrant gene expression in precancerous and cancerous lesions by comparing the gene expression of stem-like cells in diseased tissues with normal stem cells |
| Entrez ID | Symbol | Replicates | Species | Organ | Tissue | Adj P-value | Log2FC | Malignancy |
| 84869 | CBR4 | CCI_1 | Human | Cervix | CC | 3.53e-02 | 6.32e-01 | 0.528 |
| 84869 | CBR4 | CCI_2 | Human | Cervix | CC | 2.36e-03 | 5.85e-01 | 0.5249 |
| 84869 | CBR4 | LZE5T | Human | Esophagus | ESCC | 2.63e-02 | 2.02e-01 | 0.0514 |
| 84869 | CBR4 | LZE8T | Human | Esophagus | ESCC | 2.67e-04 | 1.51e-01 | 0.067 |
| 84869 | CBR4 | LZE24T | Human | Esophagus | ESCC | 4.17e-02 | 8.61e-02 | 0.0596 |
| 84869 | CBR4 | LZE6T | Human | Esophagus | ESCC | 5.22e-03 | 1.71e-01 | 0.0845 |
| 84869 | CBR4 | P2T-E | Human | Esophagus | ESCC | 2.64e-10 | 1.96e-01 | 0.1177 |
| 84869 | CBR4 | P4T-E | Human | Esophagus | ESCC | 2.09e-05 | 1.99e-01 | 0.1323 |
| 84869 | CBR4 | P5T-E | Human | Esophagus | ESCC | 5.69e-04 | 1.73e-02 | 0.1327 |
| 84869 | CBR4 | P8T-E | Human | Esophagus | ESCC | 5.99e-08 | 9.72e-02 | 0.0889 |
| 84869 | CBR4 | P9T-E | Human | Esophagus | ESCC | 2.46e-06 | 1.85e-01 | 0.1131 |
| 84869 | CBR4 | P10T-E | Human | Esophagus | ESCC | 3.24e-07 | 1.17e-01 | 0.116 |
| 84869 | CBR4 | P11T-E | Human | Esophagus | ESCC | 3.27e-02 | 1.13e-01 | 0.1426 |
| 84869 | CBR4 | P12T-E | Human | Esophagus | ESCC | 1.95e-24 | 4.67e-01 | 0.1122 |
| 84869 | CBR4 | P15T-E | Human | Esophagus | ESCC | 3.07e-04 | 7.95e-02 | 0.1149 |
| 84869 | CBR4 | P16T-E | Human | Esophagus | ESCC | 8.22e-05 | 1.60e-01 | 0.1153 |
| 84869 | CBR4 | P20T-E | Human | Esophagus | ESCC | 1.64e-02 | 1.16e-01 | 0.1124 |
| 84869 | CBR4 | P21T-E | Human | Esophagus | ESCC | 4.38e-09 | 1.39e-01 | 0.1617 |
| 84869 | CBR4 | P22T-E | Human | Esophagus | ESCC | 3.83e-10 | 1.61e-01 | 0.1236 |
| 84869 | CBR4 | P23T-E | Human | Esophagus | ESCC | 4.57e-03 | 8.45e-02 | 0.108 |
| Page: 1 2 3 4 5 6 |
| Tissue | Expression Dynamics | Abbreviation |
| Cervix | 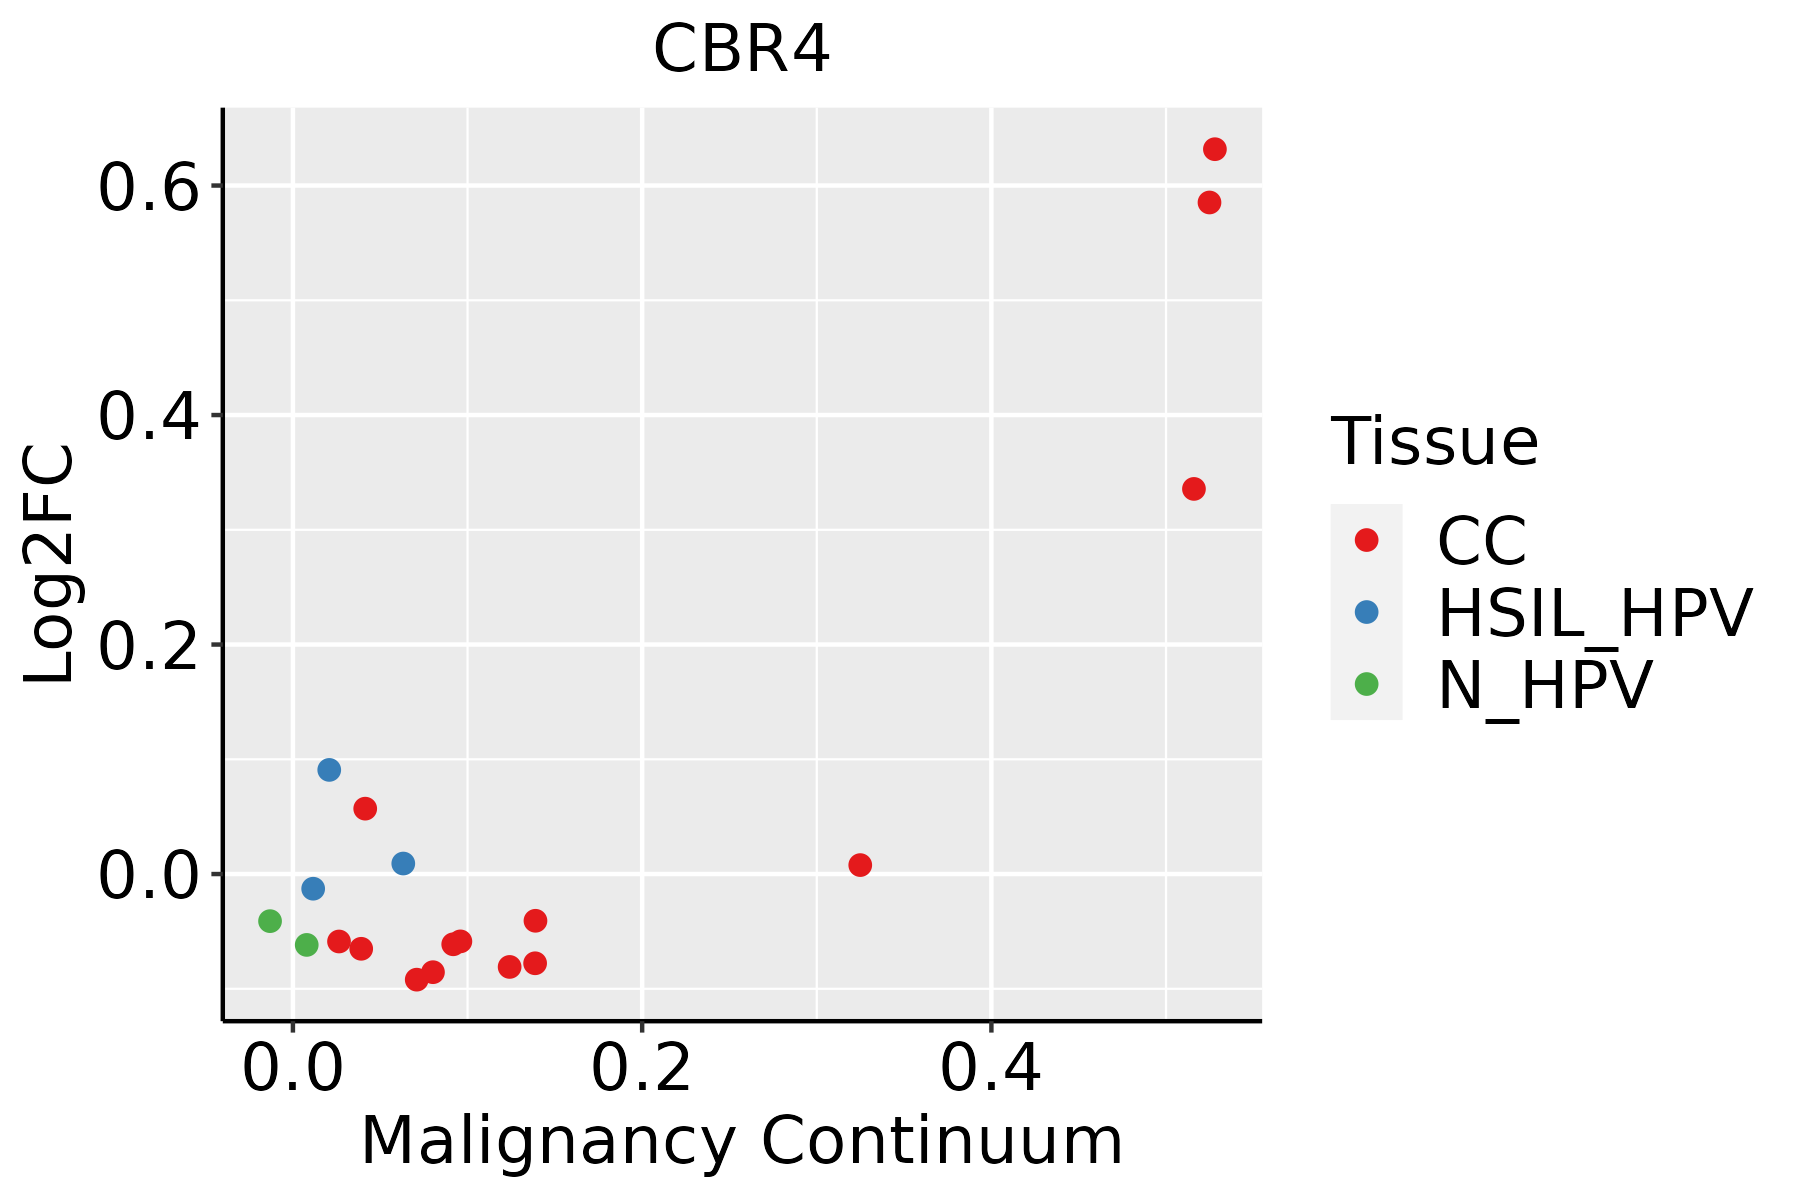 | CC: Cervix cancer |
| HSIL_HPV: HPV-infected high-grade squamous intraepithelial lesions | ||
| N_HPV: HPV-infected normal cervix | ||
| Esophagus | 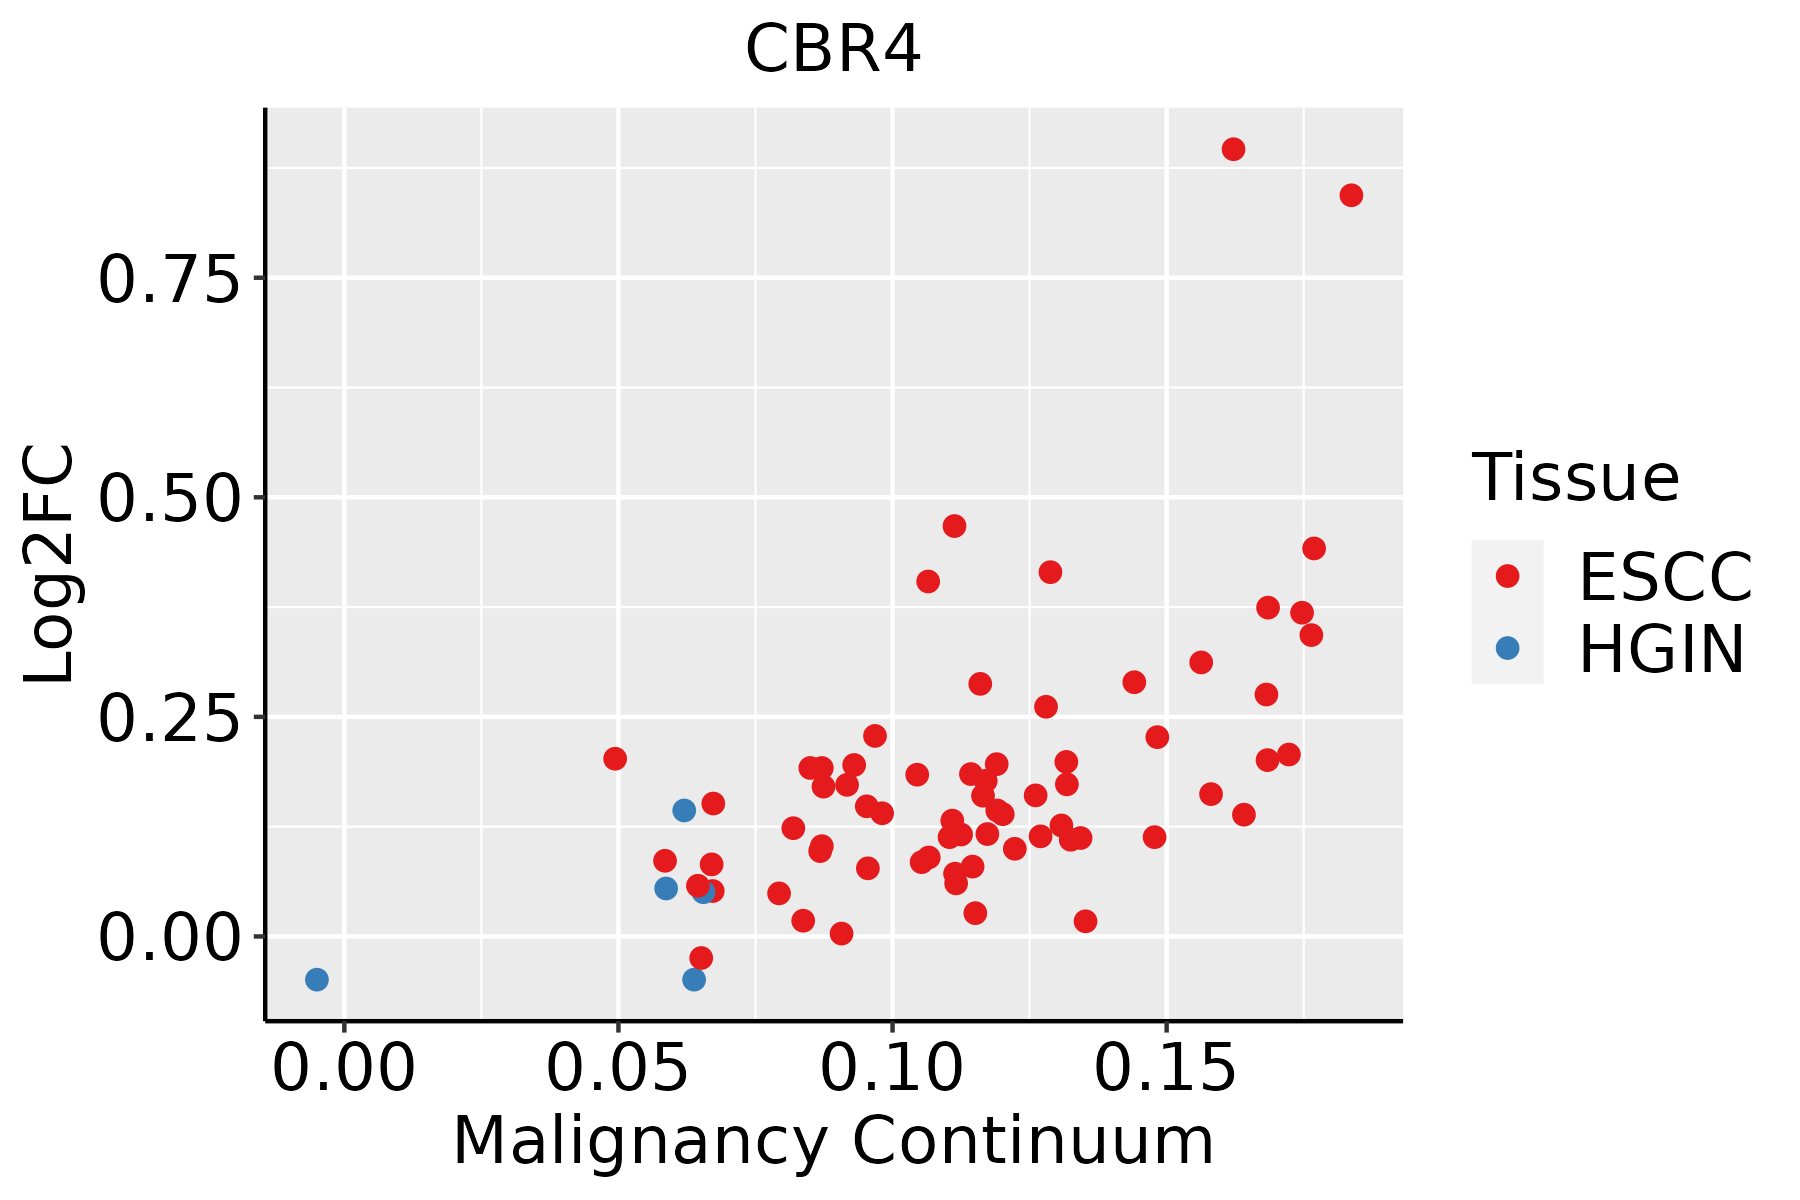 | ESCC: Esophageal squamous cell carcinoma |
| HGIN: High-grade intraepithelial neoplasias | ||
| LGIN: Low-grade intraepithelial neoplasias | ||
| Liver | 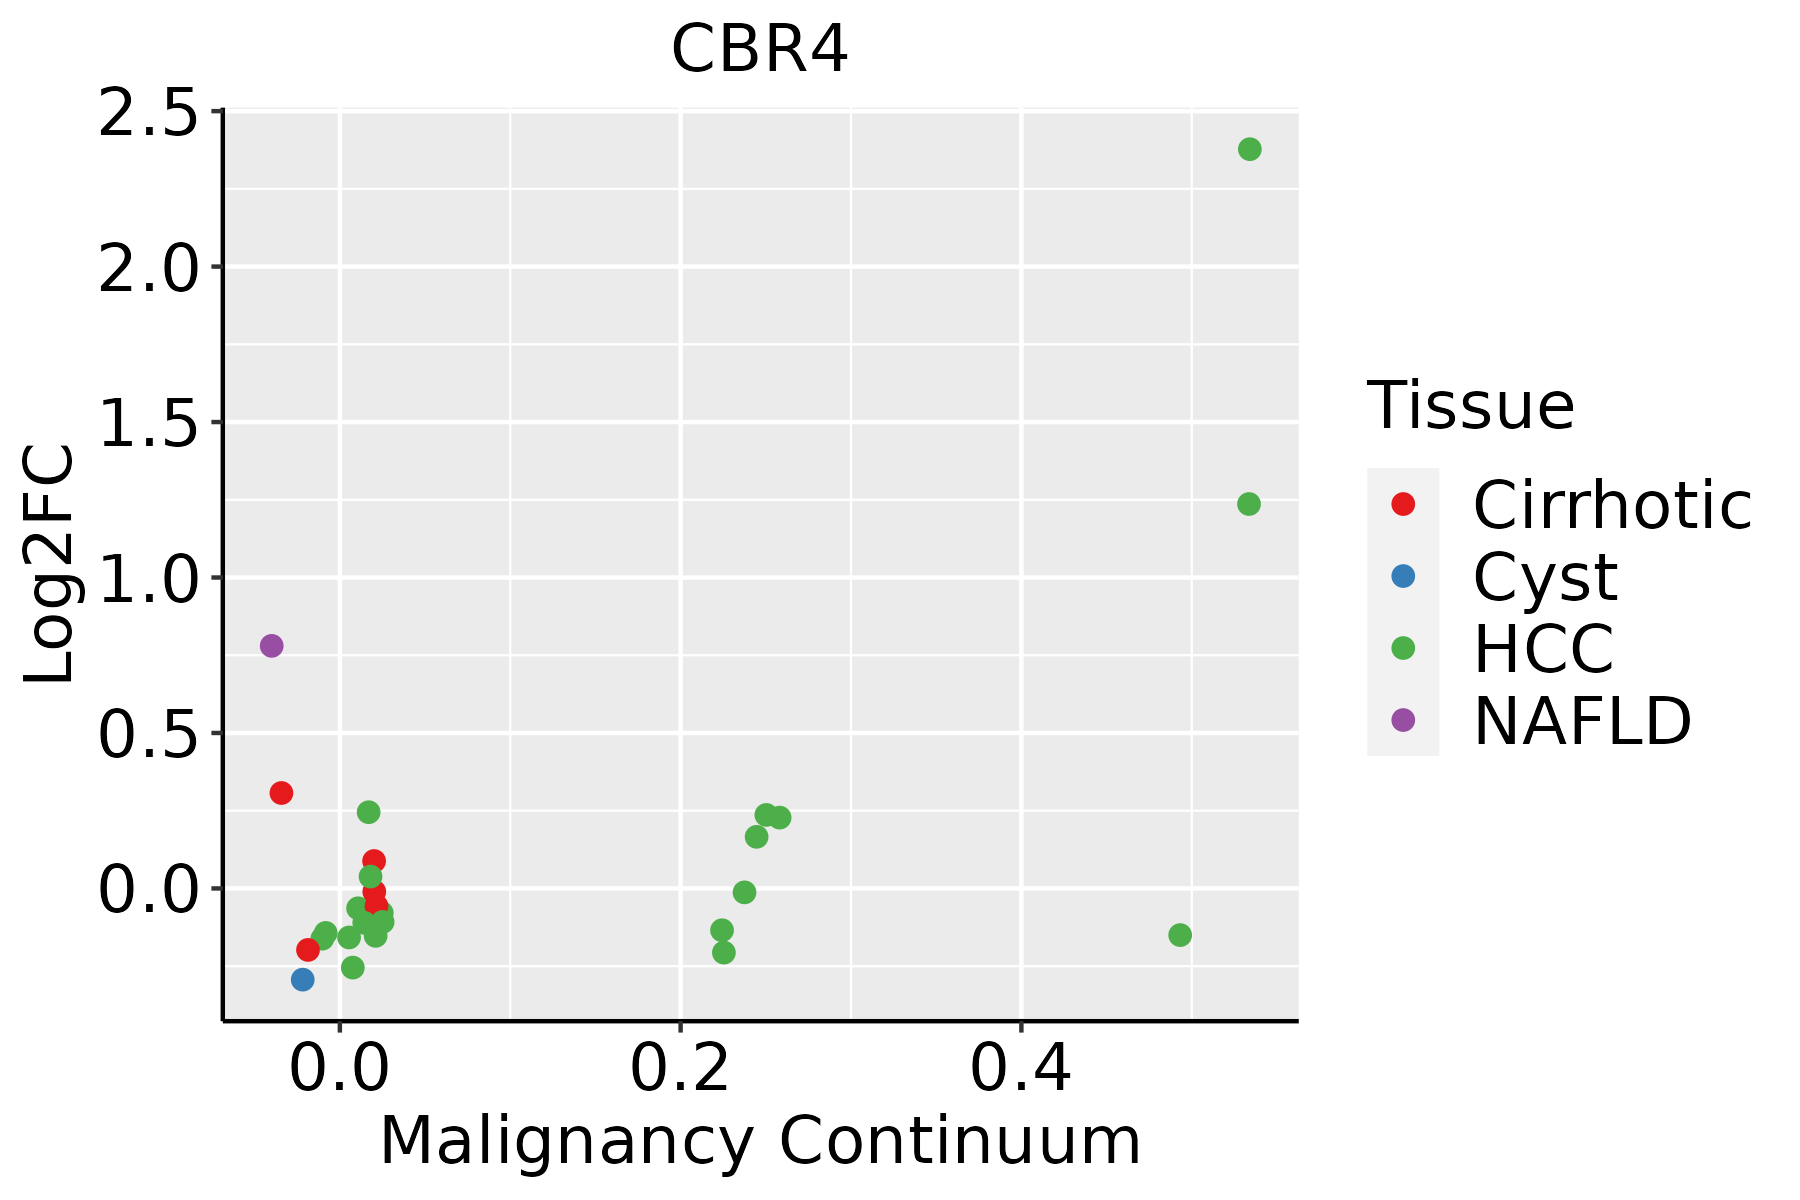 | HCC: Hepatocellular carcinoma |
| NAFLD: Non-alcoholic fatty liver disease | ||
| Oral Cavity | 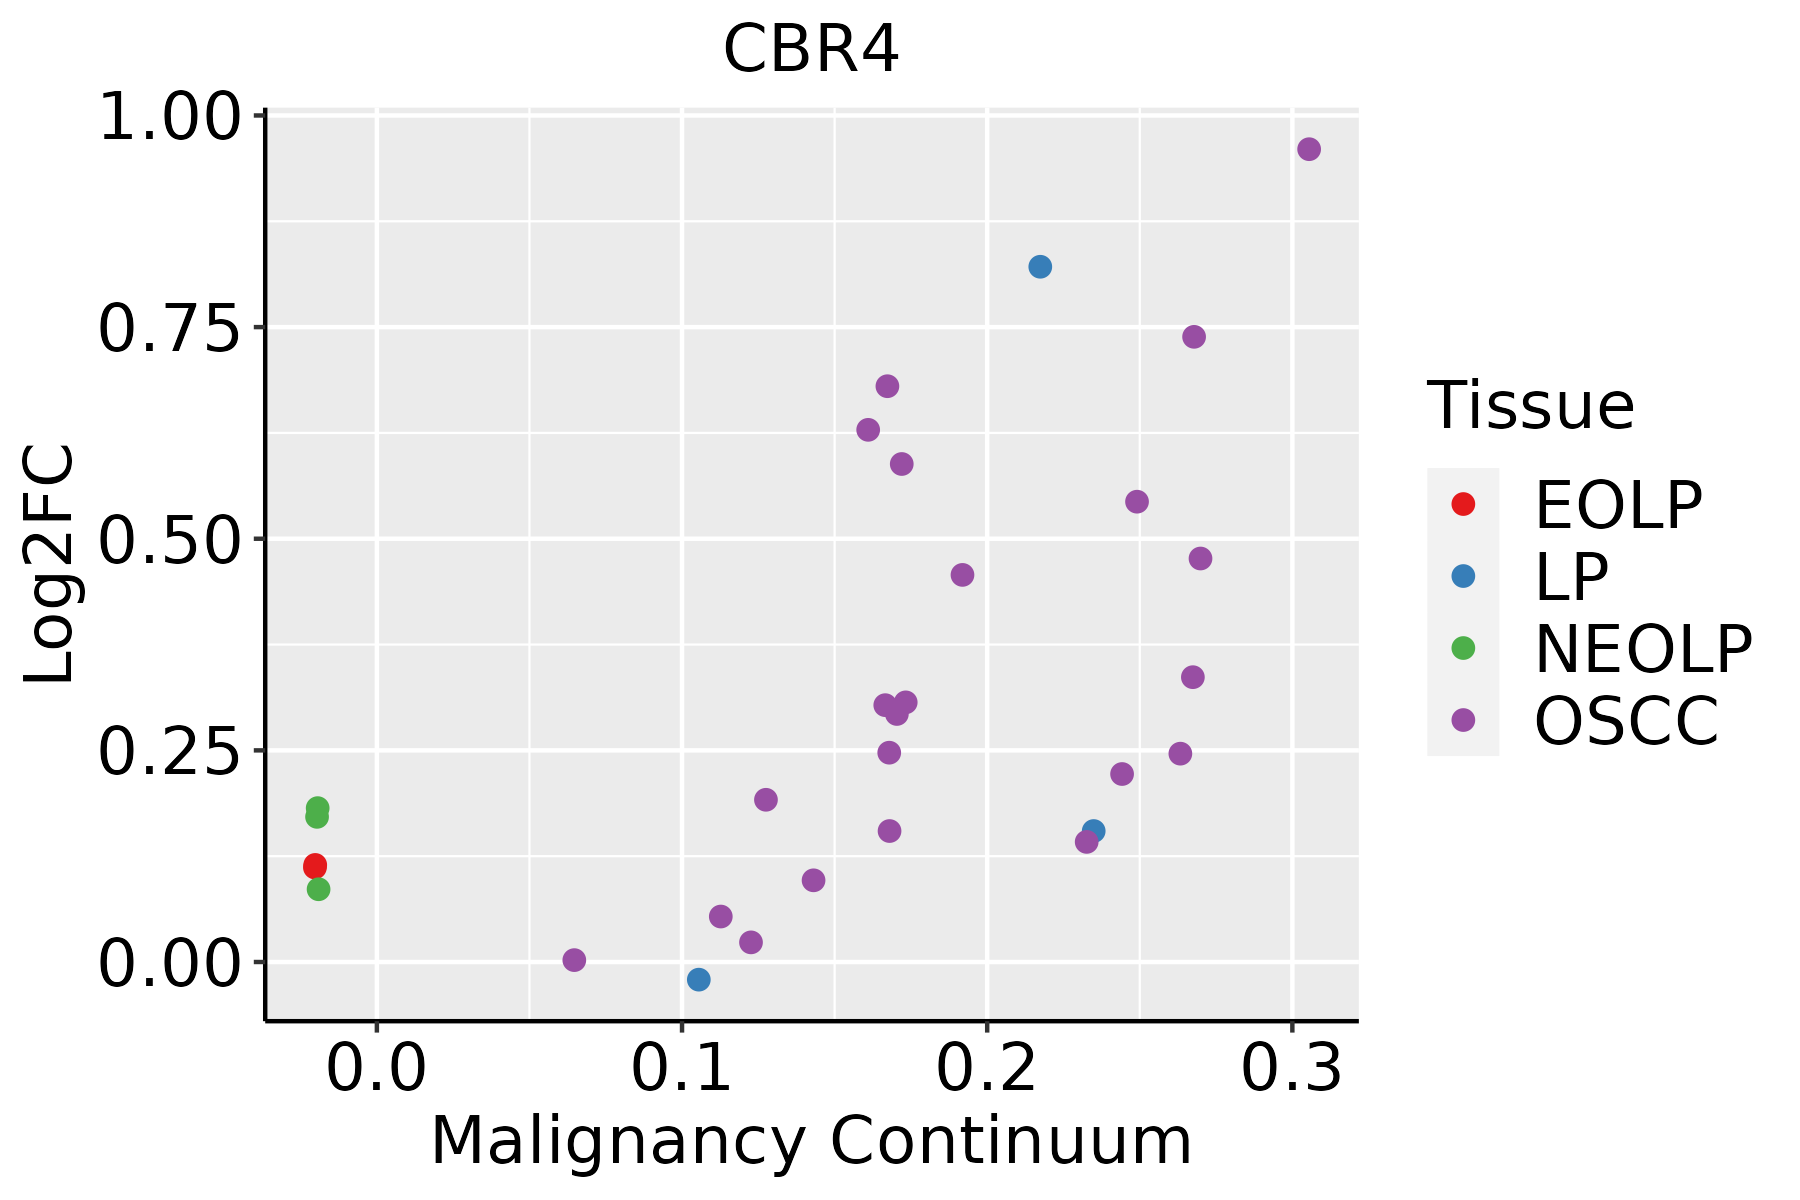 | EOLP: Erosive Oral lichen planus |
| LP: leukoplakia | ||
| NEOLP: Non-erosive oral lichen planus | ||
| OSCC: Oral squamous cell carcinoma | ||
| Prostate | 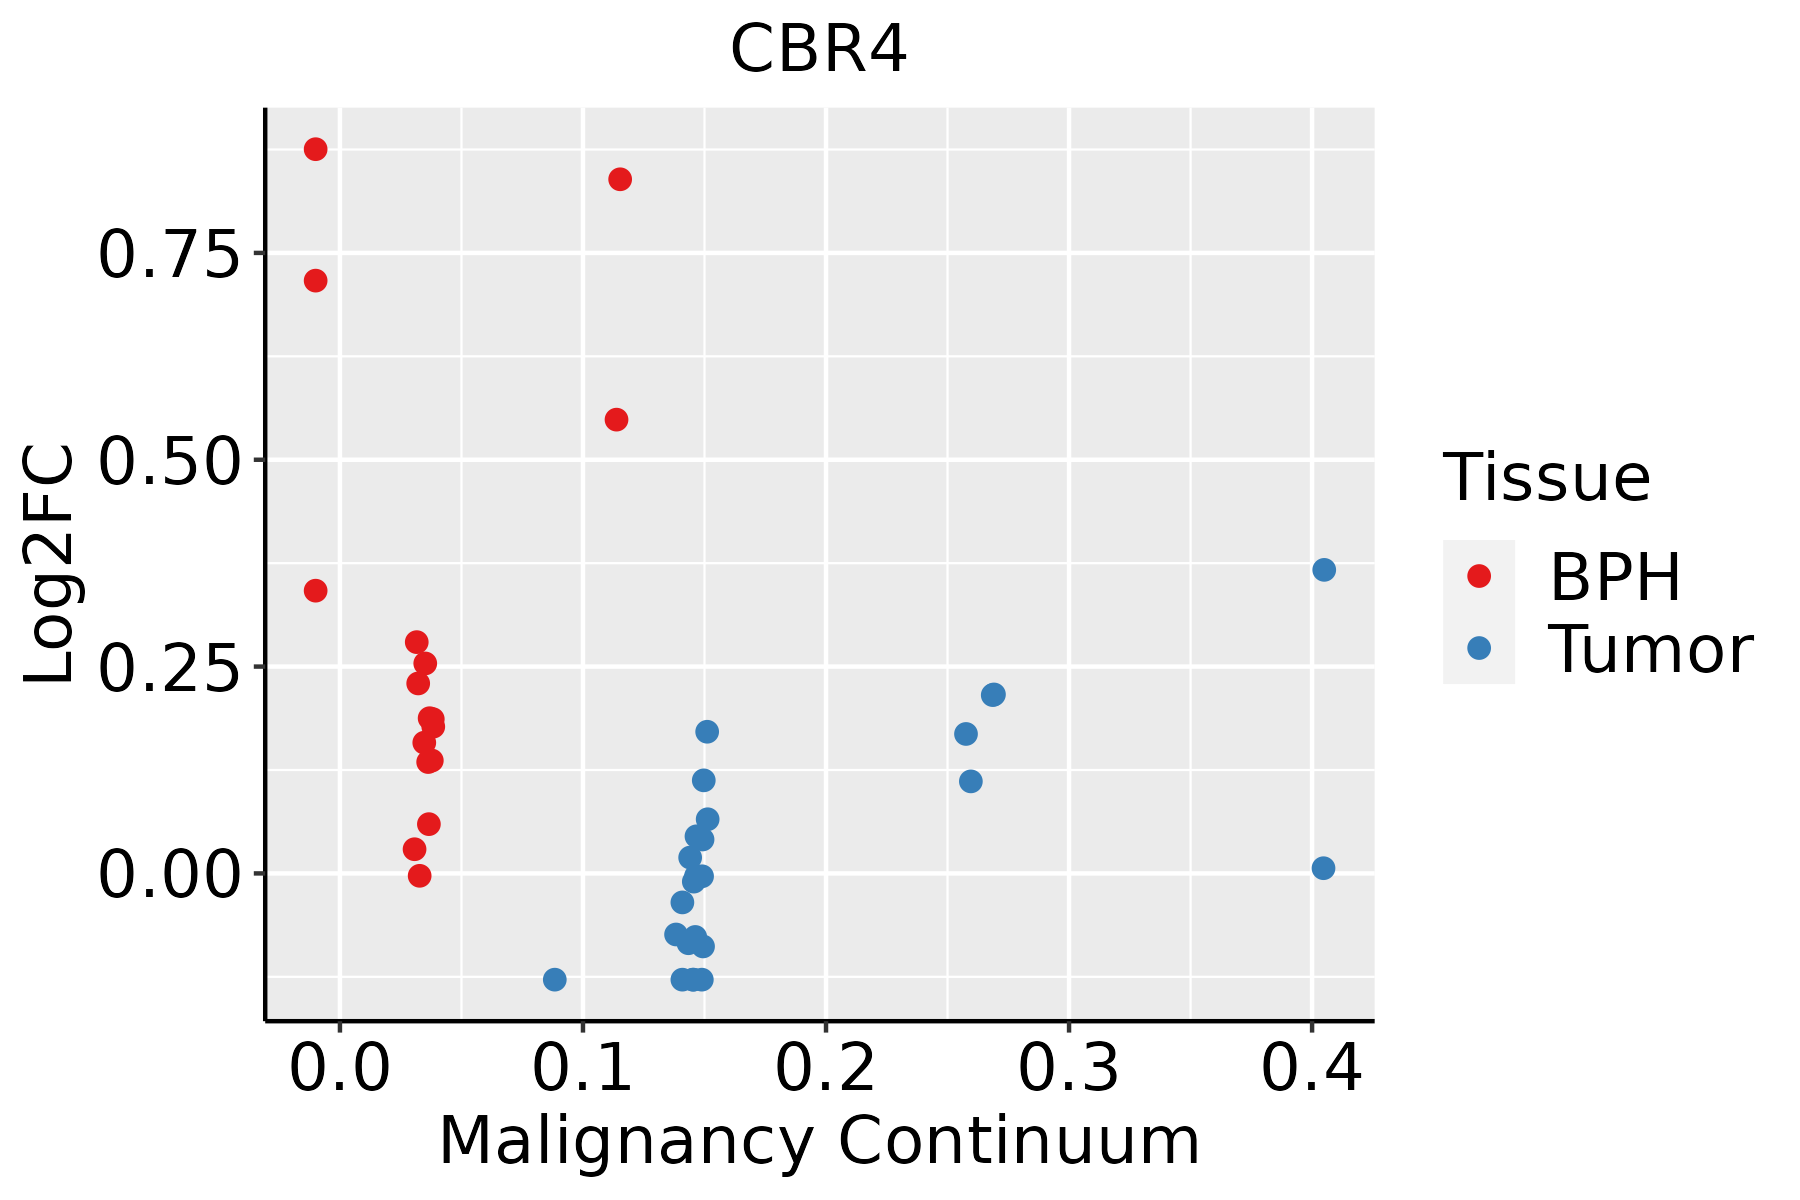 | BPH: Benign Prostatic Hyperplasia |
| Skin | 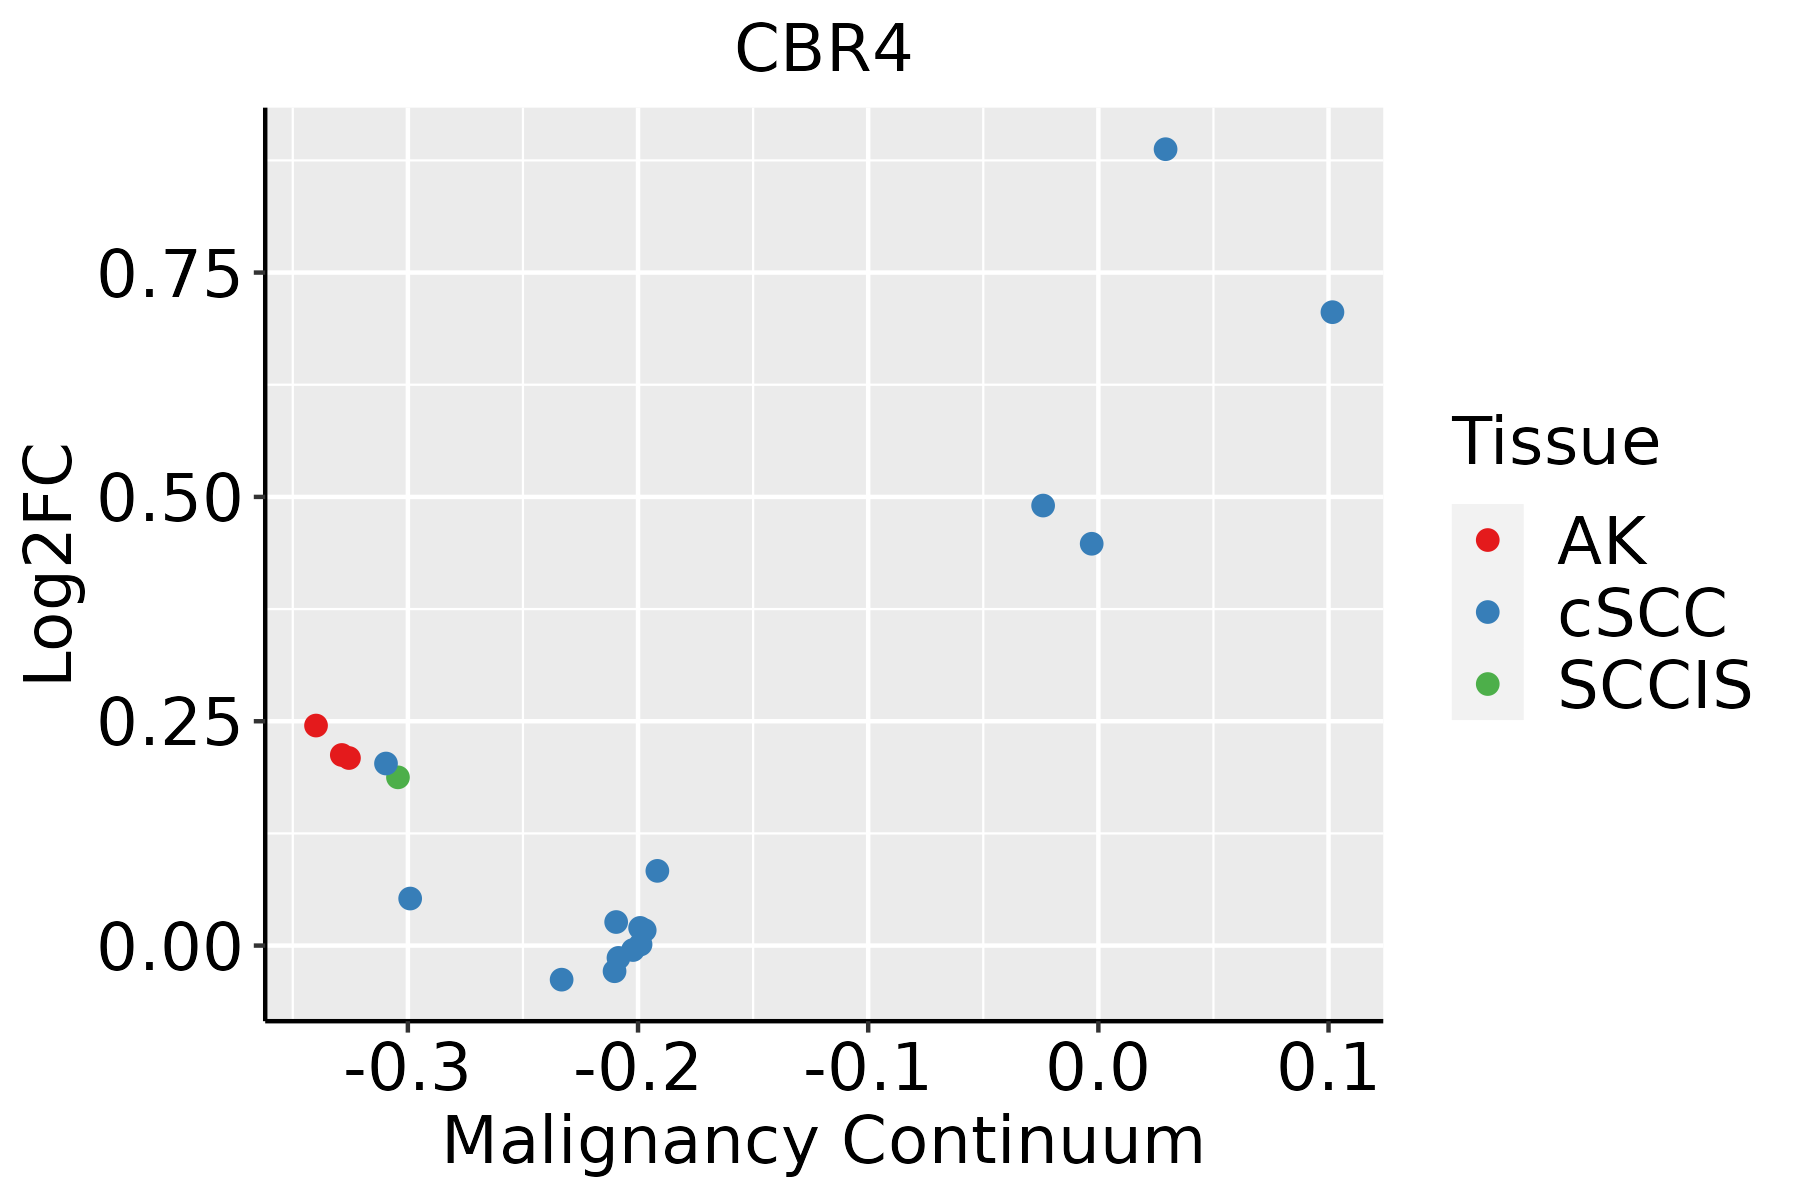 | AK: Actinic keratosis |
| cSCC: Cutaneous squamous cell carcinoma | ||
| SCCIS:squamous cell carcinoma in situ | ||
| Thyroid | 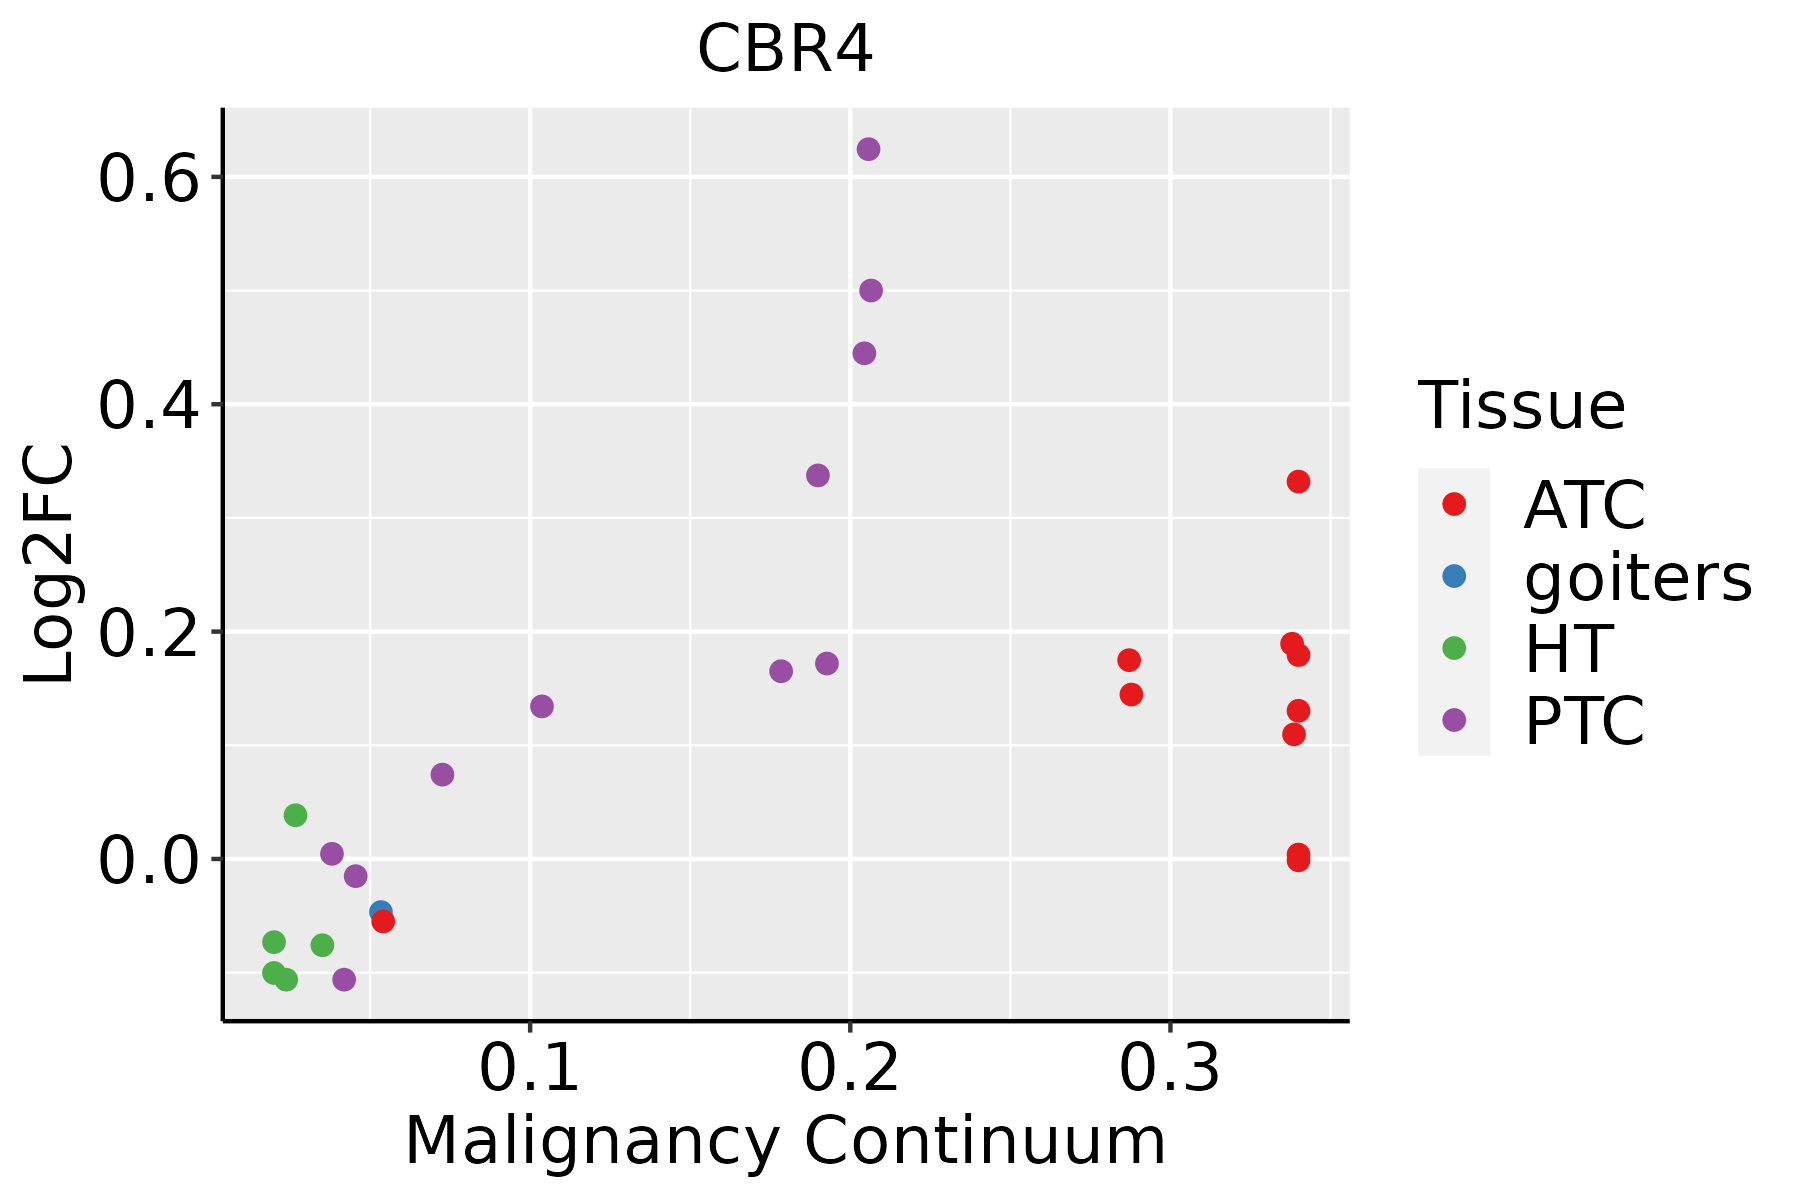 | ATC: Anaplastic thyroid cancer |
| HT: Hashimoto's thyroiditis | ||
| PTC: Papillary thyroid cancer |
| ∗log2FC in expression of this searched gene in stem-like cells from each diseased tissue sample relative to stem-like cells in normal samples in each tissue plotted against the malignancy continuum. Samples are colored based on if they are from different disease stage. |
Top |
Malignant transformation related pathway analysis |
| Find out the enriched GO biological processes and KEGG pathways involved in transition from healthy to precancer to cancer |
| Tissue | Disease Stage | Enriched GO biological Processes |
| Colorectum | AD |  |
| Colorectum | SER |  |
| Colorectum | MSS |  |
| Colorectum | MSI-H |  |
| Colorectum | FAP |  |
| ∗Top 15 enriched GO BP terms are showed in the bar plot of each disease state in each tissue. Each row represents a significant GO biological process which is colored according to the -log10(p.adjust). |
| Page: 1 2 3 4 5 6 7 8 9 |
| GO ID | Tissue | Disease Stage | Description | Gene Ratio | Bg Ratio | pvalue | p.adjust | Count |
| GO:190166112 | Esophagus | ESCC | quinone metabolic process | 34/8552 | 40/18723 | 3.00e-07 | 4.27e-06 | 34 |
| GO:00060668 | Esophagus | ESCC | alcohol metabolic process | 202/8552 | 353/18723 | 7.32e-06 | 7.26e-05 | 202 |
| GO:00066318 | Esophagus | ESCC | fatty acid metabolic process | 217/8552 | 390/18723 | 4.21e-05 | 3.39e-04 | 217 |
| GO:00463948 | Esophagus | ESCC | carboxylic acid biosynthetic process | 175/8552 | 314/18723 | 1.98e-04 | 1.26e-03 | 175 |
| GO:19016574 | Esophagus | ESCC | glycosyl compound metabolic process | 57/8552 | 88/18723 | 2.32e-04 | 1.44e-03 | 57 |
| GO:00160538 | Esophagus | ESCC | organic acid biosynthetic process | 175/8552 | 316/18723 | 3.04e-04 | 1.82e-03 | 175 |
| GO:00421805 | Esophagus | ESCC | cellular ketone metabolic process | 120/8552 | 211/18723 | 6.70e-04 | 3.55e-03 | 120 |
| GO:00512623 | Esophagus | ESCC | protein tetramerization | 54/8552 | 87/18723 | 1.50e-03 | 7.06e-03 | 54 |
| GO:00512592 | Esophagus | ESCC | protein complex oligomerization | 130/8552 | 238/18723 | 3.29e-03 | 1.36e-02 | 130 |
| GO:003063813 | Esophagus | ESCC | polyketide metabolic process | 9/8552 | 10/18723 | 5.09e-03 | 1.92e-02 | 9 |
| GO:004459813 | Esophagus | ESCC | doxorubicin metabolic process | 9/8552 | 10/18723 | 5.09e-03 | 1.92e-02 | 9 |
| GO:00161373 | Esophagus | ESCC | glycoside metabolic process | 16/8552 | 22/18723 | 9.46e-03 | 3.28e-02 | 16 |
| GO:00066316 | Liver | NAFLD | fatty acid metabolic process | 92/1882 | 390/18723 | 3.38e-15 | 3.29e-12 | 92 |
| GO:00160535 | Liver | NAFLD | organic acid biosynthetic process | 77/1882 | 316/18723 | 1.03e-13 | 6.69e-11 | 77 |
| GO:00463945 | Liver | NAFLD | carboxylic acid biosynthetic process | 75/1882 | 314/18723 | 6.37e-13 | 3.39e-10 | 75 |
| GO:00723303 | Liver | NAFLD | monocarboxylic acid biosynthetic process | 46/1882 | 214/18723 | 5.06e-07 | 3.07e-05 | 46 |
| GO:00060666 | Liver | NAFLD | alcohol metabolic process | 62/1882 | 353/18723 | 9.01e-06 | 2.96e-04 | 62 |
| GO:00066334 | Liver | NAFLD | fatty acid biosynthetic process | 29/1882 | 163/18723 | 1.67e-03 | 1.74e-02 | 29 |
| GO:00421803 | Liver | NAFLD | cellular ketone metabolic process | 35/1882 | 211/18723 | 2.09e-03 | 2.06e-02 | 35 |
| GO:000663112 | Liver | Cirrhotic | fatty acid metabolic process | 165/4634 | 390/18723 | 1.29e-14 | 1.26e-12 | 165 |
| Page: 1 2 3 4 5 |
| Pathway ID | Tissue | Disease Stage | Description | Gene Ratio | Bg Ratio | pvalue | p.adjust | qvalue | Count |
| hsa012129 | Esophagus | ESCC | Fatty acid metabolism | 41/4205 | 57/8465 | 5.13e-04 | 1.75e-03 | 8.98e-04 | 41 |
| hsa0121214 | Esophagus | ESCC | Fatty acid metabolism | 41/4205 | 57/8465 | 5.13e-04 | 1.75e-03 | 8.98e-04 | 41 |
| hsa012126 | Liver | NAFLD | Fatty acid metabolism | 17/1043 | 57/8465 | 3.43e-04 | 5.93e-03 | 4.78e-03 | 17 |
| hsa0121211 | Liver | NAFLD | Fatty acid metabolism | 17/1043 | 57/8465 | 3.43e-04 | 5.93e-03 | 4.78e-03 | 17 |
| hsa012122 | Liver | Cirrhotic | Fatty acid metabolism | 32/2530 | 57/8465 | 3.12e-05 | 2.47e-04 | 1.52e-04 | 32 |
| hsa012123 | Liver | Cirrhotic | Fatty acid metabolism | 32/2530 | 57/8465 | 3.12e-05 | 2.47e-04 | 1.52e-04 | 32 |
| hsa012124 | Liver | HCC | Fatty acid metabolism | 45/4020 | 57/8465 | 1.05e-06 | 1.10e-05 | 6.09e-06 | 45 |
| hsa00061 | Liver | HCC | Fatty acid biosynthesis | 14/4020 | 18/8465 | 8.82e-03 | 2.36e-02 | 1.32e-02 | 14 |
| hsa012125 | Liver | HCC | Fatty acid metabolism | 45/4020 | 57/8465 | 1.05e-06 | 1.10e-05 | 6.09e-06 | 45 |
| hsa000611 | Liver | HCC | Fatty acid biosynthesis | 14/4020 | 18/8465 | 8.82e-03 | 2.36e-02 | 1.32e-02 | 14 |
| hsa012128 | Oral cavity | OSCC | Fatty acid metabolism | 35/3704 | 57/8465 | 5.37e-03 | 1.29e-02 | 6.55e-03 | 35 |
| hsa0121213 | Oral cavity | OSCC | Fatty acid metabolism | 35/3704 | 57/8465 | 5.37e-03 | 1.29e-02 | 6.55e-03 | 35 |
| hsa0121221 | Prostate | Tumor | Fatty acid metabolism | 23/1791 | 57/8465 | 7.60e-04 | 3.59e-03 | 2.23e-03 | 23 |
| hsa0121231 | Prostate | Tumor | Fatty acid metabolism | 23/1791 | 57/8465 | 7.60e-04 | 3.59e-03 | 2.23e-03 | 23 |
| Page: 1 |
Top |
Cell-cell communication analysis |
| Identification of potential cell-cell interactions between two cell types and their ligand-receptor pairs for different disease states |
| Ligand | Receptor | LRpair | Pathway | Tissue | Disease Stage |
| Page: 1 |
Top |
Single-cell gene regulatory network inference analysis |
| Find out the significant the regulons (TFs) and the target genes of each regulon across cell types for different disease states |
| TF | Cell Type | Tissue | Disease Stage | Target Gene | RSS | Regulon Activity |
| ∗The dot plots of a searched regulon are shown for all cell subpopulations in each disease state of each tissue based on the regulon specific score inferred using pySCENIC and by calculating the average expression. |
| Page: 1 |
Top |
Somatic mutation of malignant transformation related genes |
| Annotation of somatic variants for genes involved in malignant transformation |
| Hugo Symbol | Variant Class | Variant Classification | dbSNP RS | HGVSc | HGVSp | HGVSp Short | SWISSPROT | BIOTYPE | SIFT | PolyPhen | Tumor Sample Barcode | Tissue | Histology | Sex | Age | Stage | Therapy Types | Drugs | Outcome |
| CBR4 | SNV | Missense_Mutation | novel | c.679N>G | p.Leu227Val | p.L227V | Q8N4T8 | protein_coding | deleterious(0.03) | possibly_damaging(0.614) | TCGA-JW-A5VL-01 | Cervix | cervical & endocervical cancer | Female | <65 | I/II | Unknown | Unknown | SD |
| CBR4 | SNV | Missense_Mutation | c.562N>A | p.Asp188Asn | p.D188N | Q8N4T8 | protein_coding | tolerated(0.48) | benign(0) | TCGA-AA-A00N-01 | Colorectum | colon adenocarcinoma | Male | >=65 | I/II | Unknown | Unknown | PD | |
| CBR4 | SNV | Missense_Mutation | c.275N>C | p.Leu92Ser | p.L92S | Q8N4T8 | protein_coding | deleterious(0.01) | probably_damaging(0.998) | TCGA-AZ-6605-01 | Colorectum | colon adenocarcinoma | Male | >=65 | III/IV | Chemotherapy | folfox | SD | |
| CBR4 | SNV | Missense_Mutation | novel | c.232N>C | p.Asn78His | p.N78H | Q8N4T8 | protein_coding | deleterious(0.03) | benign(0.068) | TCGA-CA-6717-01 | Colorectum | colon adenocarcinoma | Male | <65 | I/II | Chemotherapy | oxaliplatin | CR |
| CBR4 | SNV | Missense_Mutation | c.353N>T | p.Ala118Val | p.A118V | Q8N4T8 | protein_coding | tolerated(0.8) | benign(0.129) | TCGA-AG-A02N-01 | Colorectum | rectum adenocarcinoma | Male | >=65 | I/II | Chemotherapy | folinic | CR | |
| CBR4 | SNV | Missense_Mutation | novel | c.49G>T | p.Ala17Ser | p.A17S | Q8N4T8 | protein_coding | tolerated(0.06) | probably_damaging(0.913) | TCGA-A5-A0G1-01 | Endometrium | uterine corpus endometrioid carcinoma | Female | >=65 | I/II | Unknown | Unknown | SD |
| CBR4 | SNV | Missense_Mutation | novel | c.193A>C | p.Asn65His | p.N65H | Q8N4T8 | protein_coding | tolerated(0.13) | benign(0.001) | TCGA-EO-A22U-01 | Endometrium | uterine corpus endometrioid carcinoma | Female | >=65 | I/II | Unknown | Unknown | SD |
| CBR4 | SNV | Missense_Mutation | novel | c.35G>A | p.Arg12Gln | p.R12Q | Q8N4T8 | protein_coding | deleterious(0.02) | probably_damaging(0.996) | TCGA-EO-A22U-01 | Endometrium | uterine corpus endometrioid carcinoma | Female | >=65 | I/II | Unknown | Unknown | SD |
| CBR4 | SNV | Missense_Mutation | novel | c.481G>T | p.Ala161Ser | p.A161S | Q8N4T8 | protein_coding | tolerated(1) | benign(0.007) | TCGA-05-4397-01 | Lung | lung adenocarcinoma | Male | >=65 | I/II | Unknown | Unknown | SD |
| CBR4 | SNV | Missense_Mutation | c.535N>A | p.Gly179Arg | p.G179R | Q8N4T8 | protein_coding | deleterious(0) | probably_damaging(0.979) | TCGA-J2-8194-01 | Lung | lung adenocarcinoma | Female | >=65 | I/II | Chemotherapy | carboplatin | PD |
| Page: 1 2 |
Top |
Related drugs of malignant transformation related genes |
| Identification of chemicals and drugs interact with genes involved in malignant transfromation |
| (DGIdb 4.0) |
| Entrez ID | Symbol | Category | Interaction Types | Drug Claim Name | Drug Name | PMIDs |
| Page: 1 |

Copyright 2023-Present -The University of Texas Health Science Center at Houston |