
|
|||||
|
 | |
| |
| |
| |
| |
| |
|
Gene: CBR3 |
Gene summary for CBR3 |
| Gene information | Species | Human | Gene symbol | CBR3 | Gene ID | 874 |
| Gene name | carbonyl reductase 3 | |
| Gene Alias | HEL-S-25 | |
| Cytomap | 21q22.12 | |
| Gene Type | protein-coding | GO ID | GO:0003008 | UniProtAcc | O75828 |
Top |
Malignant transformation analysis |
| Identification of the aberrant gene expression in precancerous and cancerous lesions by comparing the gene expression of stem-like cells in diseased tissues with normal stem cells |
| Entrez ID | Symbol | Replicates | Species | Organ | Tissue | Adj P-value | Log2FC | Malignancy |
| 874 | CBR3 | LZE4T | Human | Esophagus | ESCC | 6.30e-21 | 1.01e+00 | 0.0811 |
| 874 | CBR3 | LZE7T | Human | Esophagus | ESCC | 5.17e-11 | 1.09e+00 | 0.0667 |
| 874 | CBR3 | LZE8T | Human | Esophagus | ESCC | 9.65e-03 | -5.52e-02 | 0.067 |
| 874 | CBR3 | LZE20T | Human | Esophagus | ESCC | 5.62e-04 | 3.12e-01 | 0.0662 |
| 874 | CBR3 | LZE21D1 | Human | Esophagus | HGIN | 4.97e-13 | 1.67e+00 | 0.0632 |
| 874 | CBR3 | LZE22D1 | Human | Esophagus | HGIN | 1.07e-05 | 5.66e-01 | 0.0595 |
| 874 | CBR3 | LZE22T | Human | Esophagus | ESCC | 4.45e-06 | 9.11e-01 | 0.068 |
| 874 | CBR3 | LZE24T | Human | Esophagus | ESCC | 4.63e-08 | 4.61e-01 | 0.0596 |
| 874 | CBR3 | LZE22D3 | Human | Esophagus | HGIN | 6.52e-03 | 9.11e-01 | 0.0653 |
| 874 | CBR3 | LZE21T | Human | Esophagus | ESCC | 5.36e-09 | 7.11e-01 | 0.0655 |
| 874 | CBR3 | P1T-E | Human | Esophagus | ESCC | 5.71e-23 | 2.16e+00 | 0.0875 |
| 874 | CBR3 | P2T-E | Human | Esophagus | ESCC | 1.19e-07 | 2.55e-01 | 0.1177 |
| 874 | CBR3 | P4T-E | Human | Esophagus | ESCC | 4.32e-47 | 1.39e+00 | 0.1323 |
| 874 | CBR3 | P5T-E | Human | Esophagus | ESCC | 2.15e-13 | 3.72e-01 | 0.1327 |
| 874 | CBR3 | P8T-E | Human | Esophagus | ESCC | 7.88e-03 | 2.13e-01 | 0.0889 |
| 874 | CBR3 | P9T-E | Human | Esophagus | ESCC | 1.06e-73 | 1.93e+00 | 0.1131 |
| 874 | CBR3 | P10T-E | Human | Esophagus | ESCC | 4.67e-12 | 3.30e-01 | 0.116 |
| 874 | CBR3 | P11T-E | Human | Esophagus | ESCC | 1.67e-07 | 5.49e-01 | 0.1426 |
| 874 | CBR3 | P12T-E | Human | Esophagus | ESCC | 3.20e-07 | 3.74e-01 | 0.1122 |
| 874 | CBR3 | P15T-E | Human | Esophagus | ESCC | 3.79e-19 | 5.10e-01 | 0.1149 |
| Page: 1 2 3 4 5 |
| Tissue | Expression Dynamics | Abbreviation |
| Esophagus |  | ESCC: Esophageal squamous cell carcinoma |
| HGIN: High-grade intraepithelial neoplasias | ||
| LGIN: Low-grade intraepithelial neoplasias | ||
| Oral Cavity | 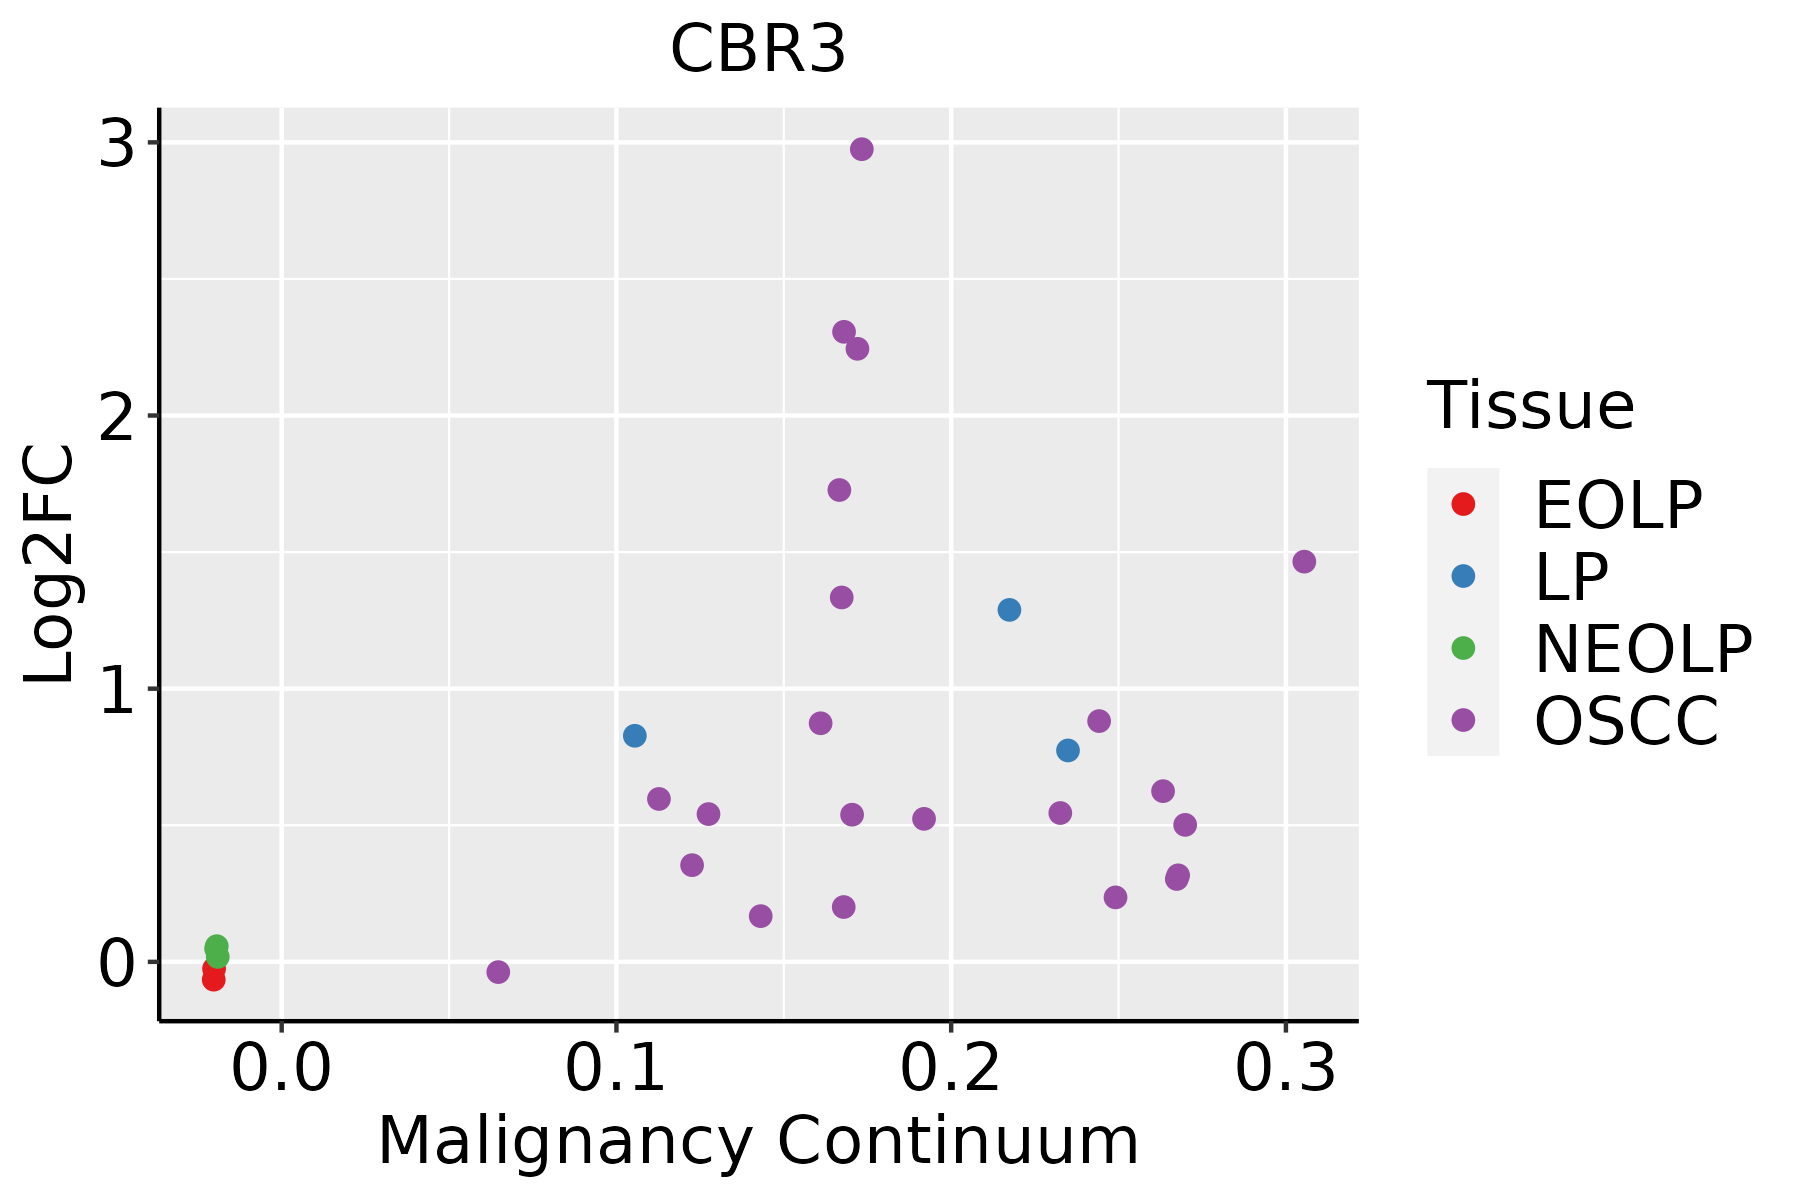 | EOLP: Erosive Oral lichen planus |
| LP: leukoplakia | ||
| NEOLP: Non-erosive oral lichen planus | ||
| OSCC: Oral squamous cell carcinoma | ||
| Skin |  | AK: Actinic keratosis |
| cSCC: Cutaneous squamous cell carcinoma | ||
| SCCIS:squamous cell carcinoma in situ |
| ∗log2FC in expression of this searched gene in stem-like cells from each diseased tissue sample relative to stem-like cells in normal samples in each tissue plotted against the malignancy continuum. Samples are colored based on if they are from different disease stage. |
Top |
Malignant transformation related pathway analysis |
| Find out the enriched GO biological processes and KEGG pathways involved in transition from healthy to precancer to cancer |
| Tissue | Disease Stage | Enriched GO biological Processes |
| Colorectum | AD |  |
| Colorectum | SER |  |
| Colorectum | MSS |  |
| Colorectum | MSI-H |  |
| Colorectum | FAP |  |
| ∗Top 15 enriched GO BP terms are showed in the bar plot of each disease state in each tissue. Each row represents a significant GO biological process which is colored according to the -log10(p.adjust). |
| Page: 1 2 3 4 5 6 7 8 9 |
| GO ID | Tissue | Disease Stage | Description | Gene Ratio | Bg Ratio | pvalue | p.adjust | Count |
| GO:19016614 | Esophagus | HGIN | quinone metabolic process | 13/2587 | 40/18723 | 2.04e-03 | 2.13e-02 | 13 |
| GO:190166112 | Esophagus | ESCC | quinone metabolic process | 34/8552 | 40/18723 | 3.00e-07 | 4.27e-06 | 34 |
| GO:000941020 | Esophagus | ESCC | response to xenobiotic stimulus | 253/8552 | 462/18723 | 4.55e-05 | 3.58e-04 | 253 |
| GO:00067661 | Esophagus | ESCC | vitamin metabolic process | 67/8552 | 106/18723 | 2.03e-04 | 1.28e-03 | 67 |
| GO:00421805 | Esophagus | ESCC | cellular ketone metabolic process | 120/8552 | 211/18723 | 6.70e-04 | 3.55e-03 | 120 |
| GO:00442827 | Esophagus | ESCC | small molecule catabolic process | 201/8552 | 376/18723 | 1.35e-03 | 6.41e-03 | 201 |
| GO:19016613 | Oral cavity | OSCC | quinone metabolic process | 32/7305 | 40/18723 | 1.40e-07 | 2.34e-06 | 32 |
| GO:00421804 | Oral cavity | OSCC | cellular ketone metabolic process | 111/7305 | 211/18723 | 3.94e-05 | 3.45e-04 | 111 |
| GO:000941018 | Oral cavity | OSCC | response to xenobiotic stimulus | 222/7305 | 462/18723 | 4.00e-05 | 3.48e-04 | 222 |
| GO:00442826 | Oral cavity | OSCC | small molecule catabolic process | 174/7305 | 376/18723 | 2.25e-03 | 1.00e-02 | 174 |
| GO:190166111 | Oral cavity | LP | quinone metabolic process | 24/4623 | 40/18723 | 2.17e-06 | 4.85e-05 | 24 |
| GO:000941019 | Oral cavity | LP | response to xenobiotic stimulus | 141/4623 | 462/18723 | 2.33e-03 | 1.68e-02 | 141 |
| GO:004218012 | Oral cavity | LP | cellular ketone metabolic process | 70/4623 | 211/18723 | 3.29e-03 | 2.21e-02 | 70 |
| GO:0009410110 | Skin | cSCC | response to xenobiotic stimulus | 151/4864 | 462/18723 | 6.76e-04 | 4.82e-03 | 151 |
| GO:19016615 | Skin | cSCC | quinone metabolic process | 18/4864 | 40/18723 | 7.10e-03 | 3.40e-02 | 18 |
| Page: 1 |
| Pathway ID | Tissue | Disease Stage | Description | Gene Ratio | Bg Ratio | pvalue | p.adjust | qvalue | Count |
| Page: 1 |
Top |
Cell-cell communication analysis |
| Identification of potential cell-cell interactions between two cell types and their ligand-receptor pairs for different disease states |
| Ligand | Receptor | LRpair | Pathway | Tissue | Disease Stage |
| Page: 1 |
Top |
Single-cell gene regulatory network inference analysis |
| Find out the significant the regulons (TFs) and the target genes of each regulon across cell types for different disease states |
| TF | Cell Type | Tissue | Disease Stage | Target Gene | RSS | Regulon Activity |
| ∗The dot plots of a searched regulon are shown for all cell subpopulations in each disease state of each tissue based on the regulon specific score inferred using pySCENIC and by calculating the average expression. |
| Page: 1 |
Top |
Somatic mutation of malignant transformation related genes |
| Annotation of somatic variants for genes involved in malignant transformation |
| Hugo Symbol | Variant Class | Variant Classification | dbSNP RS | HGVSc | HGVSp | HGVSp Short | SWISSPROT | BIOTYPE | SIFT | PolyPhen | Tumor Sample Barcode | Tissue | Histology | Sex | Age | Stage | Therapy Types | Drugs | Outcome |
| CBR3 | SNV | Missense_Mutation | novel | c.51N>G | p.Ile17Met | p.I17M | O75828 | protein_coding | deleterious(0) | probably_damaging(0.959) | TCGA-C5-A2LZ-01 | Cervix | cervical & endocervical cancer | Female | >=65 | III/IV | Unknown | Unknown | PD |
| CBR3 | SNV | Missense_Mutation | novel | c.125N>A | p.Arg42Gln | p.R42Q | O75828 | protein_coding | tolerated(0.05) | benign(0.387) | TCGA-MA-AA3Y-01 | Cervix | cervical & endocervical cancer | Female | <65 | I/II | Unknown | Unknown | SD |
| CBR3 | SNV | Missense_Mutation | c.196N>A | p.Asp66Asn | p.D66N | O75828 | protein_coding | tolerated(0.12) | benign(0.087) | TCGA-CK-4951-01 | Colorectum | colon adenocarcinoma | Female | >=65 | I/II | Unknown | Unknown | PD | |
| CBR3 | deletion | Frame_Shift_Del | c.249delG | p.Leu84SerfsTer26 | p.L84Sfs*26 | O75828 | protein_coding | TCGA-A6-3809-01 | Colorectum | colon adenocarcinoma | Female | >=65 | I/II | Unknown | Unknown | SD | |||
| CBR3 | deletion | Frame_Shift_Del | c.342delN | p.Phe116LeufsTer13 | p.F116Lfs*13 | O75828 | protein_coding | TCGA-AA-3949-01 | Colorectum | colon adenocarcinoma | Female | >=65 | III/IV | Unknown | Unknown | SD | |||
| CBR3 | SNV | Missense_Mutation | novel | c.473N>G | p.Phe158Cys | p.F158C | O75828 | protein_coding | deleterious(0) | probably_damaging(0.972) | TCGA-A5-A0G1-01 | Endometrium | uterine corpus endometrioid carcinoma | Female | >=65 | I/II | Unknown | Unknown | SD |
| CBR3 | SNV | Missense_Mutation | rs369768555 | c.401G>T | p.Arg134Ile | p.R134I | O75828 | protein_coding | deleterious(0) | probably_damaging(0.999) | TCGA-AX-A0J0-01 | Endometrium | uterine corpus endometrioid carcinoma | Female | <65 | I/II | Unknown | Unknown | SD |
| CBR3 | SNV | Missense_Mutation | novel | c.820N>A | p.Val274Met | p.V274M | O75828 | protein_coding | deleterious(0) | possibly_damaging(0.65) | TCGA-AX-A3G9-01 | Endometrium | uterine corpus endometrioid carcinoma | Female | <65 | III/IV | Chemotherapy | carboplatin | SD |
| CBR3 | SNV | Missense_Mutation | novel | c.821N>C | p.Val274Ala | p.V274A | O75828 | protein_coding | deleterious(0.02) | benign(0.386) | TCGA-B5-A1MX-01 | Endometrium | uterine corpus endometrioid carcinoma | Female | <65 | I/II | Hormone Therapy | megace | SD |
| CBR3 | SNV | Missense_Mutation | novel | c.398N>A | p.Gly133Glu | p.G133E | O75828 | protein_coding | deleterious(0) | probably_damaging(1) | TCGA-EY-A549-01 | Endometrium | uterine corpus endometrioid carcinoma | Female | >=65 | I/II | Unknown | Unknown | SD |
| Page: 1 2 |
Top |
Related drugs of malignant transformation related genes |
| Identification of chemicals and drugs interact with genes involved in malignant transfromation |
| (DGIdb 4.0) |
| Entrez ID | Symbol | Category | Interaction Types | Drug Claim Name | Drug Name | PMIDs |
| 874 | CBR3 | ENZYME, DRUGGABLE GENOME, SHORT CHAIN DEHYDROGENASE REDUCTASE, CLINICALLY ACTIONABLE | daunorubicin | DAUNORUBICIN | 20007405 | |
| 874 | CBR3 | ENZYME, DRUGGABLE GENOME, SHORT CHAIN DEHYDROGENASE REDUCTASE, CLINICALLY ACTIONABLE | cyclophosphamide | CYCLOPHOSPHAMIDE | ||
| 874 | CBR3 | ENZYME, DRUGGABLE GENOME, SHORT CHAIN DEHYDROGENASE REDUCTASE, CLINICALLY ACTIONABLE | epirubicin | EPIRUBICIN | ||
| 874 | CBR3 | ENZYME, DRUGGABLE GENOME, SHORT CHAIN DEHYDROGENASE REDUCTASE, CLINICALLY ACTIONABLE | doxorubicin | DOXORUBICIN | 20007405,21048526,18551042 | |
| 874 | CBR3 | ENZYME, DRUGGABLE GENOME, SHORT CHAIN DEHYDROGENASE REDUCTASE, CLINICALLY ACTIONABLE | fluorouracil | FLUOROURACIL | ||
| 874 | CBR3 | ENZYME, DRUGGABLE GENOME, SHORT CHAIN DEHYDROGENASE REDUCTASE, CLINICALLY ACTIONABLE | anthracyclines and related substances | 18457324 |
| Page: 1 |

Copyright 2023-Present -The University of Texas Health Science Center at Houston |