
|
|||||
|
 | |
| |
| |
| |
| |
| |
|
Gene: CBR1 |
Gene summary for CBR1 |
| Gene information | Species | Human | Gene symbol | CBR1 | Gene ID | 873 |
| Gene name | carbonyl reductase 1 | |
| Gene Alias | CBR | |
| Cytomap | 21q22.12 | |
| Gene Type | protein-coding | GO ID | GO:0001516 | UniProtAcc | P16152 |
Top |
Malignant transformation analysis |
| Identification of the aberrant gene expression in precancerous and cancerous lesions by comparing the gene expression of stem-like cells in diseased tissues with normal stem cells |
| Entrez ID | Symbol | Replicates | Species | Organ | Tissue | Adj P-value | Log2FC | Malignancy |
| 873 | CBR1 | CA_HPV_1 | Human | Cervix | CC | 1.08e-08 | -2.84e-01 | 0.0264 |
| 873 | CBR1 | CA_HPV_3 | Human | Cervix | CC | 3.81e-15 | 5.17e-01 | 0.0414 |
| 873 | CBR1 | CCI_1 | Human | Cervix | CC | 2.26e-03 | -4.83e-01 | 0.528 |
| 873 | CBR1 | CCI_3 | Human | Cervix | CC | 3.19e-02 | -4.17e-01 | 0.516 |
| 873 | CBR1 | CCII_1 | Human | Cervix | CC | 1.82e-13 | -5.24e-01 | 0.3249 |
| 873 | CBR1 | L1 | Human | Cervix | CC | 1.31e-03 | -2.74e-01 | 0.0802 |
| 873 | CBR1 | HTA11_3410_2000001011 | Human | Colorectum | AD | 4.94e-02 | 7.17e-02 | 0.0155 |
| 873 | CBR1 | HTA11_2487_2000001011 | Human | Colorectum | SER | 2.00e-09 | 4.19e-01 | -0.1808 |
| 873 | CBR1 | HTA11_1938_2000001011 | Human | Colorectum | AD | 2.64e-09 | 4.82e-01 | -0.0811 |
| 873 | CBR1 | HTA11_78_2000001011 | Human | Colorectum | AD | 2.49e-09 | 4.14e-01 | -0.1088 |
| 873 | CBR1 | HTA11_347_2000001011 | Human | Colorectum | AD | 1.07e-23 | 5.73e-01 | -0.1954 |
| 873 | CBR1 | HTA11_3361_2000001011 | Human | Colorectum | AD | 2.78e-05 | 3.56e-01 | -0.1207 |
| 873 | CBR1 | HTA11_83_2000001011 | Human | Colorectum | SER | 8.56e-07 | 4.92e-01 | -0.1526 |
| 873 | CBR1 | HTA11_696_2000001011 | Human | Colorectum | AD | 8.86e-10 | 2.99e-01 | -0.1464 |
| 873 | CBR1 | HTA11_1391_2000001011 | Human | Colorectum | AD | 7.41e-15 | 5.62e-01 | -0.059 |
| 873 | CBR1 | HTA11_2992_2000001011 | Human | Colorectum | SER | 2.00e-03 | 4.34e-01 | -0.1706 |
| 873 | CBR1 | HTA11_866_3004761011 | Human | Colorectum | AD | 1.27e-08 | 2.73e-01 | 0.096 |
| 873 | CBR1 | HTA11_4255_2000001011 | Human | Colorectum | SER | 4.32e-02 | 3.17e-01 | 0.0446 |
| 873 | CBR1 | HTA11_8622_2000001021 | Human | Colorectum | SER | 6.48e-05 | 4.20e-01 | 0.0528 |
| 873 | CBR1 | HTA11_6801_2000001011 | Human | Colorectum | SER | 6.03e-03 | 5.25e-01 | 0.0171 |
| Page: 1 2 3 4 5 6 7 8 9 |
| Tissue | Expression Dynamics | Abbreviation |
| Cervix | 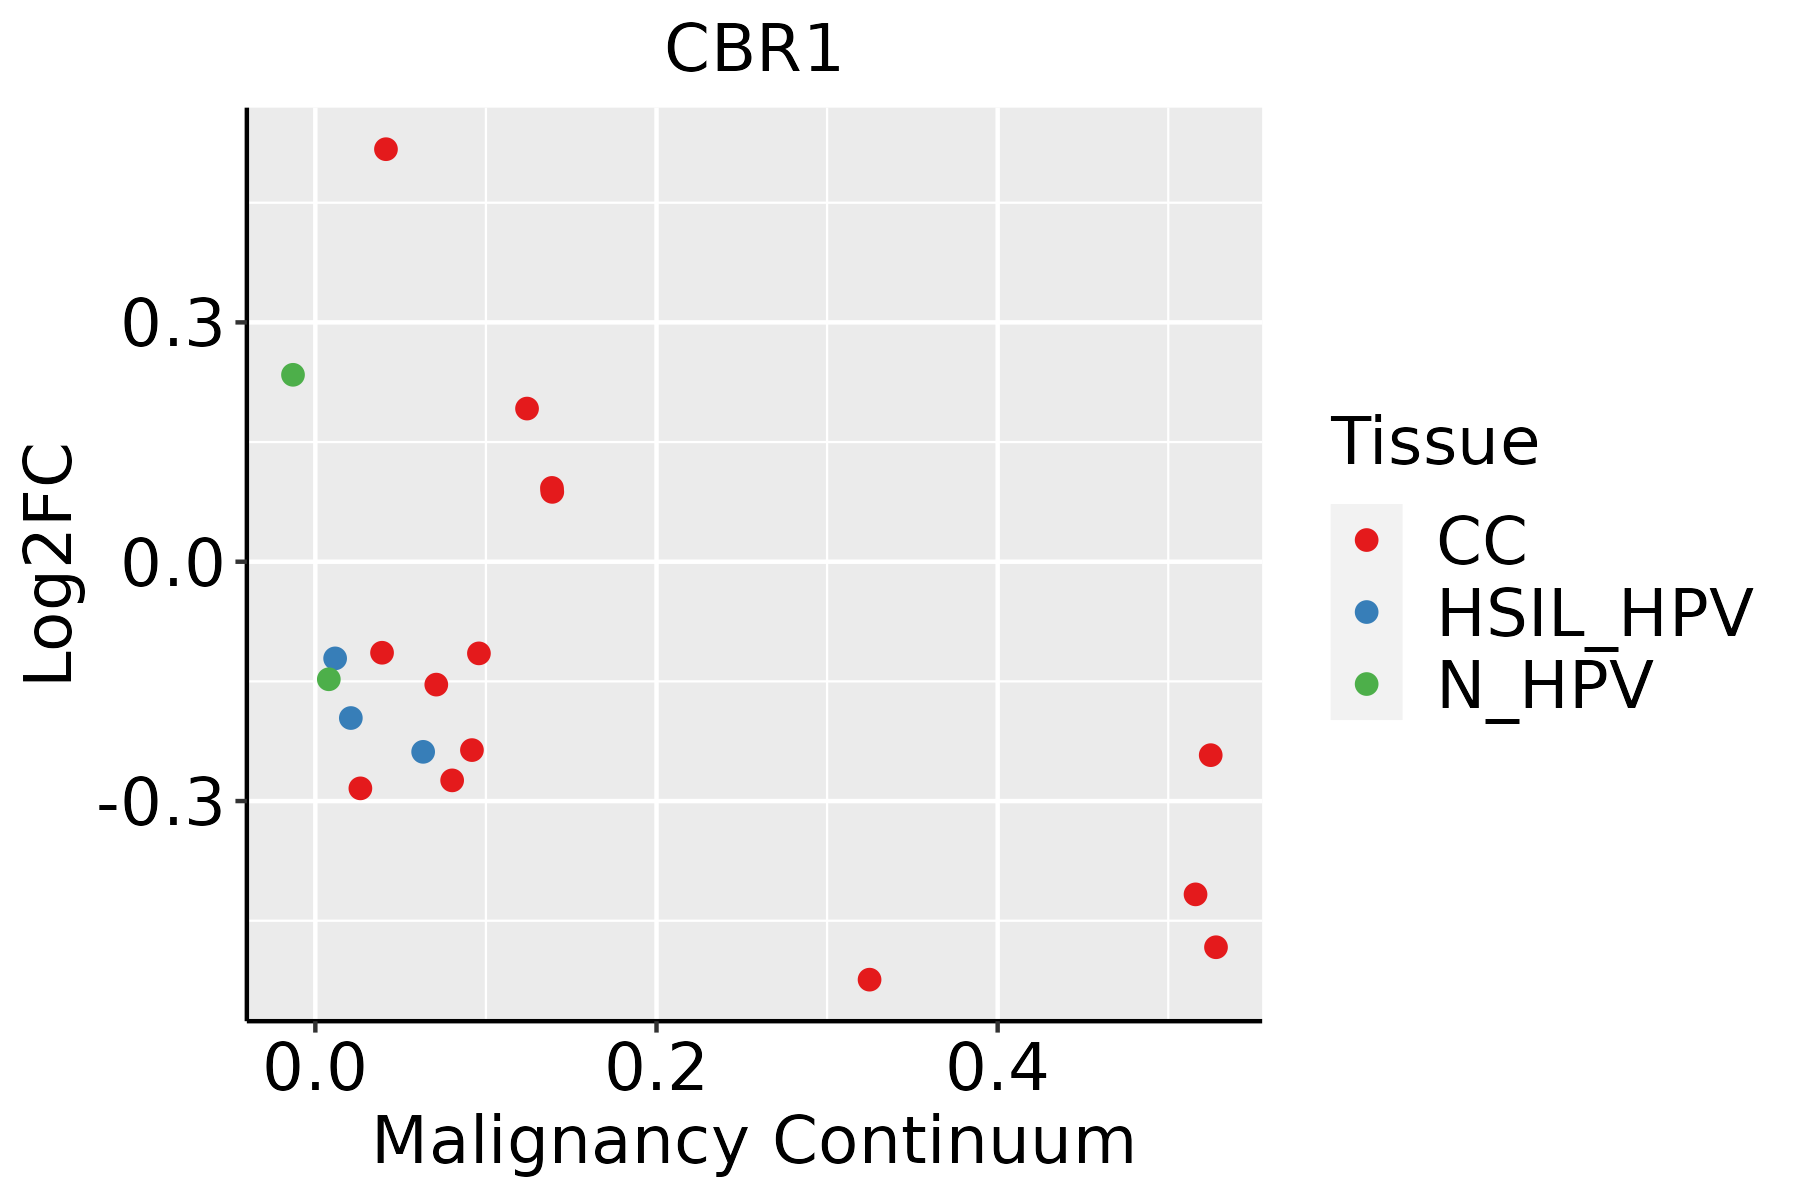 | CC: Cervix cancer |
| HSIL_HPV: HPV-infected high-grade squamous intraepithelial lesions | ||
| N_HPV: HPV-infected normal cervix | ||
| Colorectum (GSE201348) |  | FAP: Familial adenomatous polyposis |
| CRC: Colorectal cancer | ||
| Colorectum (HTA11) |  | AD: Adenomas |
| SER: Sessile serrated lesions | ||
| MSI-H: Microsatellite-high colorectal cancer | ||
| MSS: Microsatellite stable colorectal cancer | ||
| Esophagus |  | ESCC: Esophageal squamous cell carcinoma |
| HGIN: High-grade intraepithelial neoplasias | ||
| LGIN: Low-grade intraepithelial neoplasias | ||
| GC |  | CAG: Chronic atrophic gastritis |
| CAG with IM: Chronic atrophic gastritis with intestinal metaplasia | ||
| CSG: Chronic superficial gastritis | ||
| GC: Gastric cancer | ||
| SIM: Severe intestinal metaplasia | ||
| WIM: Wild intestinal metaplasia | ||
| Liver | 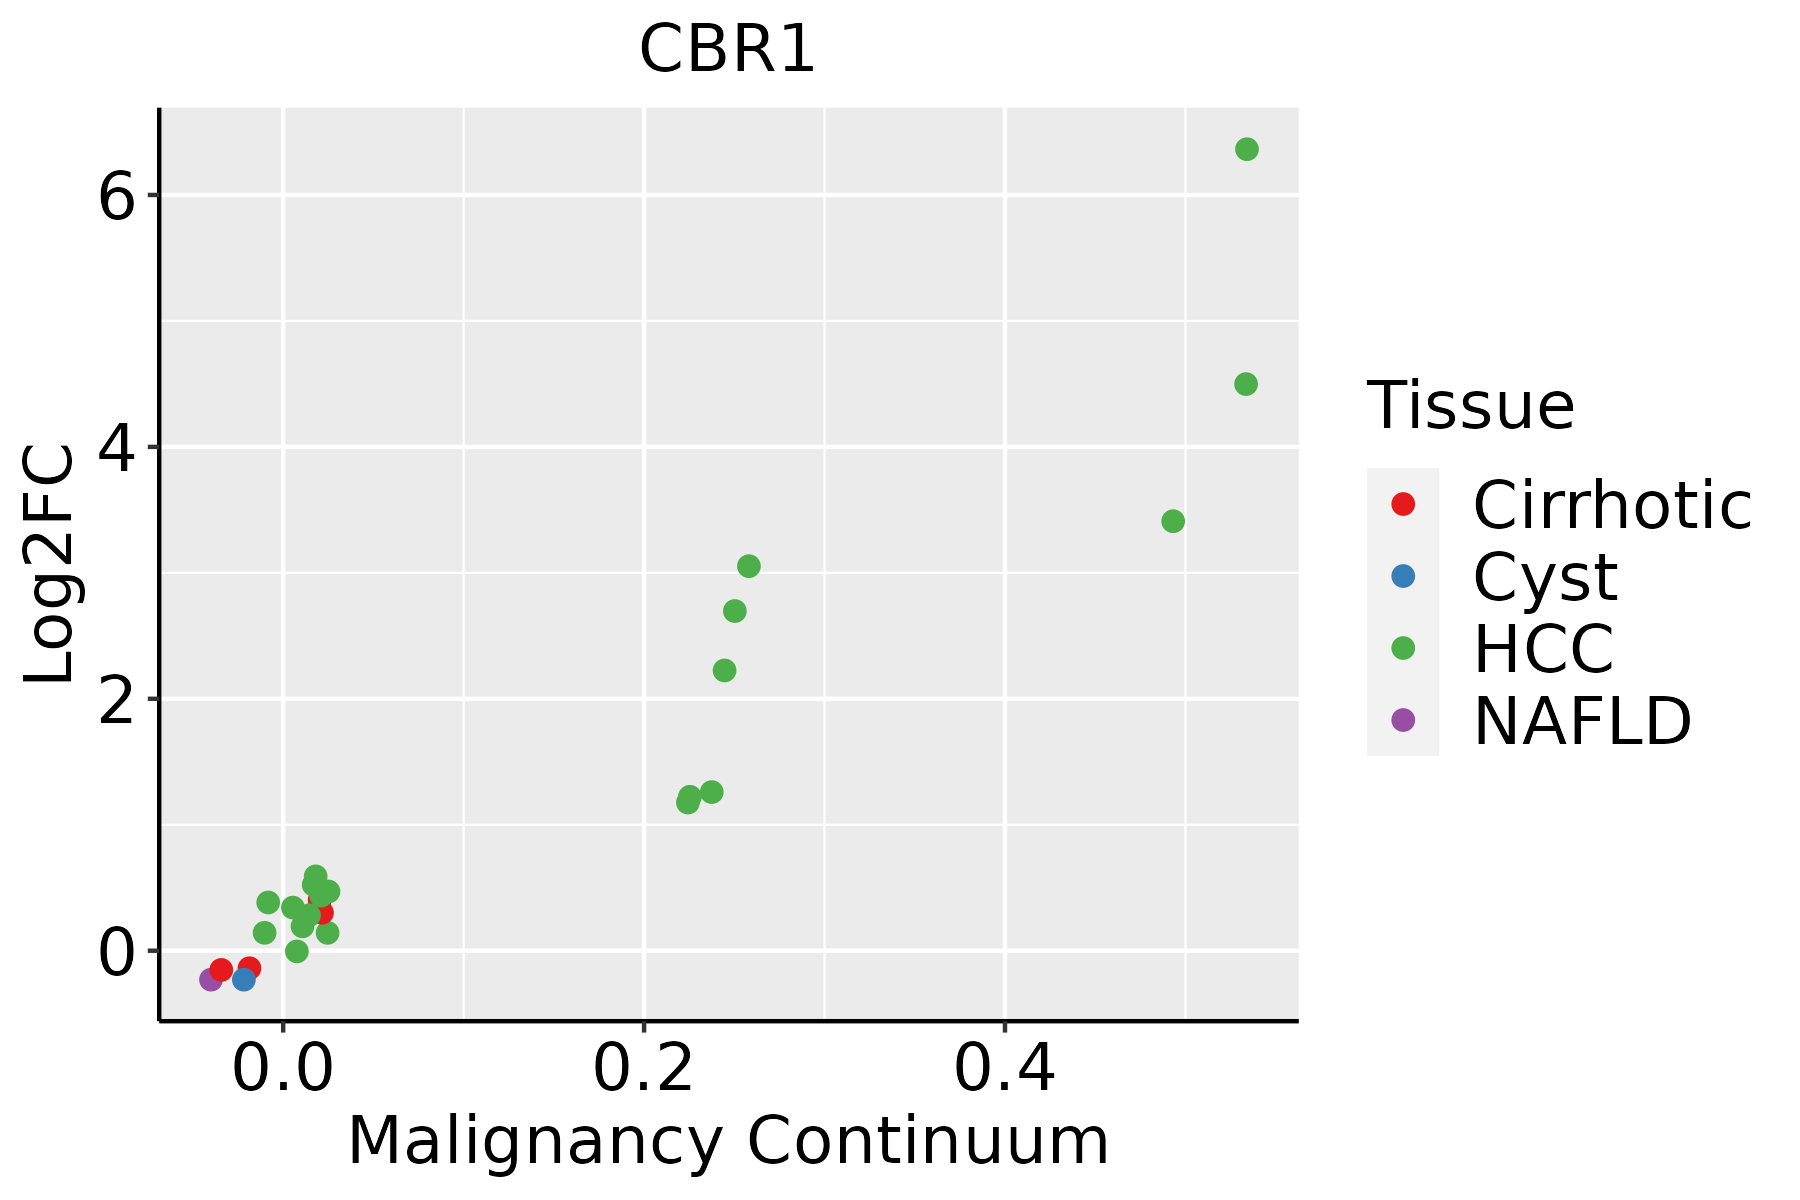 | HCC: Hepatocellular carcinoma |
| NAFLD: Non-alcoholic fatty liver disease | ||
| Oral Cavity | 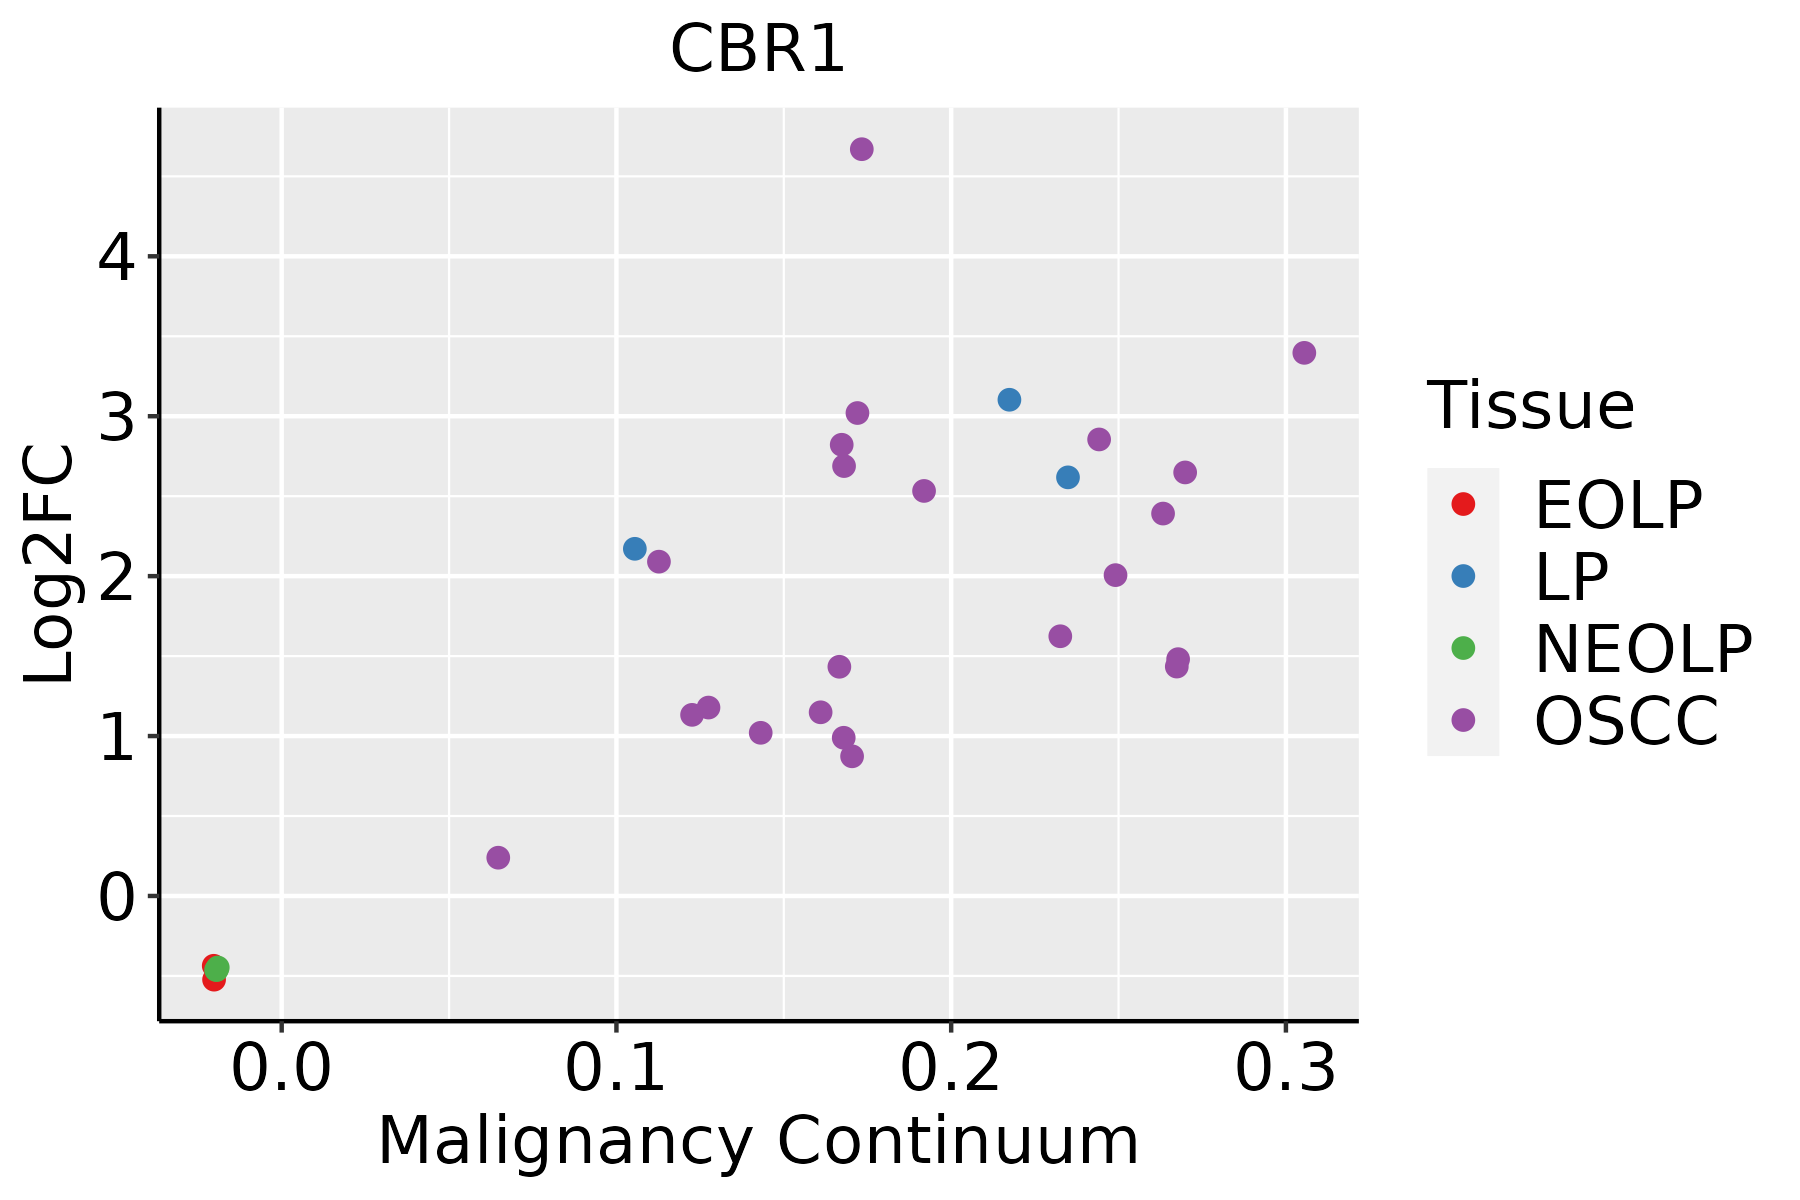 | EOLP: Erosive Oral lichen planus |
| LP: leukoplakia | ||
| NEOLP: Non-erosive oral lichen planus | ||
| OSCC: Oral squamous cell carcinoma | ||
| Skin | 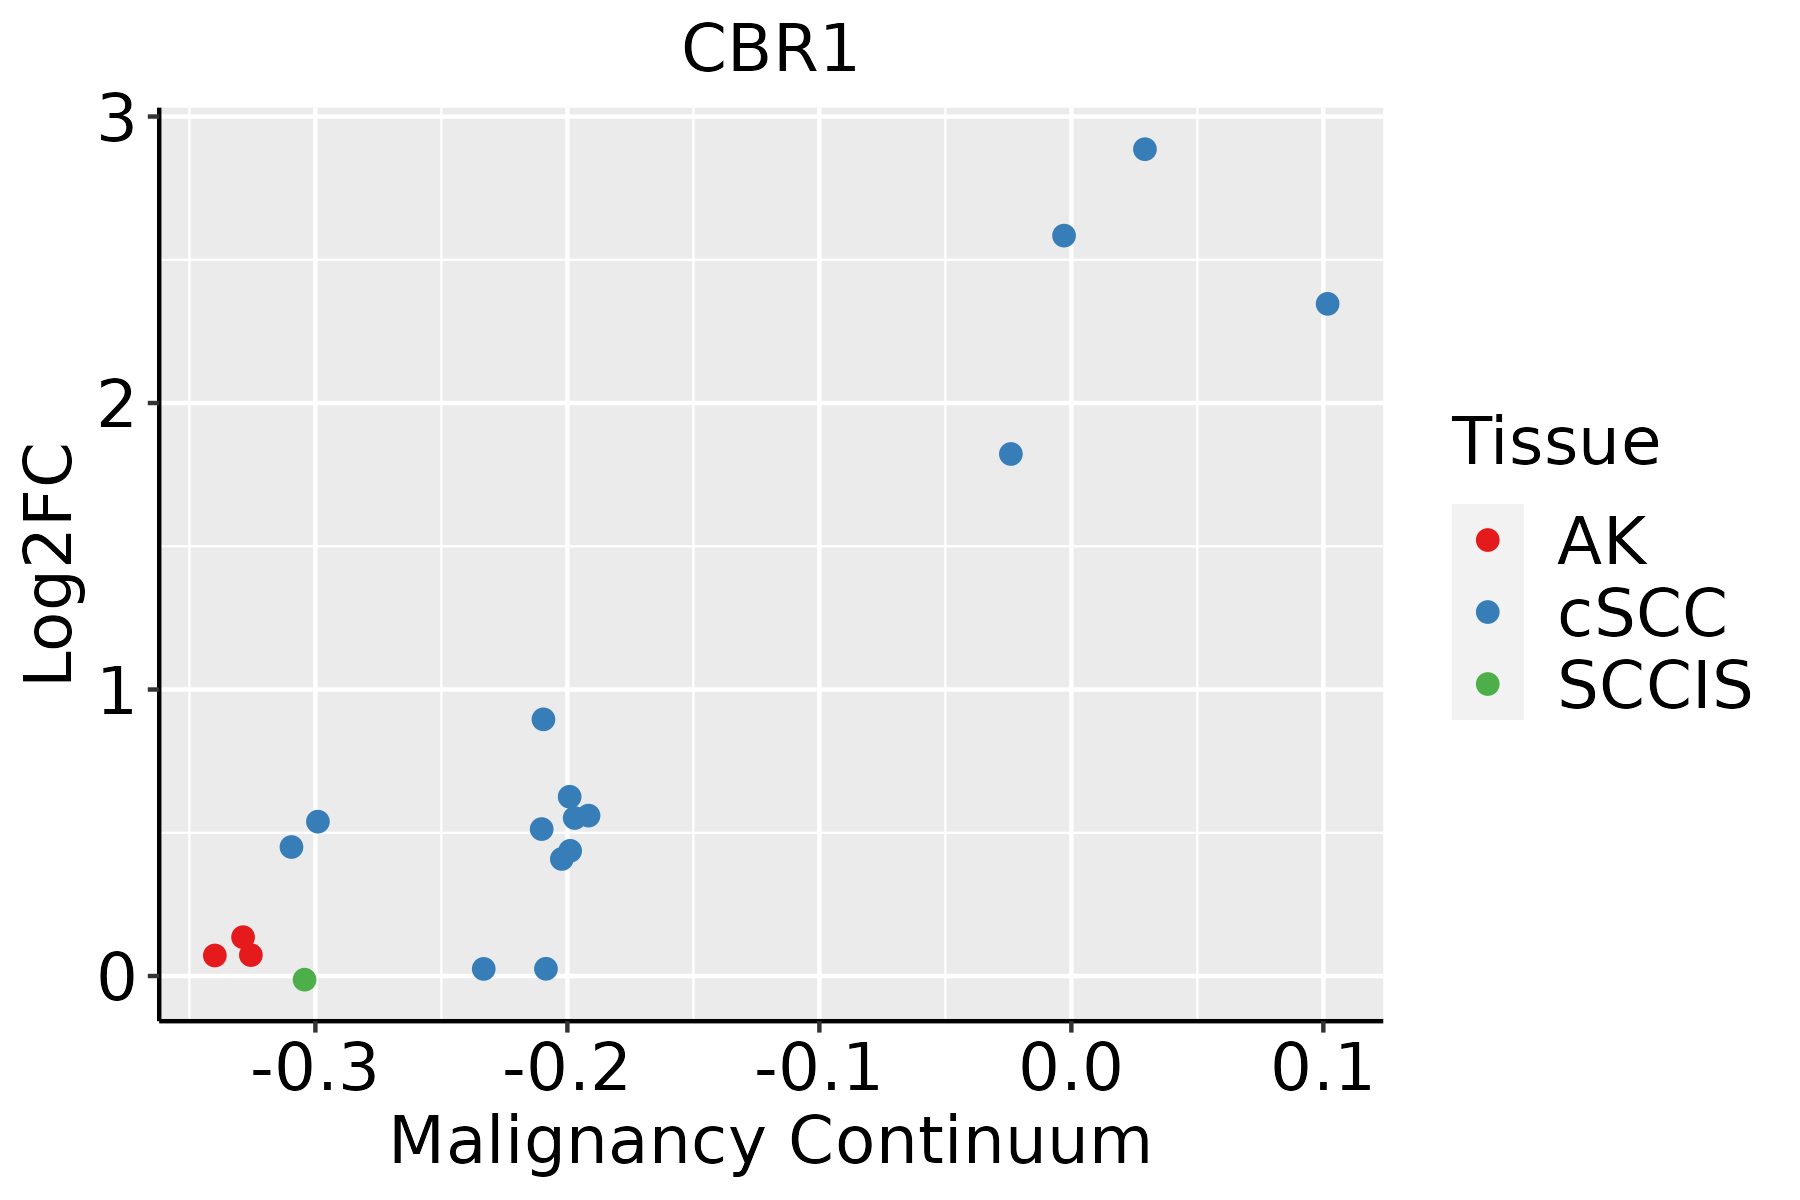 | AK: Actinic keratosis |
| cSCC: Cutaneous squamous cell carcinoma | ||
| SCCIS:squamous cell carcinoma in situ | ||
| Thyroid |  | ATC: Anaplastic thyroid cancer |
| HT: Hashimoto's thyroiditis | ||
| PTC: Papillary thyroid cancer |
| ∗log2FC in expression of this searched gene in stem-like cells from each diseased tissue sample relative to stem-like cells in normal samples in each tissue plotted against the malignancy continuum. Samples are colored based on if they are from different disease stage. |
Top |
Malignant transformation related pathway analysis |
| Find out the enriched GO biological processes and KEGG pathways involved in transition from healthy to precancer to cancer |
| Tissue | Disease Stage | Enriched GO biological Processes |
| Colorectum | AD |  |
| Colorectum | SER |  |
| Colorectum | MSS |  |
| Colorectum | MSI-H |  |
| Colorectum | FAP |  |
| ∗Top 15 enriched GO BP terms are showed in the bar plot of each disease state in each tissue. Each row represents a significant GO biological process which is colored according to the -log10(p.adjust). |
| Page: 1 2 3 4 5 6 7 8 9 |
| GO ID | Tissue | Disease Stage | Description | Gene Ratio | Bg Ratio | pvalue | p.adjust | Count |
| GO:20003799 | Cervix | CC | positive regulation of reactive oxygen species metabolic process | 20/2311 | 76/18723 | 7.02e-04 | 6.40e-03 | 20 |
| GO:00725939 | Cervix | CC | reactive oxygen species metabolic process | 47/2311 | 239/18723 | 7.74e-04 | 6.87e-03 | 47 |
| GO:00094109 | Cervix | CC | response to xenobiotic stimulus | 78/2311 | 462/18723 | 2.39e-03 | 1.70e-02 | 78 |
| GO:00464564 | Cervix | CC | icosanoid biosynthetic process | 15/2311 | 56/18723 | 2.60e-03 | 1.80e-02 | 15 |
| GO:20003779 | Cervix | CC | regulation of reactive oxygen species metabolic process | 32/2311 | 157/18723 | 2.78e-03 | 1.87e-02 | 32 |
| GO:00015165 | Cervix | CC | prostaglandin biosynthetic process | 9/2311 | 31/18723 | 1.04e-02 | 4.97e-02 | 9 |
| GO:00464575 | Cervix | CC | prostanoid biosynthetic process | 9/2311 | 31/18723 | 1.04e-02 | 4.97e-02 | 9 |
| GO:0006631 | Colorectum | AD | fatty acid metabolic process | 114/3918 | 390/18723 | 5.58e-05 | 9.44e-04 | 114 |
| GO:0009410 | Colorectum | AD | response to xenobiotic stimulus | 128/3918 | 462/18723 | 2.69e-04 | 3.31e-03 | 128 |
| GO:0072593 | Colorectum | AD | reactive oxygen species metabolic process | 73/3918 | 239/18723 | 2.79e-04 | 3.42e-03 | 73 |
| GO:2000379 | Colorectum | AD | positive regulation of reactive oxygen species metabolic process | 29/3918 | 76/18723 | 4.31e-04 | 4.82e-03 | 29 |
| GO:2000377 | Colorectum | AD | regulation of reactive oxygen species metabolic process | 48/3918 | 157/18723 | 2.77e-03 | 2.09e-02 | 48 |
| GO:00725931 | Colorectum | SER | reactive oxygen species metabolic process | 61/2897 | 239/18723 | 3.63e-05 | 9.39e-04 | 61 |
| GO:20003791 | Colorectum | SER | positive regulation of reactive oxygen species metabolic process | 24/2897 | 76/18723 | 3.29e-04 | 5.22e-03 | 24 |
| GO:20003771 | Colorectum | SER | regulation of reactive oxygen species metabolic process | 41/2897 | 157/18723 | 3.86e-04 | 5.86e-03 | 41 |
| GO:00066311 | Colorectum | SER | fatty acid metabolic process | 79/2897 | 390/18723 | 6.34e-03 | 4.56e-02 | 79 |
| GO:20003792 | Colorectum | MSS | positive regulation of reactive oxygen species metabolic process | 25/3467 | 76/18723 | 1.91e-03 | 1.66e-02 | 25 |
| GO:00066312 | Colorectum | MSS | fatty acid metabolic process | 95/3467 | 390/18723 | 2.20e-03 | 1.84e-02 | 95 |
| GO:00094101 | Colorectum | MSS | response to xenobiotic stimulus | 110/3467 | 462/18723 | 2.36e-03 | 1.92e-02 | 110 |
| GO:00725932 | Colorectum | MSS | reactive oxygen species metabolic process | 62/3467 | 239/18723 | 2.68e-03 | 2.12e-02 | 62 |
| Page: 1 2 3 4 5 6 7 8 9 10 |
| Pathway ID | Tissue | Disease Stage | Description | Gene Ratio | Bg Ratio | pvalue | p.adjust | qvalue | Count |
| hsa0520820 | Cervix | CC | Chemical carcinogenesis - reactive oxygen species | 92/1267 | 223/8465 | 4.71e-22 | 5.09e-20 | 3.01e-20 | 92 |
| hsa05208110 | Cervix | CC | Chemical carcinogenesis - reactive oxygen species | 92/1267 | 223/8465 | 4.71e-22 | 5.09e-20 | 3.01e-20 | 92 |
| hsa05208 | Colorectum | AD | Chemical carcinogenesis - reactive oxygen species | 126/2092 | 223/8465 | 1.01e-24 | 1.68e-22 | 1.07e-22 | 126 |
| hsa052081 | Colorectum | AD | Chemical carcinogenesis - reactive oxygen species | 126/2092 | 223/8465 | 1.01e-24 | 1.68e-22 | 1.07e-22 | 126 |
| hsa052082 | Colorectum | SER | Chemical carcinogenesis - reactive oxygen species | 103/1580 | 223/8465 | 1.60e-21 | 7.57e-20 | 5.50e-20 | 103 |
| hsa052083 | Colorectum | SER | Chemical carcinogenesis - reactive oxygen species | 103/1580 | 223/8465 | 1.60e-21 | 7.57e-20 | 5.50e-20 | 103 |
| hsa052084 | Colorectum | MSS | Chemical carcinogenesis - reactive oxygen species | 118/1875 | 223/8465 | 2.71e-24 | 4.54e-22 | 2.78e-22 | 118 |
| hsa052085 | Colorectum | MSS | Chemical carcinogenesis - reactive oxygen species | 118/1875 | 223/8465 | 2.71e-24 | 4.54e-22 | 2.78e-22 | 118 |
| hsa0520839 | Esophagus | HGIN | Chemical carcinogenesis - reactive oxygen species | 92/1383 | 223/8465 | 2.41e-19 | 9.83e-18 | 7.80e-18 | 92 |
| hsa05208115 | Esophagus | HGIN | Chemical carcinogenesis - reactive oxygen species | 92/1383 | 223/8465 | 2.41e-19 | 9.83e-18 | 7.80e-18 | 92 |
| hsa05208211 | Esophagus | ESCC | Chemical carcinogenesis - reactive oxygen species | 168/4205 | 223/8465 | 1.83e-15 | 6.81e-14 | 3.49e-14 | 168 |
| hsa05208310 | Esophagus | ESCC | Chemical carcinogenesis - reactive oxygen species | 168/4205 | 223/8465 | 1.83e-15 | 6.81e-14 | 3.49e-14 | 168 |
| hsa0520822 | Liver | Cirrhotic | Chemical carcinogenesis - reactive oxygen species | 121/2530 | 223/8465 | 1.35e-14 | 4.08e-13 | 2.52e-13 | 121 |
| hsa0520832 | Liver | Cirrhotic | Chemical carcinogenesis - reactive oxygen species | 121/2530 | 223/8465 | 1.35e-14 | 4.08e-13 | 2.52e-13 | 121 |
| hsa0520842 | Liver | HCC | Chemical carcinogenesis - reactive oxygen species | 167/4020 | 223/8465 | 2.85e-17 | 1.91e-15 | 1.06e-15 | 167 |
| hsa0520852 | Liver | HCC | Chemical carcinogenesis - reactive oxygen species | 167/4020 | 223/8465 | 2.85e-17 | 1.91e-15 | 1.06e-15 | 167 |
| hsa0520830 | Oral cavity | OSCC | Chemical carcinogenesis - reactive oxygen species | 150/3704 | 223/8465 | 6.45e-13 | 1.20e-11 | 6.11e-12 | 150 |
| hsa05208114 | Oral cavity | OSCC | Chemical carcinogenesis - reactive oxygen species | 150/3704 | 223/8465 | 6.45e-13 | 1.20e-11 | 6.11e-12 | 150 |
| hsa05208210 | Oral cavity | LP | Chemical carcinogenesis - reactive oxygen species | 119/2418 | 223/8465 | 3.00e-15 | 8.32e-14 | 5.37e-14 | 119 |
| hsa0520838 | Oral cavity | LP | Chemical carcinogenesis - reactive oxygen species | 119/2418 | 223/8465 | 3.00e-15 | 8.32e-14 | 5.37e-14 | 119 |
| Page: 1 2 |
Top |
Cell-cell communication analysis |
| Identification of potential cell-cell interactions between two cell types and their ligand-receptor pairs for different disease states |
| Ligand | Receptor | LRpair | Pathway | Tissue | Disease Stage |
| Page: 1 |
Top |
Single-cell gene regulatory network inference analysis |
| Find out the significant the regulons (TFs) and the target genes of each regulon across cell types for different disease states |
| TF | Cell Type | Tissue | Disease Stage | Target Gene | RSS | Regulon Activity |
| ∗The dot plots of a searched regulon are shown for all cell subpopulations in each disease state of each tissue based on the regulon specific score inferred using pySCENIC and by calculating the average expression. |
| Page: 1 |
Top |
Somatic mutation of malignant transformation related genes |
| Annotation of somatic variants for genes involved in malignant transformation |
| Hugo Symbol | Variant Class | Variant Classification | dbSNP RS | HGVSc | HGVSp | HGVSp Short | SWISSPROT | BIOTYPE | SIFT | PolyPhen | Tumor Sample Barcode | Tissue | Histology | Sex | Age | Stage | Therapy Types | Drugs | Outcome |
| CBR1 | SNV | Missense_Mutation | novel | c.816N>C | p.Lys272Asn | p.K272N | P16152 | protein_coding | deleterious(0) | possibly_damaging(0.896) | TCGA-3C-AALI-01 | Breast | breast invasive carcinoma | Female | <65 | I/II | Unspecific | Poly E | Complete Response |
| CBR1 | SNV | Missense_Mutation | c.656N>G | p.Asp219Gly | p.D219G | P16152 | protein_coding | deleterious(0) | benign(0.268) | TCGA-AA-3976-01 | Colorectum | colon adenocarcinoma | Male | >=65 | III/IV | Chemotherapy | folinic | CR | |
| CBR1 | SNV | Missense_Mutation | novel | c.568N>T | p.Pro190Ser | p.P190S | P16152 | protein_coding | tolerated(0.14) | benign(0.123) | TCGA-AZ-4315-01 | Colorectum | colon adenocarcinoma | Male | <65 | I/II | Unknown | Unknown | SD |
| CBR1 | SNV | Missense_Mutation | c.404N>C | p.Val135Ala | p.V135A | P16152 | protein_coding | deleterious(0) | probably_damaging(0.973) | TCGA-NH-A5IV-01 | Colorectum | colon adenocarcinoma | Female | >=65 | I/II | Unknown | Unknown | SD | |
| CBR1 | deletion | Frame_Shift_Del | novel | c.228delN | p.Leu77CysfsTer33 | p.L77Cfs*33 | P16152 | protein_coding | TCGA-AZ-4315-01 | Colorectum | colon adenocarcinoma | Male | <65 | I/II | Unknown | Unknown | SD | ||
| CBR1 | SNV | Missense_Mutation | novel | c.272N>T | p.Ala91Val | p.A91V | P16152 | protein_coding | deleterious(0.01) | possibly_damaging(0.788) | TCGA-A5-A0G2-01 | Endometrium | uterine corpus endometrioid carcinoma | Female | <65 | III/IV | Unknown | Unknown | SD |
| CBR1 | SNV | Missense_Mutation | rs763204071 | c.422N>C | p.Ile141Thr | p.I141T | P16152 | protein_coding | tolerated(0.37) | benign(0) | TCGA-A5-A0G2-01 | Endometrium | uterine corpus endometrioid carcinoma | Female | <65 | III/IV | Unknown | Unknown | SD |
| CBR1 | SNV | Missense_Mutation | novel | c.752N>A | p.Pro251His | p.P251H | P16152 | protein_coding | deleterious(0) | probably_damaging(0.996) | TCGA-A5-A0G2-01 | Endometrium | uterine corpus endometrioid carcinoma | Female | <65 | III/IV | Unknown | Unknown | SD |
| CBR1 | SNV | Missense_Mutation | novel | c.166A>G | p.Ser56Gly | p.S56G | P16152 | protein_coding | tolerated(0.08) | benign(0.015) | TCGA-A5-A1OF-01 | Endometrium | uterine corpus endometrioid carcinoma | Female | <65 | I/II | Unknown | Unknown | SD |
| CBR1 | SNV | Missense_Mutation | rs770198762 | c.412N>A | p.Val138Ile | p.V138I | P16152 | protein_coding | tolerated(0.25) | benign(0.043) | TCGA-A5-A7WJ-01 | Endometrium | uterine corpus endometrioid carcinoma | Female | <65 | I/II | Unknown | Unknown | SD |
| Page: 1 2 |
Top |
Related drugs of malignant transformation related genes |
| Identification of chemicals and drugs interact with genes involved in malignant transfromation |
| (DGIdb 4.0) |
| Entrez ID | Symbol | Category | Interaction Types | Drug Claim Name | Drug Name | PMIDs |
| 873 | CBR1 | DRUGGABLE GENOME, SHORT CHAIN DEHYDROGENASE REDUCTASE, ENZYME | inhibitor | 178102193 | WEDELOLACTONE | |
| 873 | CBR1 | DRUGGABLE GENOME, SHORT CHAIN DEHYDROGENASE REDUCTASE, ENZYME | doxorubicin | DOXORUBICIN | 21048526,19016765,19022938,19204081 | |
| 873 | CBR1 | DRUGGABLE GENOME, SHORT CHAIN DEHYDROGENASE REDUCTASE, ENZYME | N6022 | N6022 | ||
| 873 | CBR1 | DRUGGABLE GENOME, SHORT CHAIN DEHYDROGENASE REDUCTASE, ENZYME | doxorubicinol | 19016765 | ||
| 873 | CBR1 | DRUGGABLE GENOME, SHORT CHAIN DEHYDROGENASE REDUCTASE, ENZYME | fluorouracil | FLUOROURACIL | ||
| 873 | CBR1 | DRUGGABLE GENOME, SHORT CHAIN DEHYDROGENASE REDUCTASE, ENZYME | anthracyclines and related substances | 22124095 | ||
| 873 | CBR1 | DRUGGABLE GENOME, SHORT CHAIN DEHYDROGENASE REDUCTASE, ENZYME | cyclophosphamide | CYCLOPHOSPHAMIDE | ||
| 873 | CBR1 | DRUGGABLE GENOME, SHORT CHAIN DEHYDROGENASE REDUCTASE, ENZYME | daunorubicin | DAUNORUBICIN | 19204081 |
| Page: 1 |

Copyright 2023-Present -The University of Texas Health Science Center at Houston |