
|
|||||
|
 | |
| |
| |
| |
| |
| |
|
Gene: CBLL1 |
Gene summary for CBLL1 |
| Gene information | Species | Human | Gene symbol | CBLL1 | Gene ID | 79872 |
| Gene name | Cbl proto-oncogene like 1 | |
| Gene Alias | HAKAI | |
| Cytomap | 7q22.3 | |
| Gene Type | protein-coding | GO ID | GO:0001510 | UniProtAcc | Q75N03 |
Top |
Malignant transformation analysis |
| Identification of the aberrant gene expression in precancerous and cancerous lesions by comparing the gene expression of stem-like cells in diseased tissues with normal stem cells |
| Entrez ID | Symbol | Replicates | Species | Organ | Tissue | Adj P-value | Log2FC | Malignancy |
| 79872 | CBLL1 | LZE4T | Human | Esophagus | ESCC | 5.46e-09 | 1.43e-01 | 0.0811 |
| 79872 | CBLL1 | LZE8T | Human | Esophagus | ESCC | 1.31e-02 | 5.87e-02 | 0.067 |
| 79872 | CBLL1 | LZE20T | Human | Esophagus | ESCC | 4.44e-02 | 1.32e-01 | 0.0662 |
| 79872 | CBLL1 | LZE24T | Human | Esophagus | ESCC | 1.45e-15 | 2.65e-01 | 0.0596 |
| 79872 | CBLL1 | LZE6T | Human | Esophagus | ESCC | 5.37e-03 | 1.11e-01 | 0.0845 |
| 79872 | CBLL1 | P1T-E | Human | Esophagus | ESCC | 2.67e-07 | 1.87e-01 | 0.0875 |
| 79872 | CBLL1 | P2T-E | Human | Esophagus | ESCC | 5.68e-13 | 1.28e-01 | 0.1177 |
| 79872 | CBLL1 | P4T-E | Human | Esophagus | ESCC | 6.40e-07 | 2.43e-01 | 0.1323 |
| 79872 | CBLL1 | P5T-E | Human | Esophagus | ESCC | 1.96e-12 | 1.10e-01 | 0.1327 |
| 79872 | CBLL1 | P8T-E | Human | Esophagus | ESCC | 1.45e-14 | 1.59e-01 | 0.0889 |
| 79872 | CBLL1 | P9T-E | Human | Esophagus | ESCC | 5.11e-12 | 1.63e-01 | 0.1131 |
| 79872 | CBLL1 | P10T-E | Human | Esophagus | ESCC | 2.14e-19 | 2.08e-01 | 0.116 |
| 79872 | CBLL1 | P11T-E | Human | Esophagus | ESCC | 7.52e-04 | 3.82e-01 | 0.1426 |
| 79872 | CBLL1 | P12T-E | Human | Esophagus | ESCC | 3.10e-16 | 3.34e-01 | 0.1122 |
| 79872 | CBLL1 | P15T-E | Human | Esophagus | ESCC | 2.73e-19 | 4.48e-01 | 0.1149 |
| 79872 | CBLL1 | P16T-E | Human | Esophagus | ESCC | 2.20e-20 | 1.91e-01 | 0.1153 |
| 79872 | CBLL1 | P17T-E | Human | Esophagus | ESCC | 5.53e-04 | 5.49e-01 | 0.1278 |
| 79872 | CBLL1 | P20T-E | Human | Esophagus | ESCC | 3.27e-31 | 8.01e-01 | 0.1124 |
| 79872 | CBLL1 | P21T-E | Human | Esophagus | ESCC | 1.22e-16 | 2.46e-01 | 0.1617 |
| 79872 | CBLL1 | P22T-E | Human | Esophagus | ESCC | 9.82e-14 | 1.17e-01 | 0.1236 |
| Page: 1 2 3 4 |
| Tissue | Expression Dynamics | Abbreviation |
| Esophagus | 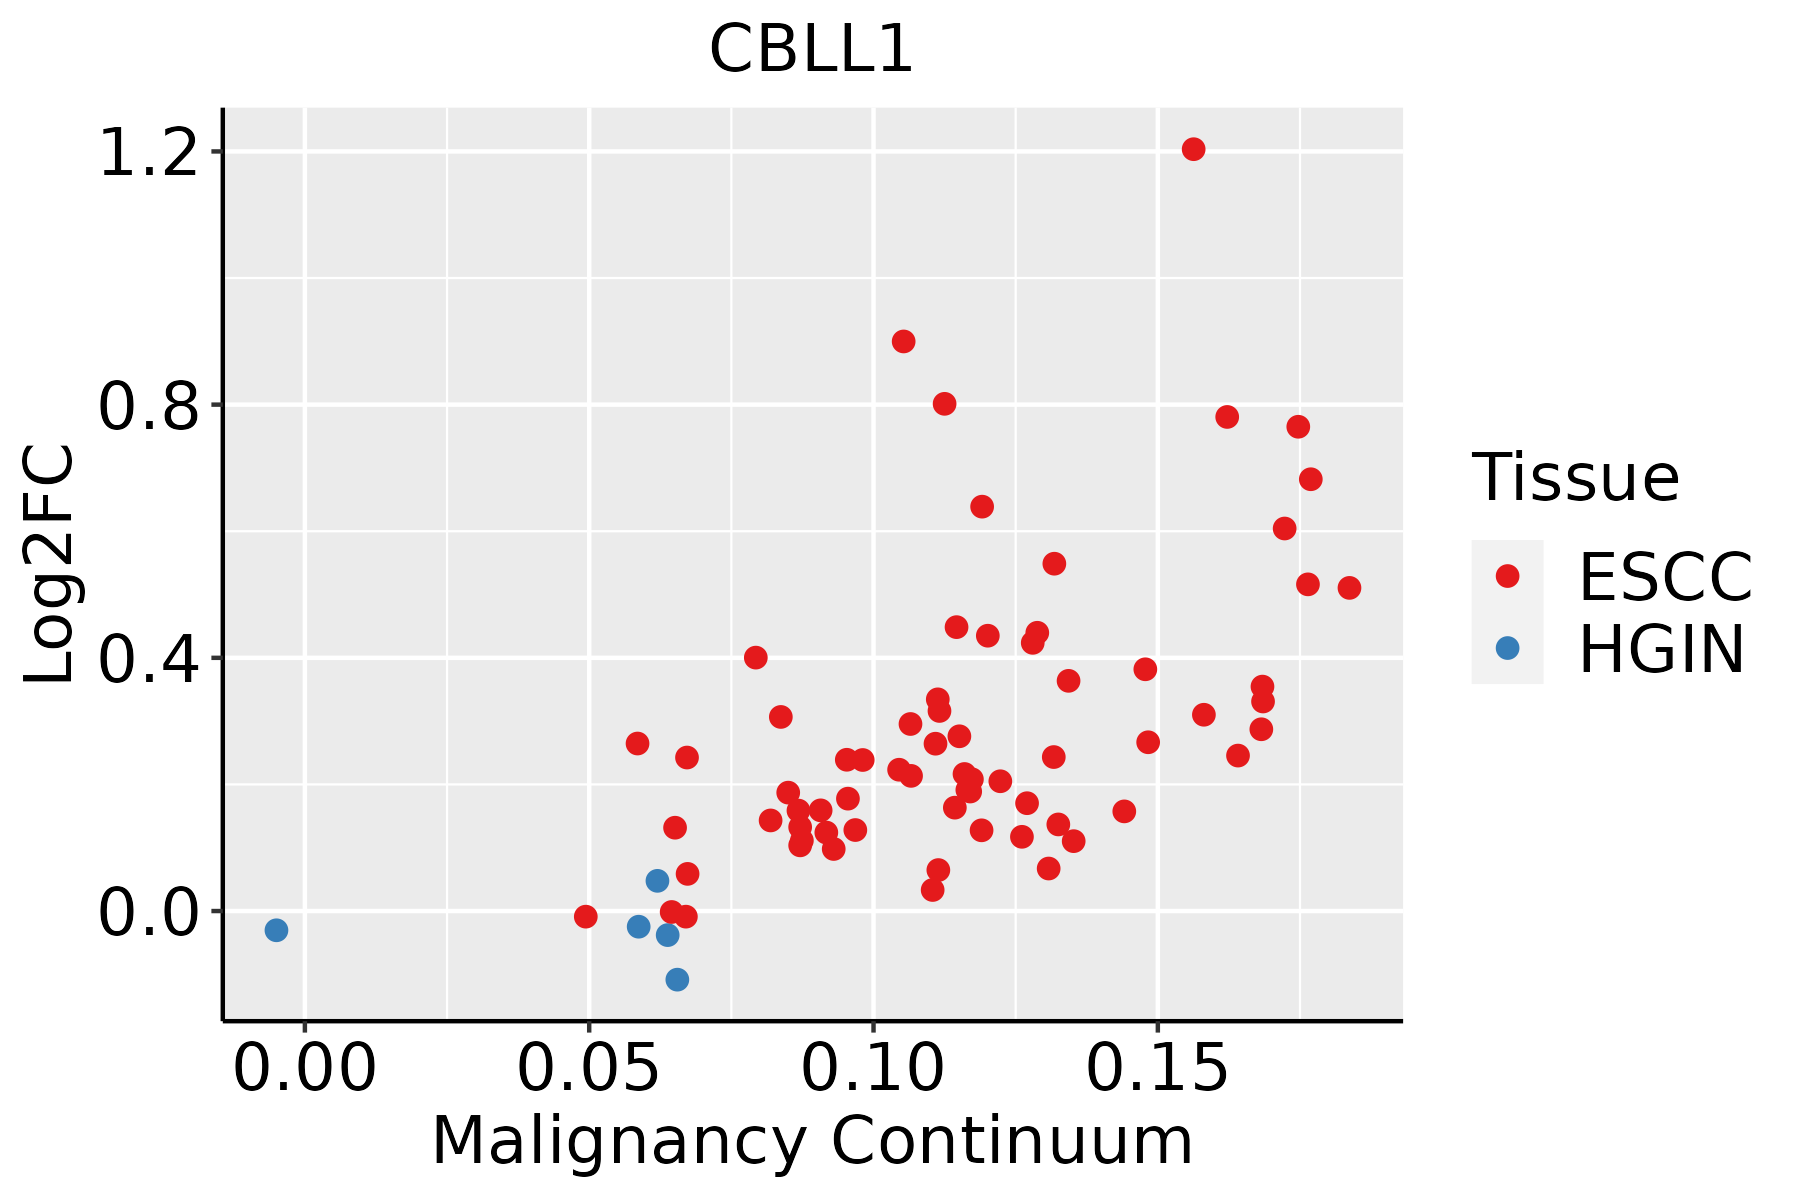 | ESCC: Esophageal squamous cell carcinoma |
| HGIN: High-grade intraepithelial neoplasias | ||
| LGIN: Low-grade intraepithelial neoplasias | ||
| Liver |  | HCC: Hepatocellular carcinoma |
| NAFLD: Non-alcoholic fatty liver disease | ||
| Prostate | 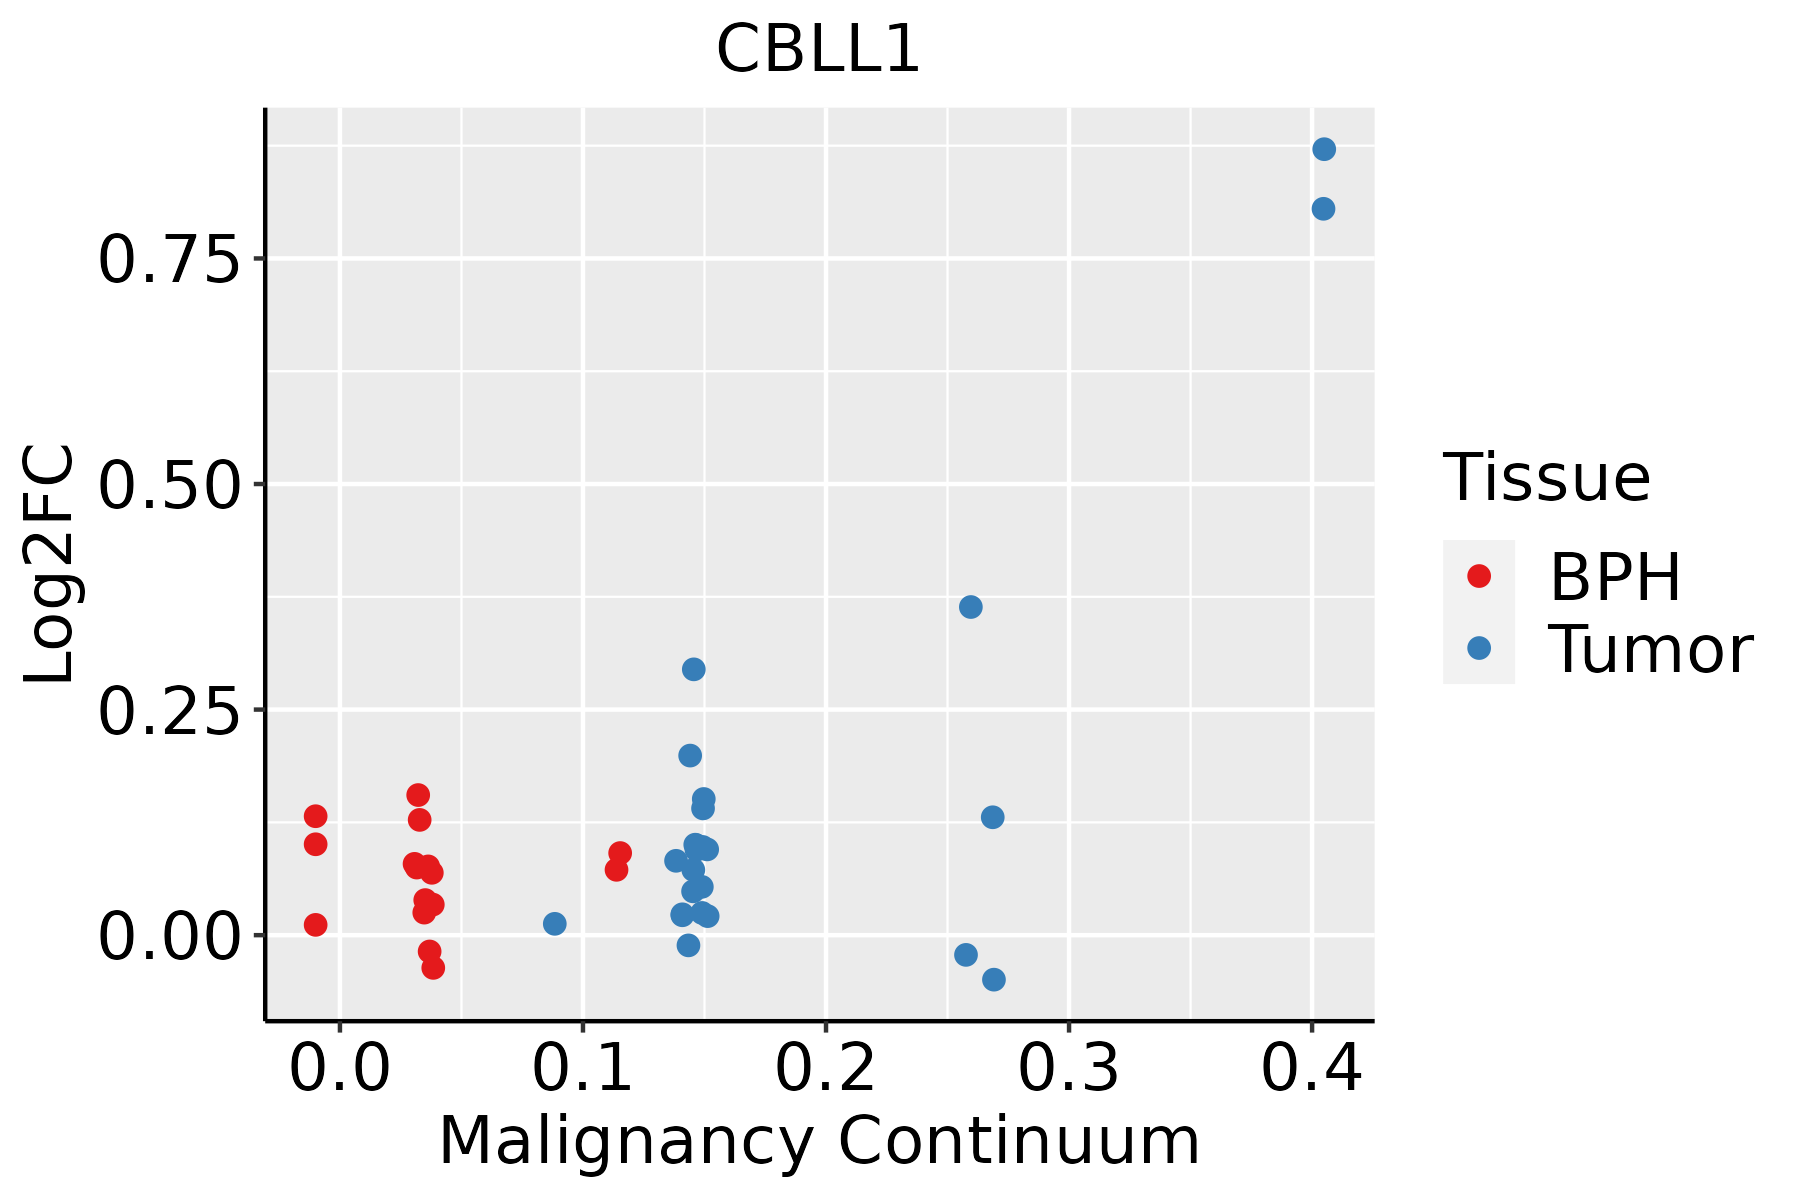 | BPH: Benign Prostatic Hyperplasia |
| ∗log2FC in expression of this searched gene in stem-like cells from each diseased tissue sample relative to stem-like cells in normal samples in each tissue plotted against the malignancy continuum. Samples are colored based on if they are from different disease stage. |
Top |
Malignant transformation related pathway analysis |
| Find out the enriched GO biological processes and KEGG pathways involved in transition from healthy to precancer to cancer |
| Tissue | Disease Stage | Enriched GO biological Processes |
| Colorectum | AD |  |
| Colorectum | SER |  |
| Colorectum | MSS |  |
| Colorectum | MSI-H |  |
| Colorectum | FAP |  |
| ∗Top 15 enriched GO BP terms are showed in the bar plot of each disease state in each tissue. Each row represents a significant GO biological process which is colored according to the -log10(p.adjust). |
| Page: 1 2 3 4 5 6 7 8 9 |
| GO ID | Tissue | Disease Stage | Description | Gene Ratio | Bg Ratio | pvalue | p.adjust | Count |
| GO:00434143 | Esophagus | ESCC | macromolecule methylation | 199/8552 | 316/18723 | 3.44e-10 | 9.57e-09 | 199 |
| GO:00322592 | Esophagus | ESCC | methylation | 222/8552 | 364/18723 | 2.26e-09 | 5.09e-08 | 222 |
| GO:00094512 | Esophagus | ESCC | RNA modification | 114/8552 | 167/18723 | 2.76e-09 | 6.04e-08 | 114 |
| GO:003010018 | Esophagus | ESCC | regulation of endocytosis | 135/8552 | 211/18723 | 5.75e-08 | 1.02e-06 | 135 |
| GO:004580718 | Esophagus | ESCC | positive regulation of endocytosis | 69/8552 | 100/18723 | 1.97e-06 | 2.29e-05 | 69 |
| GO:00015101 | Esophagus | ESCC | RNA methylation | 58/8552 | 83/18723 | 6.87e-06 | 6.94e-05 | 58 |
| GO:00800092 | Esophagus | ESCC | mRNA methylation | 14/8552 | 16/18723 | 6.78e-04 | 3.56e-03 | 14 |
| GO:00165561 | Esophagus | ESCC | mRNA modification | 21/8552 | 27/18723 | 6.88e-04 | 3.61e-03 | 21 |
| GO:003010011 | Liver | Cirrhotic | regulation of endocytosis | 74/4634 | 211/18723 | 4.86e-04 | 3.90e-03 | 74 |
| GO:004580711 | Liver | Cirrhotic | positive regulation of endocytosis | 38/4634 | 100/18723 | 2.22e-03 | 1.35e-02 | 38 |
| GO:00071624 | Liver | Cirrhotic | negative regulation of cell adhesion | 93/4634 | 303/18723 | 1.06e-02 | 4.66e-02 | 93 |
| GO:00434141 | Liver | HCC | macromolecule methylation | 183/7958 | 316/18723 | 2.00e-08 | 4.72e-07 | 183 |
| GO:0032259 | Liver | HCC | methylation | 206/7958 | 364/18723 | 3.35e-08 | 7.53e-07 | 206 |
| GO:0009451 | Liver | HCC | RNA modification | 101/7958 | 167/18723 | 2.02e-06 | 2.78e-05 | 101 |
| GO:0001510 | Liver | HCC | RNA methylation | 53/7958 | 83/18723 | 6.96e-05 | 6.29e-04 | 53 |
| GO:003010021 | Liver | HCC | regulation of endocytosis | 117/7958 | 211/18723 | 9.56e-05 | 8.32e-04 | 117 |
| GO:004580721 | Liver | HCC | positive regulation of endocytosis | 59/7958 | 100/18723 | 6.35e-04 | 3.93e-03 | 59 |
| GO:0080009 | Liver | HCC | mRNA methylation | 12/7958 | 16/18723 | 8.74e-03 | 3.40e-02 | 12 |
| GO:0016556 | Liver | HCC | mRNA modification | 18/7958 | 27/18723 | 9.75e-03 | 3.66e-02 | 18 |
| GO:00071628 | Prostate | BPH | negative regulation of cell adhesion | 82/3107 | 303/18723 | 2.51e-06 | 4.04e-05 | 82 |
| Page: 1 2 |
| Pathway ID | Tissue | Disease Stage | Description | Gene Ratio | Bg Ratio | pvalue | p.adjust | qvalue | Count |
| Page: 1 |
Top |
Cell-cell communication analysis |
| Identification of potential cell-cell interactions between two cell types and their ligand-receptor pairs for different disease states |
| Ligand | Receptor | LRpair | Pathway | Tissue | Disease Stage |
| Page: 1 |
Top |
Single-cell gene regulatory network inference analysis |
| Find out the significant the regulons (TFs) and the target genes of each regulon across cell types for different disease states |
| TF | Cell Type | Tissue | Disease Stage | Target Gene | RSS | Regulon Activity |
| ∗The dot plots of a searched regulon are shown for all cell subpopulations in each disease state of each tissue based on the regulon specific score inferred using pySCENIC and by calculating the average expression. |
| Page: 1 |
Top |
Somatic mutation of malignant transformation related genes |
| Annotation of somatic variants for genes involved in malignant transformation |
| Hugo Symbol | Variant Class | Variant Classification | dbSNP RS | HGVSc | HGVSp | HGVSp Short | SWISSPROT | BIOTYPE | SIFT | PolyPhen | Tumor Sample Barcode | Tissue | Histology | Sex | Age | Stage | Therapy Types | Drugs | Outcome |
| CBLL1 | SNV | Missense_Mutation | c.1145N>T | p.Pro382Leu | p.P382L | Q75N03 | protein_coding | tolerated(0.09) | probably_damaging(0.998) | TCGA-A7-A0DB-01 | Breast | breast invasive carcinoma | Female | <65 | I/II | Hormone Therapy | arimidex | SD | |
| CBLL1 | SNV | Missense_Mutation | rs763554958 | c.403N>G | p.Ile135Val | p.I135V | Q75N03 | protein_coding | tolerated(0.7) | benign(0.015) | TCGA-AO-A128-01 | Breast | breast invasive carcinoma | Female | <65 | I/II | Chemotherapy | doxorubicin | SD |
| CBLL1 | SNV | Missense_Mutation | c.140C>A | p.Thr47Asn | p.T47N | Q75N03 | protein_coding | tolerated(0.21) | benign(0) | TCGA-D8-A1XK-01 | Breast | breast invasive carcinoma | Female | <65 | I/II | Chemotherapy | doxorubicine+cyclophosphamide | SD | |
| CBLL1 | SNV | Missense_Mutation | c.655C>T | p.Arg219Cys | p.R219C | Q75N03 | protein_coding | tolerated(0.2) | possibly_damaging(0.872) | TCGA-2W-A8YY-01 | Cervix | cervical & endocervical cancer | Female | <65 | I/II | Chemotherapy | cisplatin | CR | |
| CBLL1 | SNV | Missense_Mutation | novel | c.1157C>A | p.Pro386His | p.P386H | Q75N03 | protein_coding | deleterious(0.01) | possibly_damaging(0.865) | TCGA-2W-A8YY-01 | Cervix | cervical & endocervical cancer | Female | <65 | I/II | Chemotherapy | cisplatin | CR |
| CBLL1 | SNV | Missense_Mutation | c.202N>C | p.Glu68Gln | p.E68Q | Q75N03 | protein_coding | deleterious(0.01) | benign(0.294) | TCGA-C5-A1BF-01 | Cervix | cervical & endocervical cancer | Female | <65 | I/II | Chemotherapy | cisplatin | PD | |
| CBLL1 | SNV | Missense_Mutation | novel | c.566N>A | p.Arg189His | p.R189H | Q75N03 | protein_coding | tolerated(0.07) | probably_damaging(0.911) | TCGA-EA-A410-01 | Cervix | cervical & endocervical cancer | Female | <65 | I/II | Unknown | Unknown | SD |
| CBLL1 | SNV | Missense_Mutation | c.652N>C | p.Glu218Gln | p.E218Q | Q75N03 | protein_coding | deleterious(0.02) | benign(0.086) | TCGA-EK-A2PM-01 | Cervix | cervical & endocervical cancer | Female | >=65 | I/II | Unknown | Unknown | SD | |
| CBLL1 | SNV | Missense_Mutation | c.1402N>T | p.Gly468Cys | p.G468C | Q75N03 | protein_coding | deleterious(0) | probably_damaging(0.98) | TCGA-AA-3663-01 | Colorectum | colon adenocarcinoma | Male | <65 | I/II | Unknown | Unknown | SD | |
| CBLL1 | SNV | Missense_Mutation | rs756843724 | c.74N>A | p.Arg25Gln | p.R25Q | Q75N03 | protein_coding | tolerated_low_confidence(0.21) | benign(0.061) | TCGA-AA-A00N-01 | Colorectum | colon adenocarcinoma | Male | >=65 | I/II | Unknown | Unknown | PD |
| Page: 1 2 3 4 5 6 7 |
Top |
Related drugs of malignant transformation related genes |
| Identification of chemicals and drugs interact with genes involved in malignant transfromation |
| (DGIdb 4.0) |
| Entrez ID | Symbol | Category | Interaction Types | Drug Claim Name | Drug Name | PMIDs |
| Page: 1 |

Copyright 2023-Present -The University of Texas Health Science Center at Houston |