| Tissue | Expression Dynamics | Abbreviation |
| Cervix | 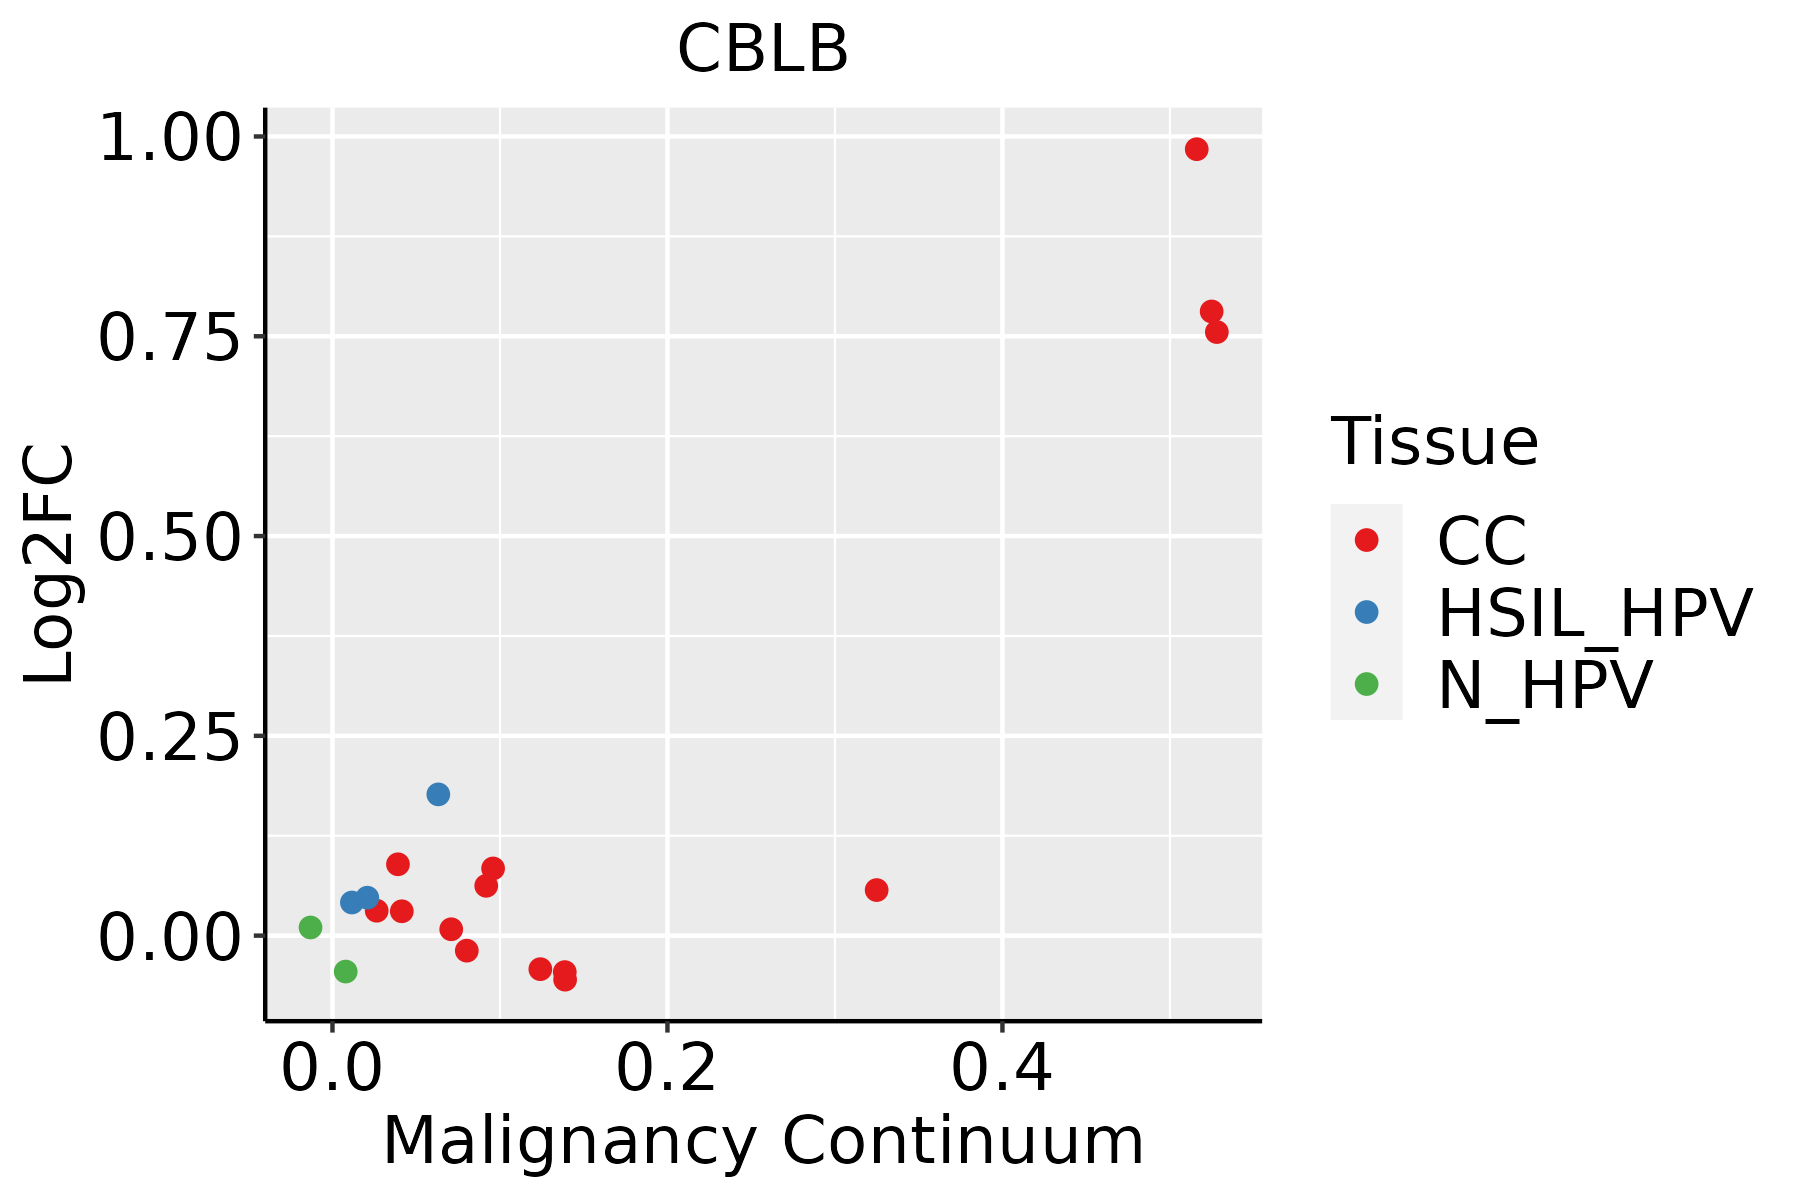 | CC: Cervix cancer |
| HSIL_HPV: HPV-infected high-grade squamous intraepithelial lesions |
| N_HPV: HPV-infected normal cervix |
| Colorectum (GSE201348) |  | FAP: Familial adenomatous polyposis |
| CRC: Colorectal cancer |
| Colorectum (HTA11) |  | AD: Adenomas |
| SER: Sessile serrated lesions |
| MSI-H: Microsatellite-high colorectal cancer |
| MSS: Microsatellite stable colorectal cancer |
| Endometrium | 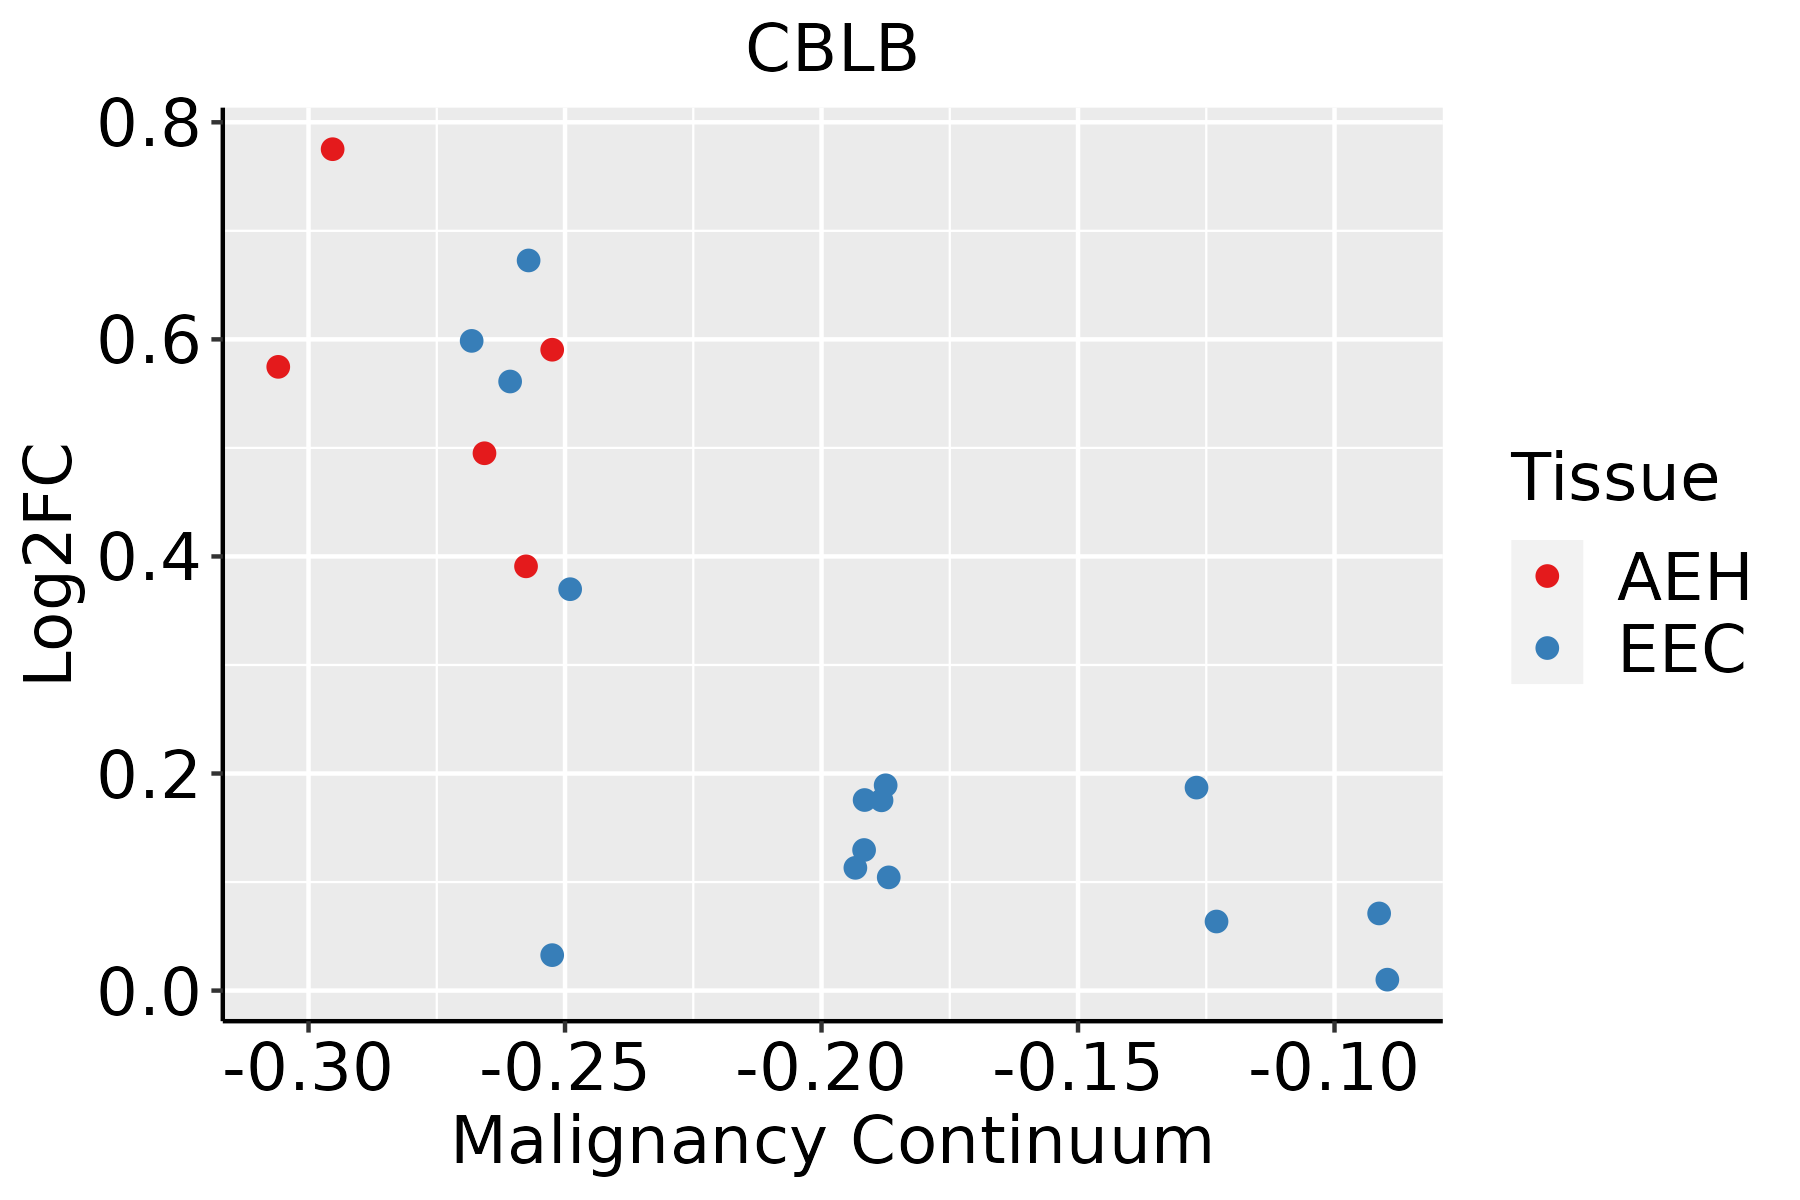 | AEH: Atypical endometrial hyperplasia |
| EEC: Endometrioid Cancer |
| Esophagus | 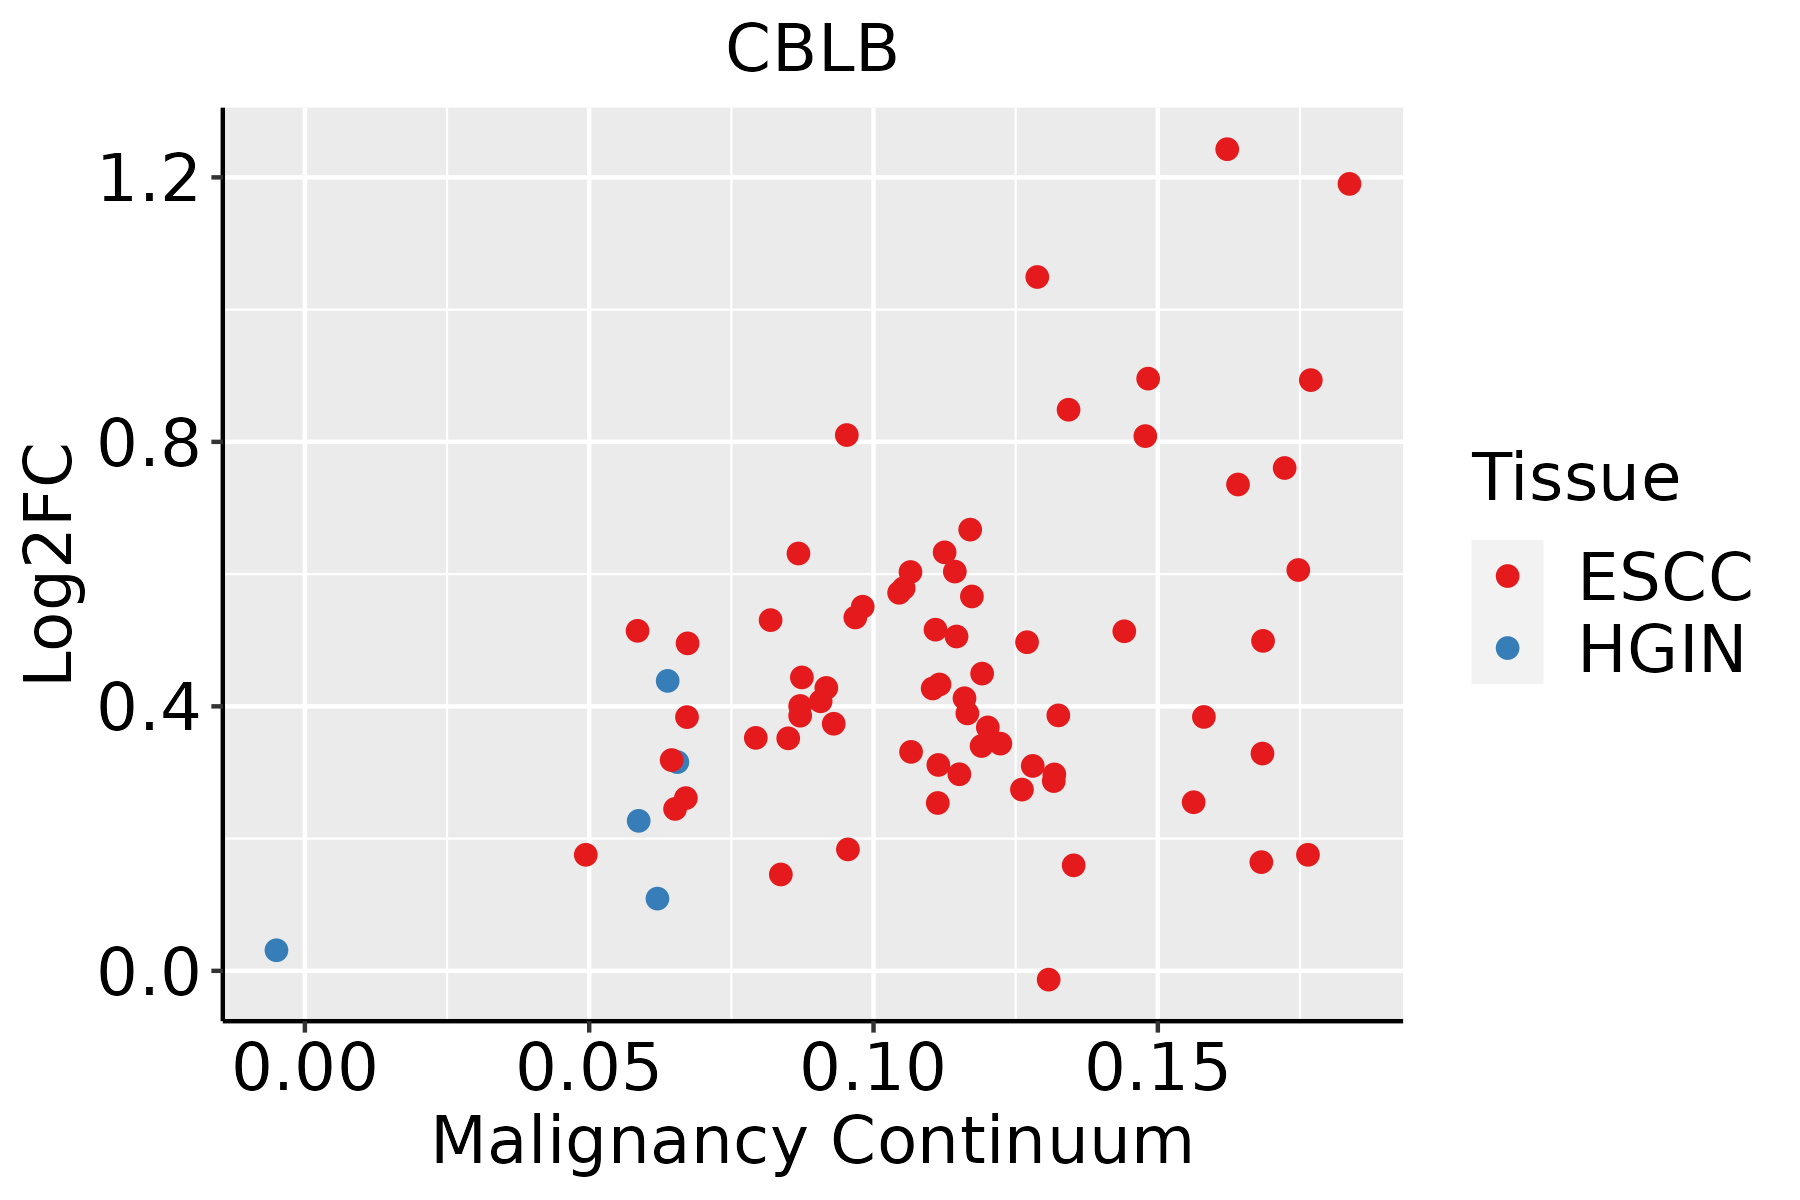 | ESCC: Esophageal squamous cell carcinoma |
| HGIN: High-grade intraepithelial neoplasias |
| LGIN: Low-grade intraepithelial neoplasias |
| GC | 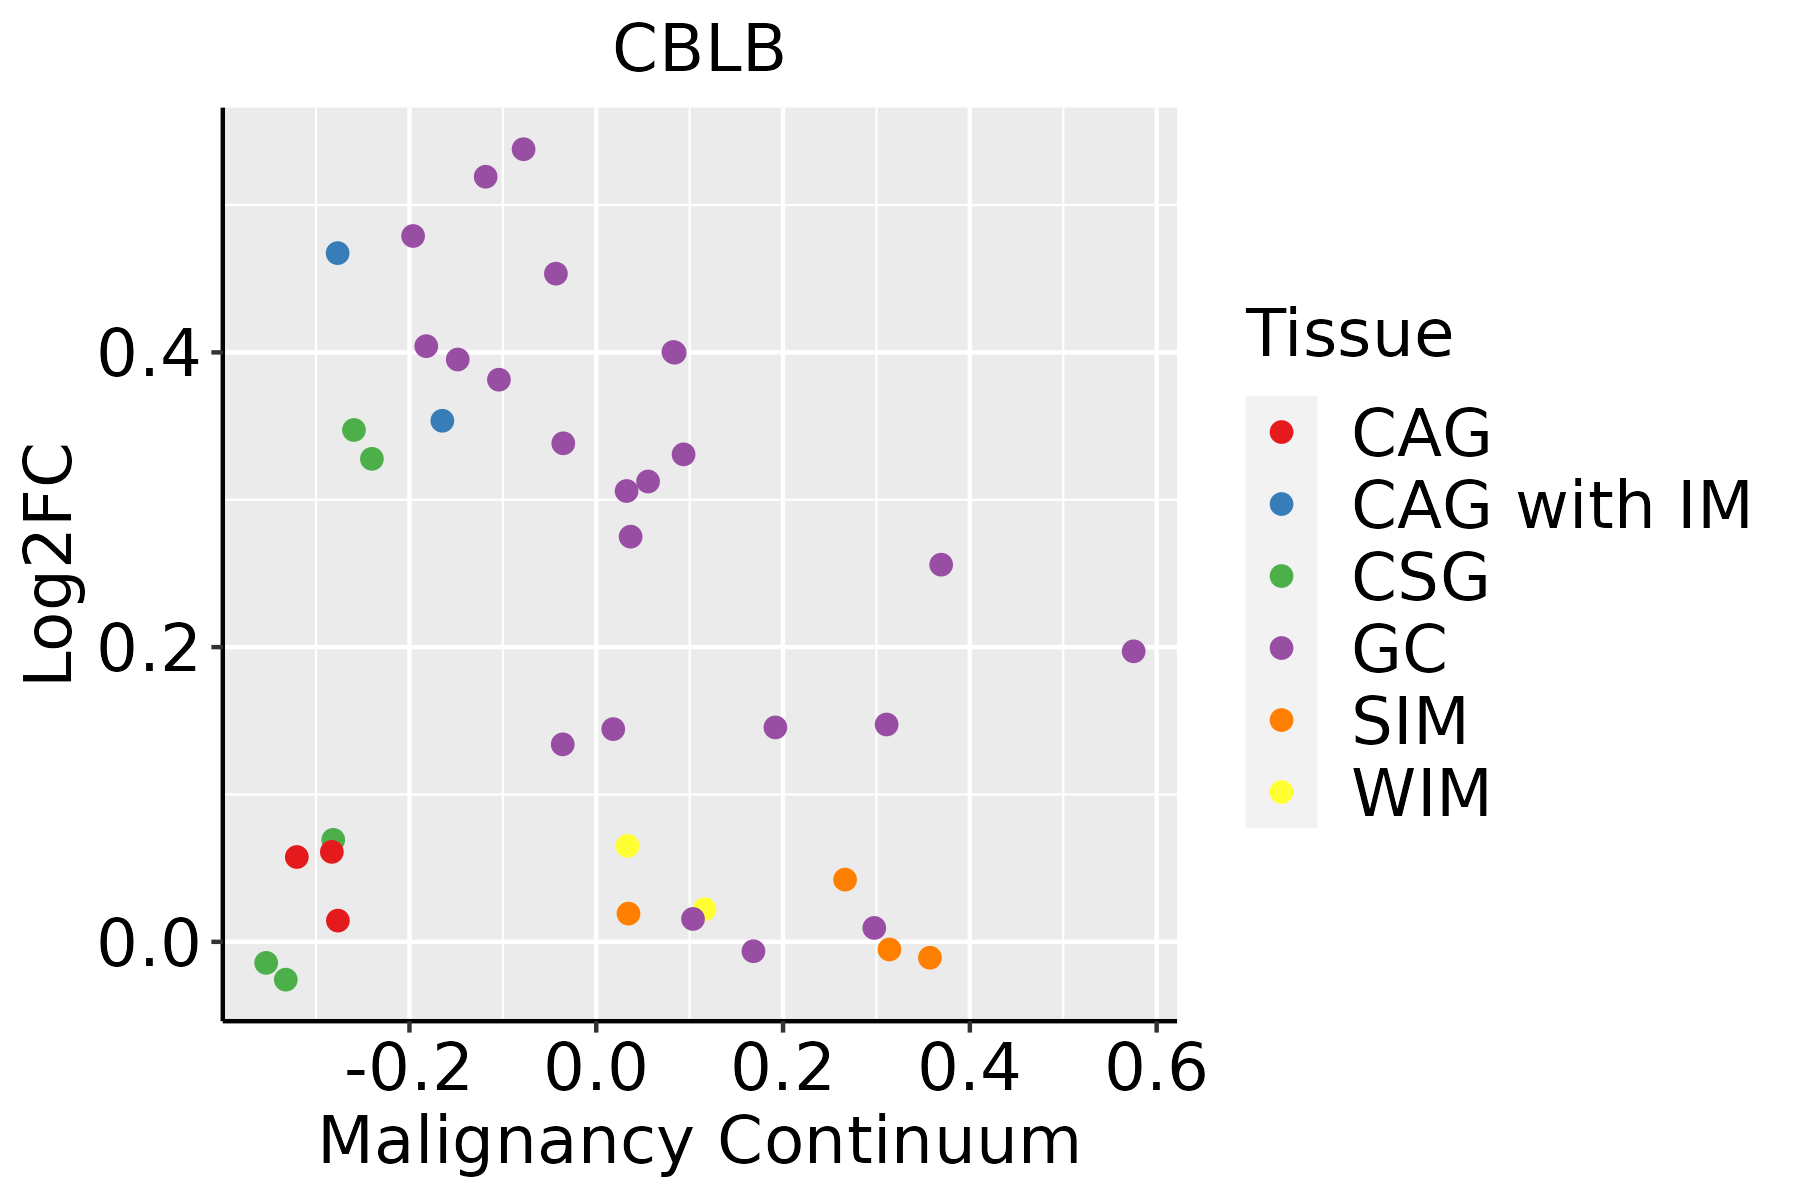 | CAG: Chronic atrophic gastritis |
| CAG with IM: Chronic atrophic gastritis with intestinal metaplasia |
| CSG: Chronic superficial gastritis |
| GC: Gastric cancer |
| SIM: Severe intestinal metaplasia |
| WIM: Wild intestinal metaplasia |
| Liver | 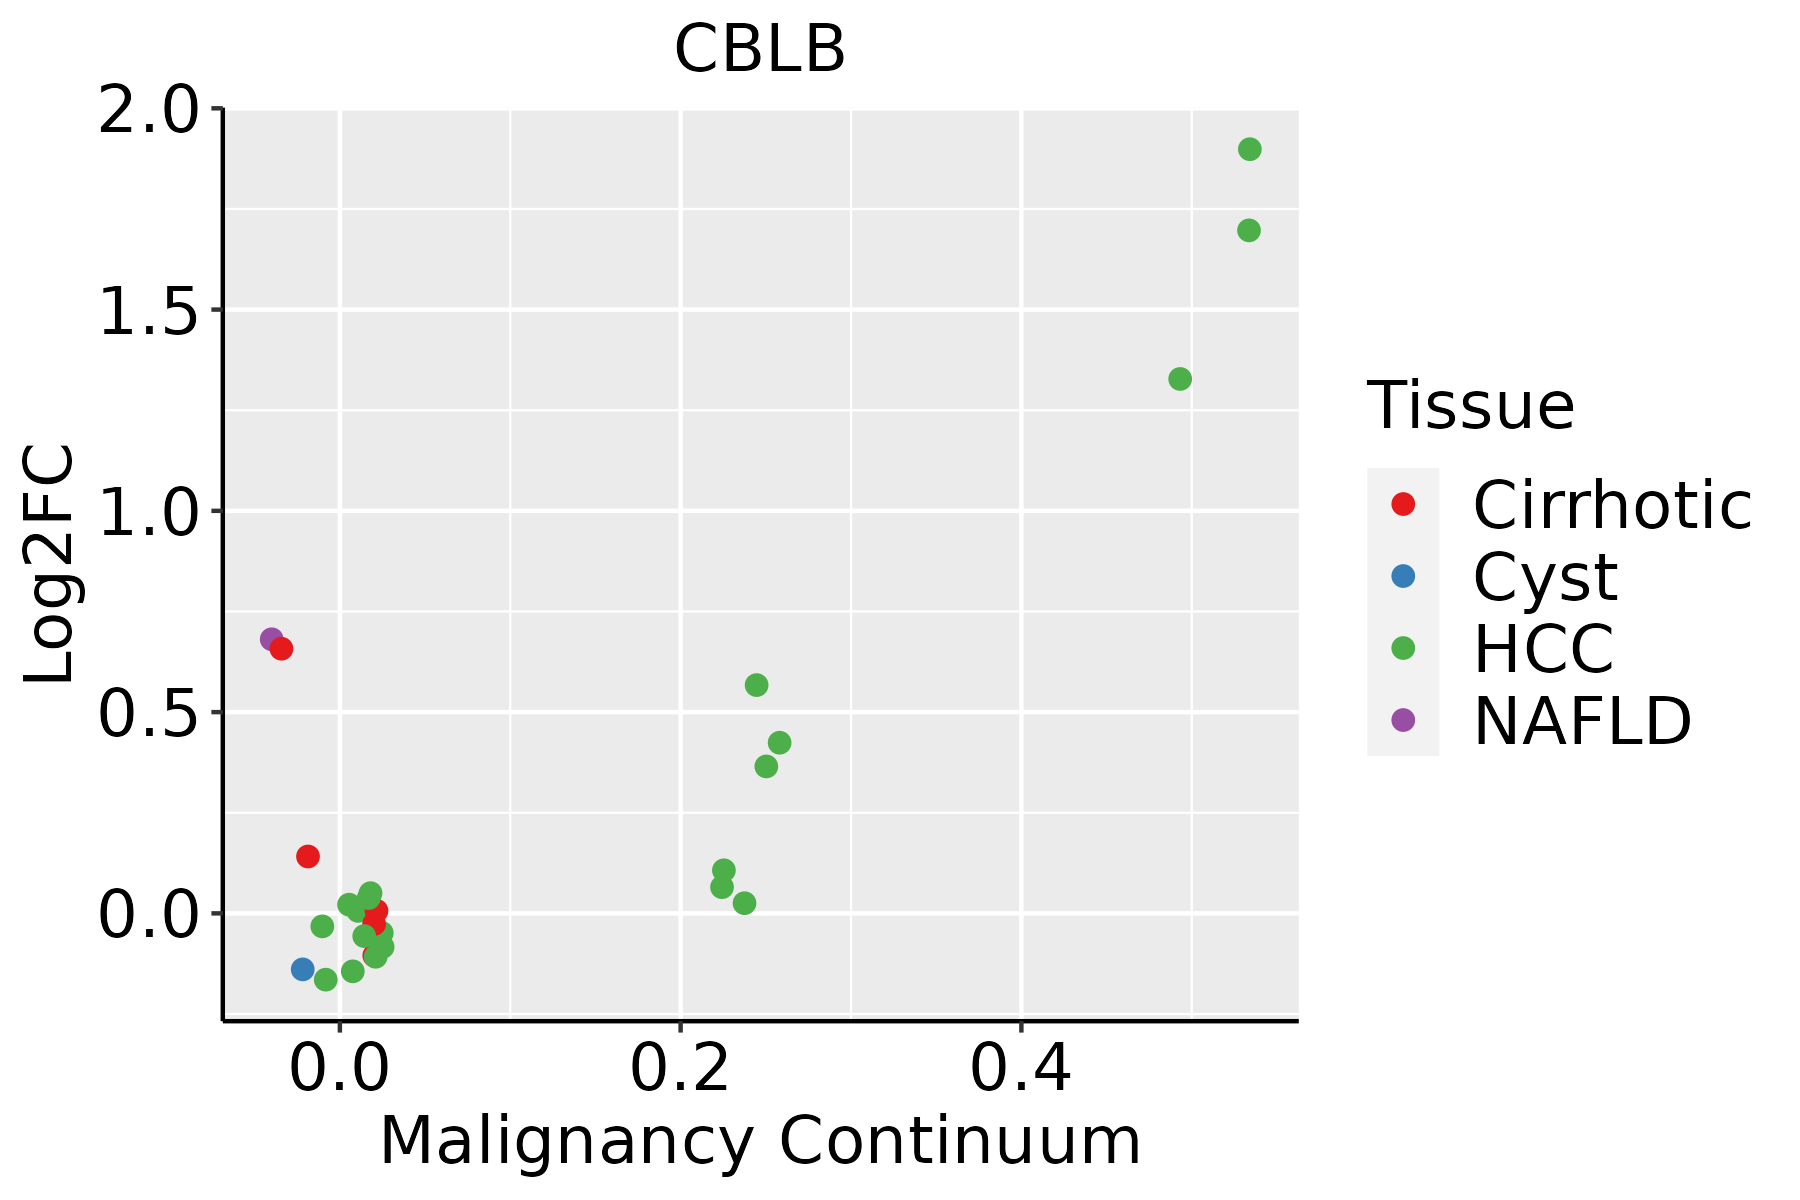 | HCC: Hepatocellular carcinoma |
| NAFLD: Non-alcoholic fatty liver disease |
| Lung |  | AAH: Atypical adenomatous hyperplasia |
| AIS: Adenocarcinoma in situ |
| IAC: Invasive lung adenocarcinoma |
| MIA: Minimally invasive adenocarcinoma |
| Oral Cavity | 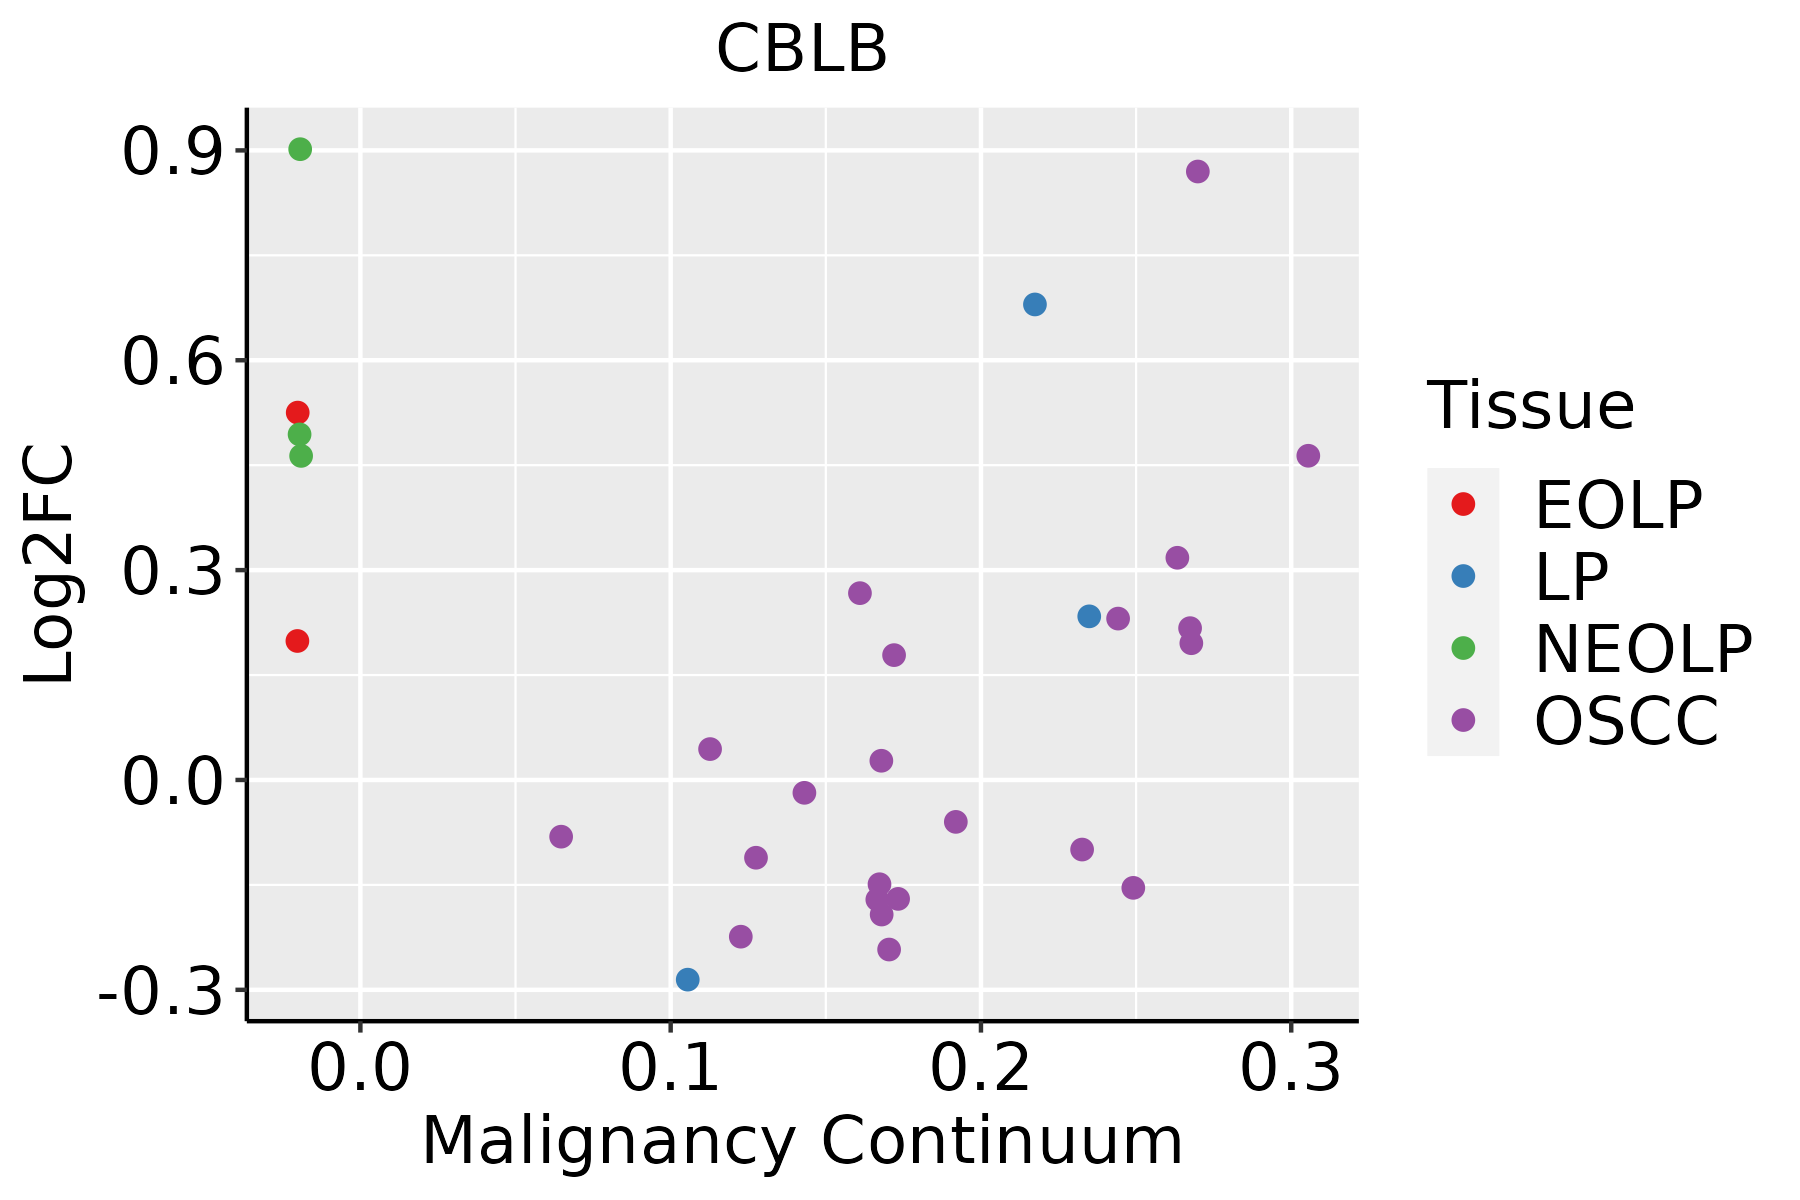 | EOLP: Erosive Oral lichen planus |
| LP: leukoplakia |
| NEOLP: Non-erosive oral lichen planus |
| OSCC: Oral squamous cell carcinoma |
| Prostate | 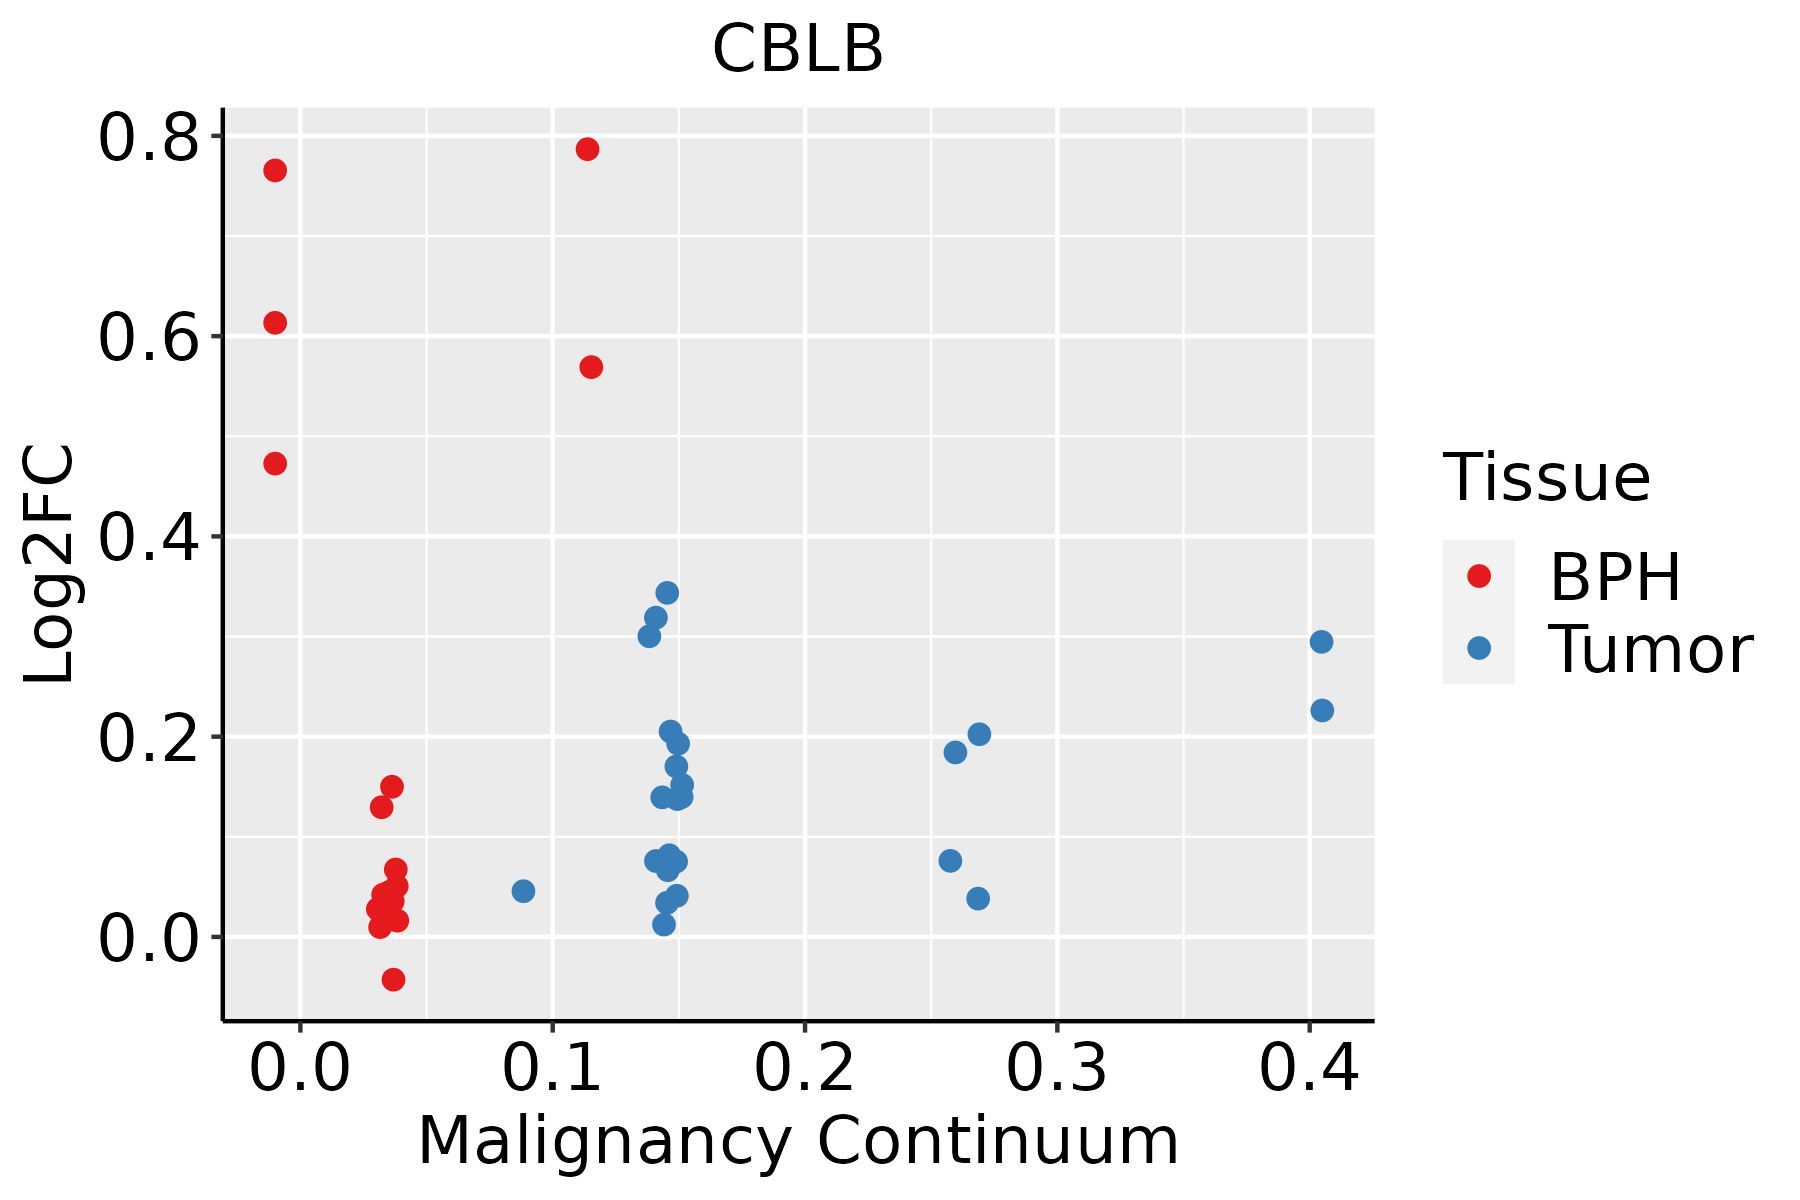 | BPH: Benign Prostatic Hyperplasia |
| Thyroid | 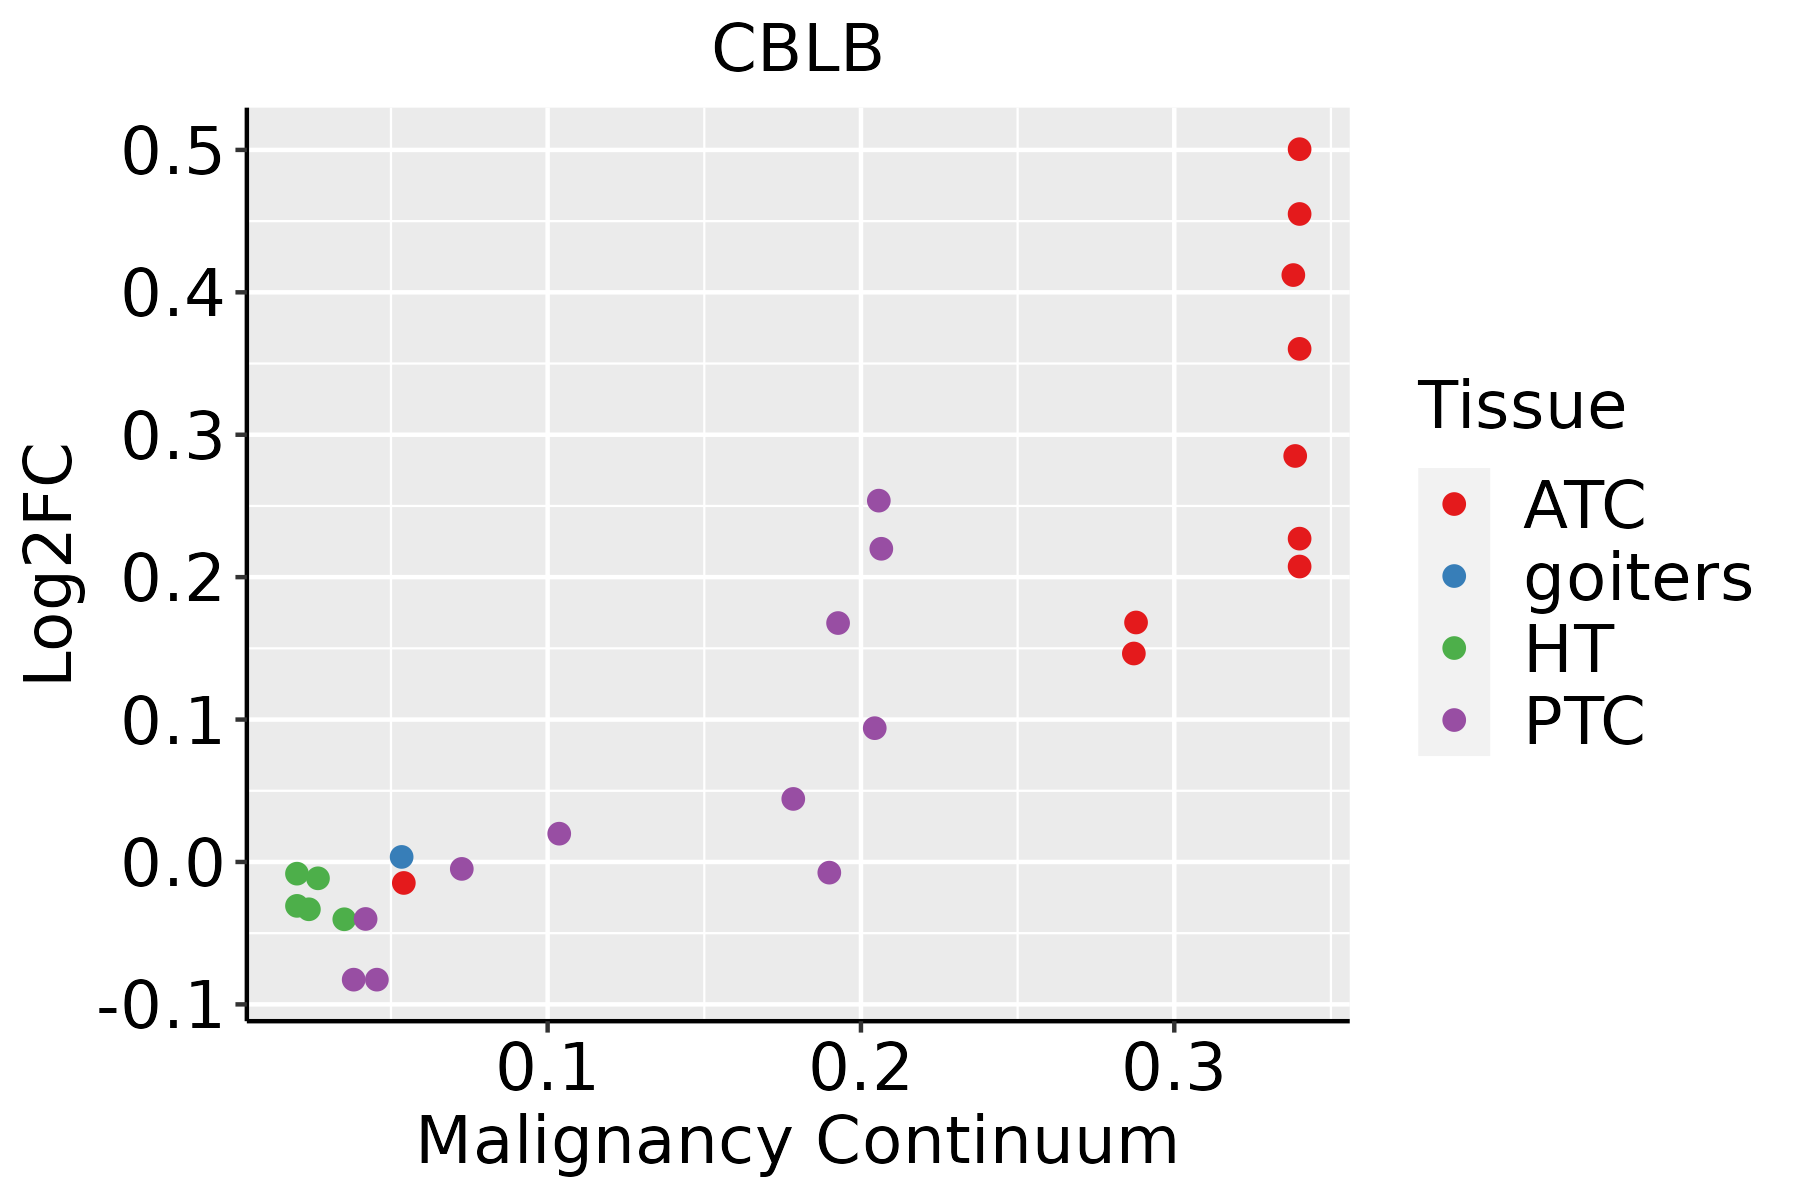 | ATC: Anaplastic thyroid cancer |
| HT: Hashimoto's thyroiditis |
| PTC: Papillary thyroid cancer |
| GO ID | Tissue | Disease Stage | Description | Gene Ratio | Bg Ratio | pvalue | p.adjust | Count |
| GO:004217610 | Cervix | CC | regulation of protein catabolic process | 104/2311 | 391/18723 | 9.39e-15 | 9.36e-12 | 104 |
| GO:004573210 | Cervix | CC | positive regulation of protein catabolic process | 65/2311 | 231/18723 | 7.44e-11 | 1.39e-08 | 65 |
| GO:00725949 | Cervix | CC | establishment of protein localization to organelle | 99/2311 | 422/18723 | 1.23e-10 | 2.11e-08 | 99 |
| GO:002240710 | Cervix | CC | regulation of cell-cell adhesion | 103/2311 | 448/18723 | 1.78e-10 | 2.87e-08 | 103 |
| GO:190332010 | Cervix | CC | regulation of protein modification by small protein conjugation or removal | 66/2311 | 242/18723 | 2.31e-10 | 3.46e-08 | 66 |
| GO:000989610 | Cervix | CC | positive regulation of catabolic process | 109/2311 | 492/18723 | 5.26e-10 | 6.99e-08 | 109 |
| GO:003139610 | Cervix | CC | regulation of protein ubiquitination | 59/2311 | 210/18723 | 5.90e-10 | 7.51e-08 | 59 |
| GO:00421108 | Cervix | CC | T cell activation | 107/2311 | 487/18723 | 1.24e-09 | 1.46e-07 | 107 |
| GO:00508638 | Cervix | CC | regulation of T cell activation | 80/2311 | 329/18723 | 1.28e-09 | 1.47e-07 | 80 |
| GO:00071598 | Cervix | CC | leukocyte cell-cell adhesion | 85/2311 | 371/18723 | 8.27e-09 | 7.07e-07 | 85 |
| GO:00071738 | Cervix | CC | epidermal growth factor receptor signaling pathway | 36/2311 | 108/18723 | 1.04e-08 | 8.44e-07 | 36 |
| GO:00071626 | Cervix | CC | negative regulation of cell adhesion | 72/2311 | 303/18723 | 2.36e-08 | 1.70e-06 | 72 |
| GO:00026837 | Cervix | CC | negative regulation of immune system process | 94/2311 | 434/18723 | 2.63e-08 | 1.87e-06 | 94 |
| GO:00069139 | Cervix | CC | nucleocytoplasmic transport | 71/2311 | 301/18723 | 4.04e-08 | 2.54e-06 | 71 |
| GO:00511699 | Cervix | CC | nuclear transport | 71/2311 | 301/18723 | 4.04e-08 | 2.54e-06 | 71 |
| GO:19030378 | Cervix | CC | regulation of leukocyte cell-cell adhesion | 77/2311 | 336/18723 | 4.08e-08 | 2.54e-06 | 77 |
| GO:00430877 | Cervix | CC | regulation of GTPase activity | 79/2311 | 348/18723 | 4.21e-08 | 2.60e-06 | 79 |
| GO:00381278 | Cervix | CC | ERBB signaling pathway | 37/2311 | 121/18723 | 8.57e-08 | 4.88e-06 | 37 |
| GO:00345048 | Cervix | CC | protein localization to nucleus | 68/2311 | 290/18723 | 9.91e-08 | 5.25e-06 | 68 |
| GO:005109810 | Cervix | CC | regulation of binding | 80/2311 | 363/18723 | 1.32e-07 | 6.42e-06 | 80 |
| Pathway ID | Tissue | Disease Stage | Description | Gene Ratio | Bg Ratio | pvalue | p.adjust | qvalue | Count |
| hsa0412014 | Cervix | CC | Ubiquitin mediated proteolysis | 49/1267 | 142/8465 | 4.26e-09 | 7.68e-08 | 4.54e-08 | 49 |
| hsa0414418 | Cervix | CC | Endocytosis | 64/1267 | 251/8465 | 6.97e-06 | 6.10e-05 | 3.61e-05 | 64 |
| hsa0401210 | Cervix | CC | ErbB signaling pathway | 28/1267 | 85/8465 | 2.40e-05 | 1.82e-04 | 1.08e-04 | 28 |
| hsa046254 | Cervix | CC | C-type lectin receptor signaling pathway | 25/1267 | 104/8465 | 9.52e-03 | 2.94e-02 | 1.74e-02 | 25 |
| hsa046604 | Cervix | CC | T cell receptor signaling pathway | 25/1267 | 104/8465 | 9.52e-03 | 2.94e-02 | 1.74e-02 | 25 |
| hsa0412015 | Cervix | CC | Ubiquitin mediated proteolysis | 49/1267 | 142/8465 | 4.26e-09 | 7.68e-08 | 4.54e-08 | 49 |
| hsa0414419 | Cervix | CC | Endocytosis | 64/1267 | 251/8465 | 6.97e-06 | 6.10e-05 | 3.61e-05 | 64 |
| hsa0401213 | Cervix | CC | ErbB signaling pathway | 28/1267 | 85/8465 | 2.40e-05 | 1.82e-04 | 1.08e-04 | 28 |
| hsa0462511 | Cervix | CC | C-type lectin receptor signaling pathway | 25/1267 | 104/8465 | 9.52e-03 | 2.94e-02 | 1.74e-02 | 25 |
| hsa0466011 | Cervix | CC | T cell receptor signaling pathway | 25/1267 | 104/8465 | 9.52e-03 | 2.94e-02 | 1.74e-02 | 25 |
| hsa04012 | Colorectum | AD | ErbB signaling pathway | 31/2092 | 85/8465 | 1.02e-02 | 3.91e-02 | 2.50e-02 | 31 |
| hsa040121 | Colorectum | AD | ErbB signaling pathway | 31/2092 | 85/8465 | 1.02e-02 | 3.91e-02 | 2.50e-02 | 31 |
| hsa041442 | Colorectum | SER | Endocytosis | 81/1580 | 251/8465 | 1.14e-07 | 2.36e-06 | 1.71e-06 | 81 |
| hsa041202 | Colorectum | SER | Ubiquitin mediated proteolysis | 39/1580 | 142/8465 | 6.18e-03 | 3.66e-02 | 2.66e-02 | 39 |
| hsa041443 | Colorectum | SER | Endocytosis | 81/1580 | 251/8465 | 1.14e-07 | 2.36e-06 | 1.71e-06 | 81 |
| hsa041203 | Colorectum | SER | Ubiquitin mediated proteolysis | 39/1580 | 142/8465 | 6.18e-03 | 3.66e-02 | 2.66e-02 | 39 |
| hsa041444 | Colorectum | MSS | Endocytosis | 102/1875 | 251/8465 | 1.85e-11 | 4.43e-10 | 2.71e-10 | 102 |
| hsa041204 | Colorectum | MSS | Ubiquitin mediated proteolysis | 55/1875 | 142/8465 | 5.02e-06 | 6.00e-05 | 3.68e-05 | 55 |
| hsa040122 | Colorectum | MSS | ErbB signaling pathway | 30/1875 | 85/8465 | 3.73e-03 | 1.67e-02 | 1.02e-02 | 30 |
| hsa041445 | Colorectum | MSS | Endocytosis | 102/1875 | 251/8465 | 1.85e-11 | 4.43e-10 | 2.71e-10 | 102 |
| Hugo Symbol | Variant Class | Variant Classification | dbSNP RS | HGVSc | HGVSp | HGVSp Short | SWISSPROT | BIOTYPE | SIFT | PolyPhen | Tumor Sample Barcode | Tissue | Histology | Sex | Age | Stage | Therapy Types | Drugs | Outcome |
| CBLB | SNV | Missense_Mutation | | c.422G>A | p.Arg141Gln | p.R141Q | Q13191 | protein_coding | deleterious(0.01) | probably_damaging(0.997) | TCGA-A7-A0CJ-01 | Breast | breast invasive carcinoma | Female | <65 | I/II | Chemotherapy | cytoxan | SD |
| CBLB | SNV | Missense_Mutation | | c.1753N>A | p.Asp585Asn | p.D585N | Q13191 | protein_coding | tolerated_low_confidence(0.06) | benign(0.001) | TCGA-A8-A09Q-01 | Breast | breast invasive carcinoma | Female | >=65 | III/IV | Hormone Therapy | anastrozole | SD |
| CBLB | SNV | Missense_Mutation | rs748390313 | c.2200N>T | p.Arg734Trp | p.R734W | Q13191 | protein_coding | tolerated_low_confidence(0.06) | probably_damaging(0.936) | TCGA-AN-A046-01 | Breast | breast invasive carcinoma | Female | >=65 | I/II | Unknown | Unknown | SD |
| CBLB | SNV | Missense_Mutation | novel | c.68N>G | p.Leu23Trp | p.L23W | Q13191 | protein_coding | deleterious_low_confidence(0) | probably_damaging(0.994) | TCGA-AN-A046-01 | Breast | breast invasive carcinoma | Female | >=65 | I/II | Unknown | Unknown | SD |
| CBLB | SNV | Missense_Mutation | | c.229N>G | p.Ile77Val | p.I77V | Q13191 | protein_coding | deleterious(0.02) | possibly_damaging(0.876) | TCGA-AO-A03L-01 | Breast | breast invasive carcinoma | Female | <65 | III/IV | Chemotherapy | cyclophosphamide | SD |
| CBLB | SNV | Missense_Mutation | | c.769C>T | p.His257Tyr | p.H257Y | Q13191 | protein_coding | deleterious(0) | probably_damaging(1) | TCGA-AR-A251-01 | Breast | breast invasive carcinoma | Female | <65 | III/IV | Chemotherapy | doxorubicin | SD |
| CBLB | SNV | Missense_Mutation | | c.952N>G | p.Gln318Glu | p.Q318E | Q13191 | protein_coding | deleterious(0) | possibly_damaging(0.833) | TCGA-B6-A0IK-01 | Breast | breast invasive carcinoma | Female | <65 | III/IV | Unknown | Unknown | PD |
| CBLB | SNV | Missense_Mutation | | c.1210G>A | p.Asp404Asn | p.D404N | Q13191 | protein_coding | deleterious(0.04) | probably_damaging(0.95) | TCGA-BH-A0B5-01 | Breast | breast invasive carcinoma | Female | <65 | III/IV | Chemotherapy | adriamycin | CR |
| CBLB | SNV | Missense_Mutation | | c.2483C>T | p.Ala828Val | p.A828V | Q13191 | protein_coding | tolerated_low_confidence(0.4) | benign(0.116) | TCGA-BH-A0C1-01 | Breast | breast invasive carcinoma | Female | <65 | III/IV | Chemotherapy | adriamycin | PD |
| CBLB | SNV | Missense_Mutation | | c.1073N>G | p.Glu358Gly | p.E358G | Q13191 | protein_coding | deleterious(0) | benign(0.241) | TCGA-BH-A0DK-01 | Breast | breast invasive carcinoma | Female | <65 | I/II | Hormone Therapy | tamoxiphen | SD |


