| Tissue | Expression Dynamics | Abbreviation |
| Cervix | 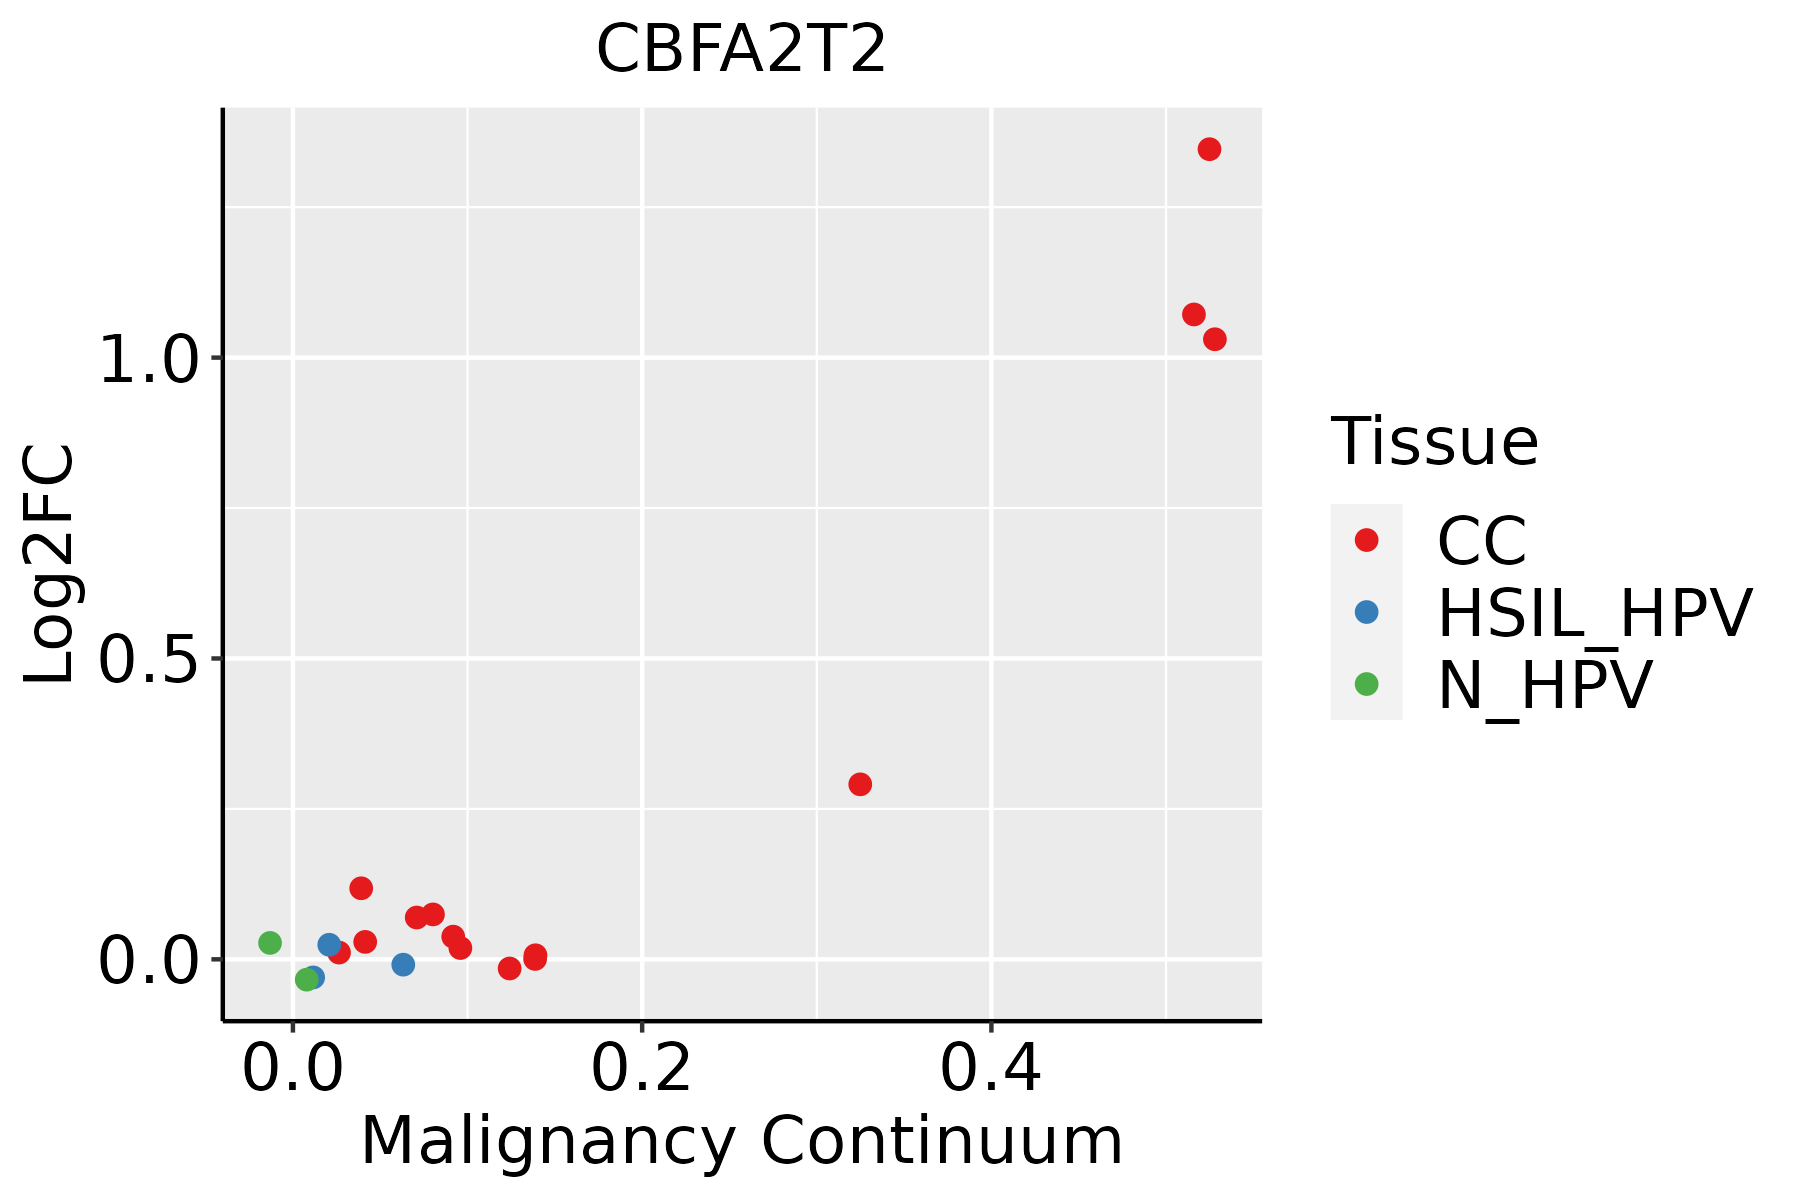 | CC: Cervix cancer |
| HSIL_HPV: HPV-infected high-grade squamous intraepithelial lesions |
| N_HPV: HPV-infected normal cervix |
| Colorectum (GSE201348) |  | FAP: Familial adenomatous polyposis |
| CRC: Colorectal cancer |
| Colorectum (HTA11) | 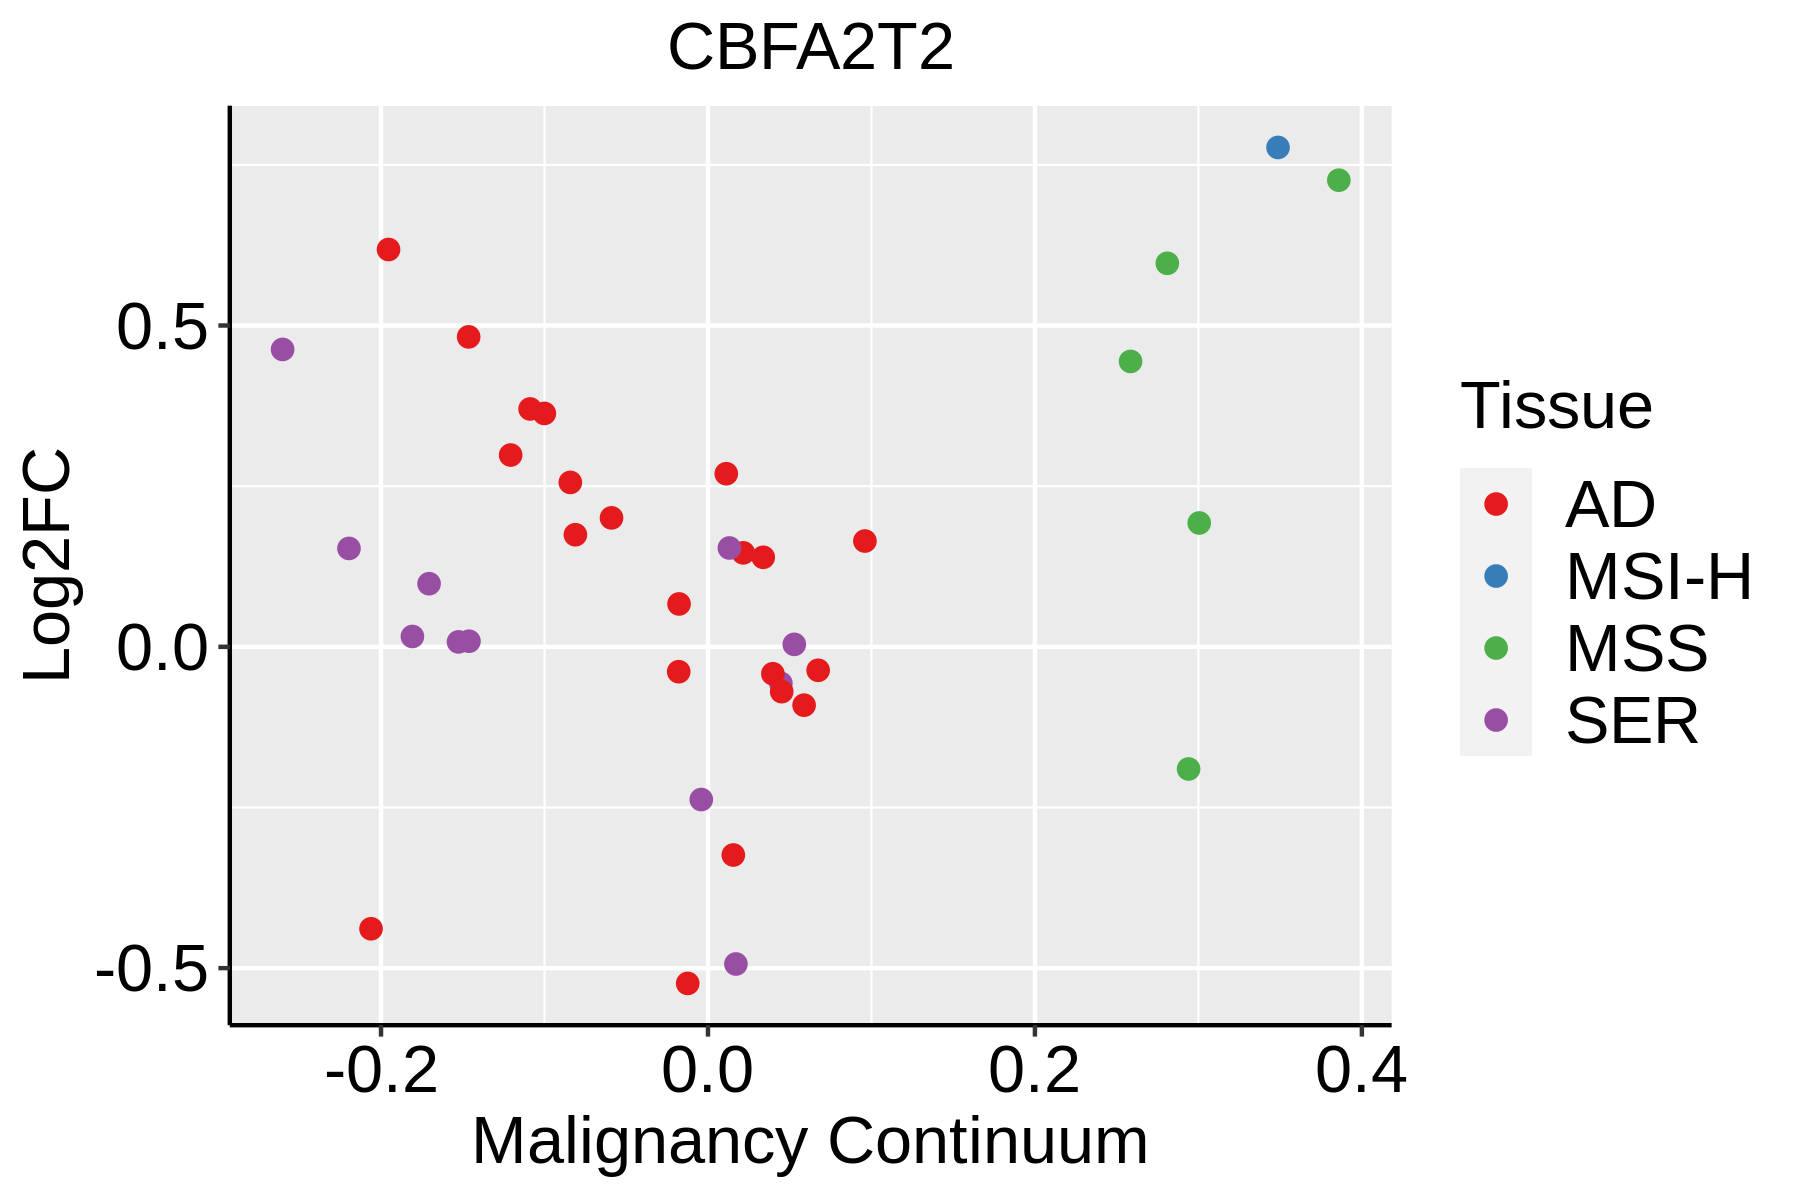 | AD: Adenomas |
| SER: Sessile serrated lesions |
| MSI-H: Microsatellite-high colorectal cancer |
| MSS: Microsatellite stable colorectal cancer |
| Endometrium |  | AEH: Atypical endometrial hyperplasia |
| EEC: Endometrioid Cancer |
| Esophagus |  | ESCC: Esophageal squamous cell carcinoma |
| HGIN: High-grade intraepithelial neoplasias |
| LGIN: Low-grade intraepithelial neoplasias |
| Liver | 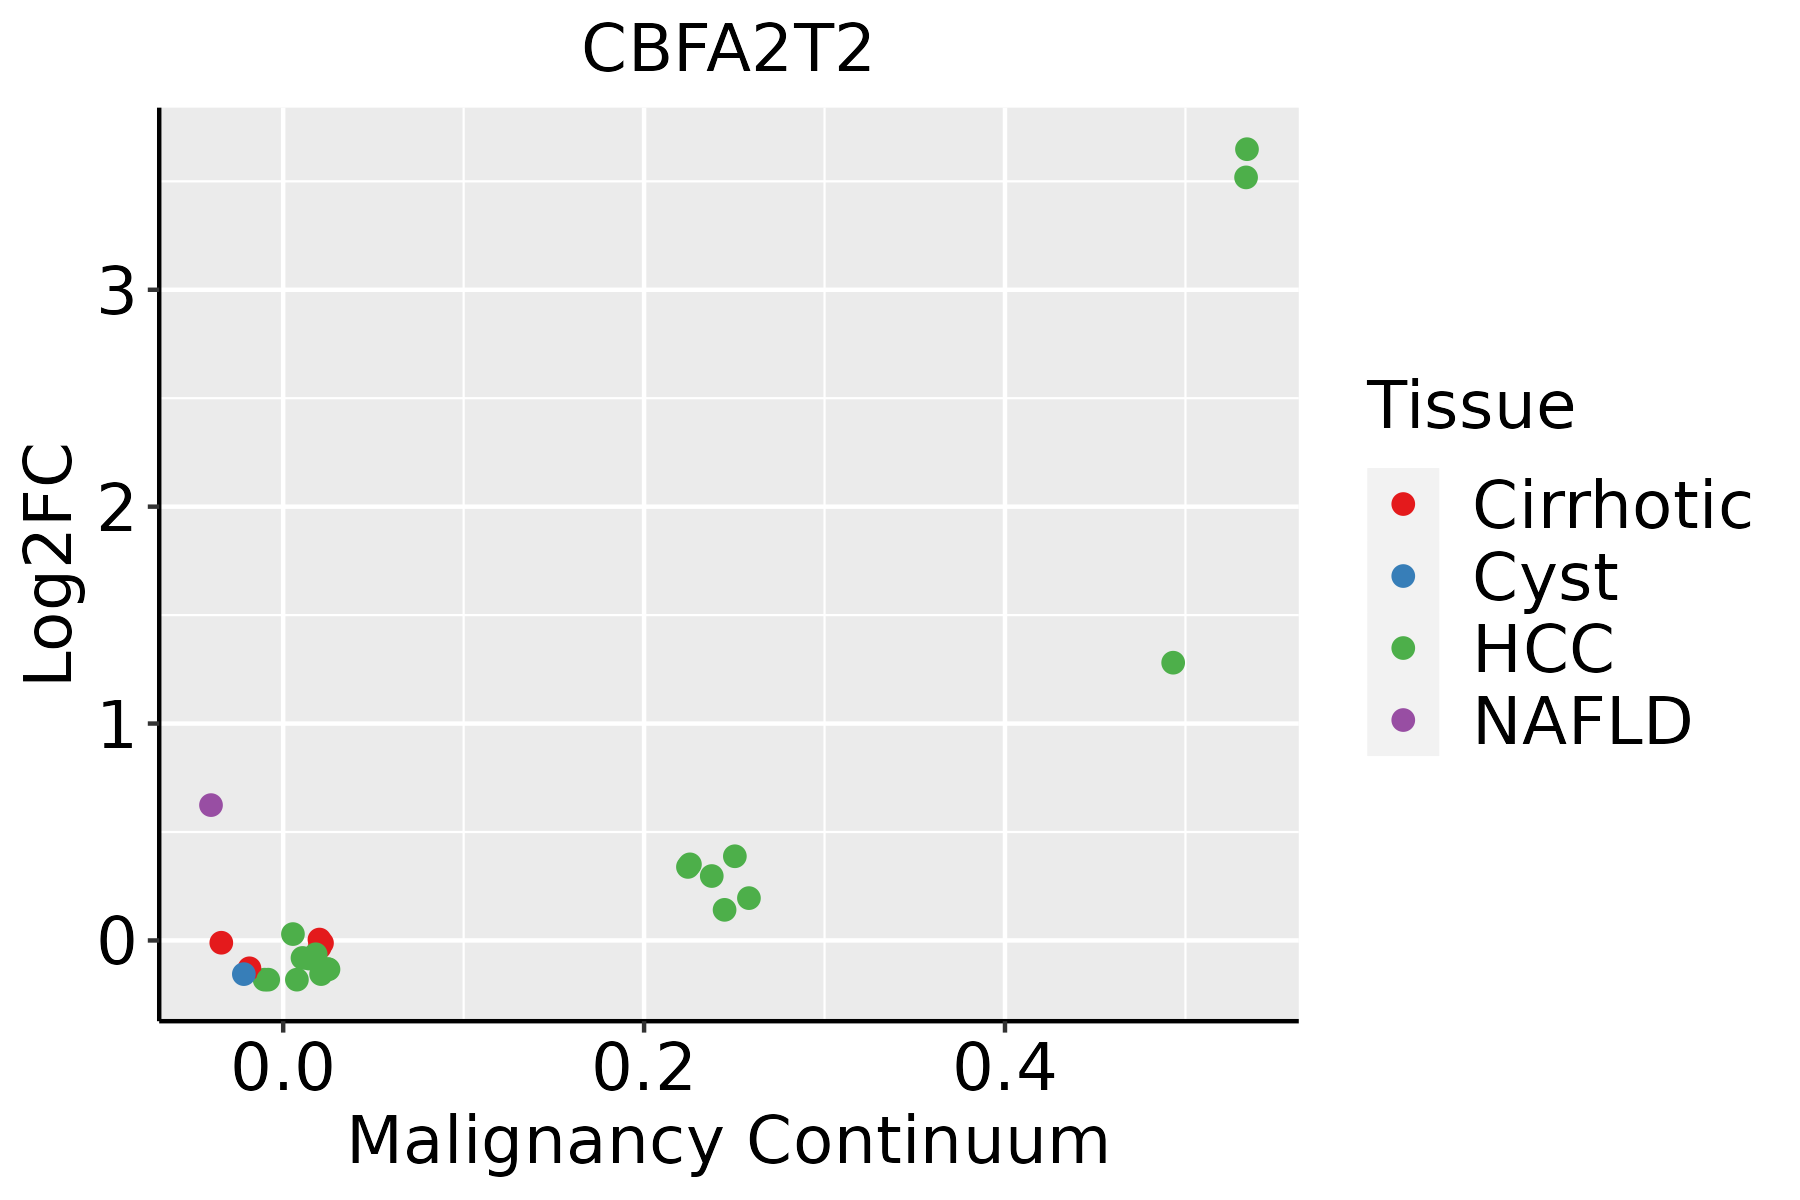 | HCC: Hepatocellular carcinoma |
| NAFLD: Non-alcoholic fatty liver disease |
| Lung | 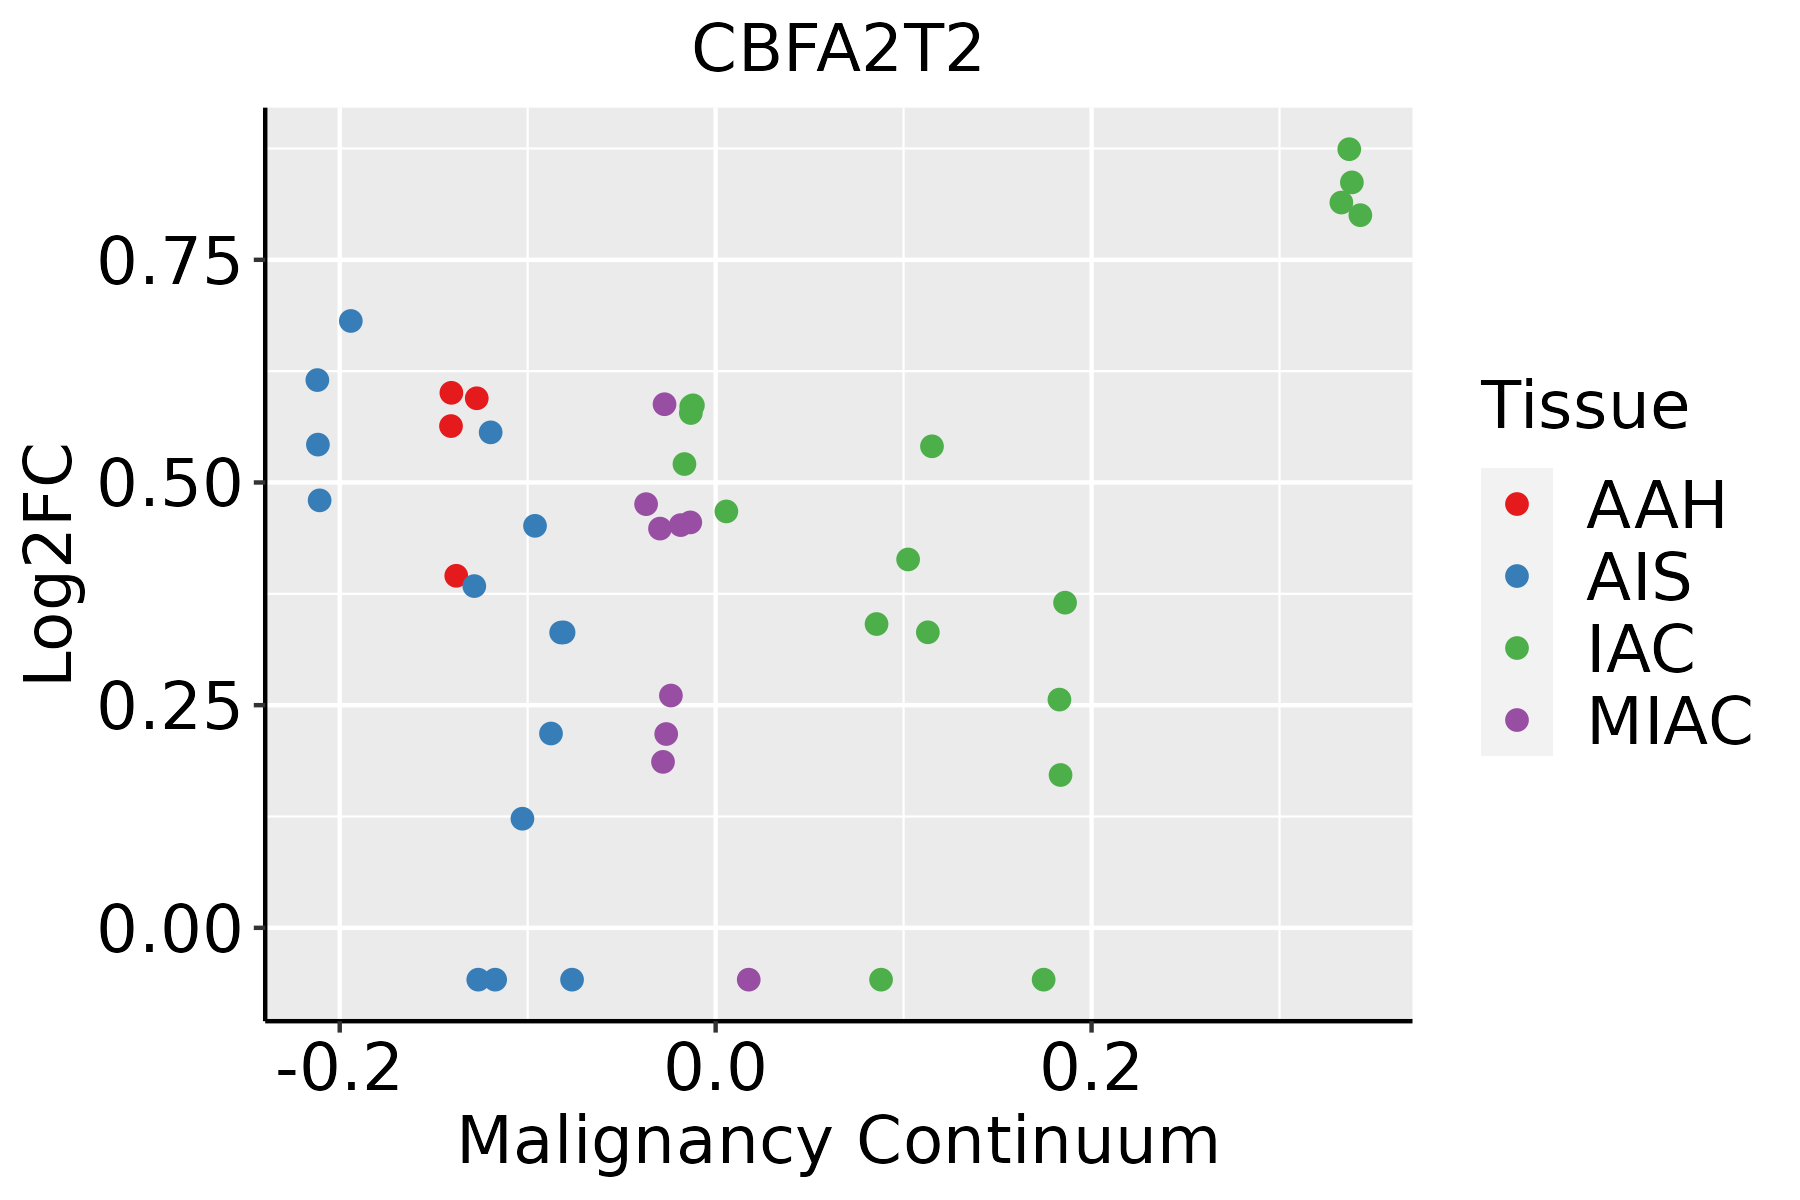 | AAH: Atypical adenomatous hyperplasia |
| AIS: Adenocarcinoma in situ |
| IAC: Invasive lung adenocarcinoma |
| MIA: Minimally invasive adenocarcinoma |
| Oral Cavity | 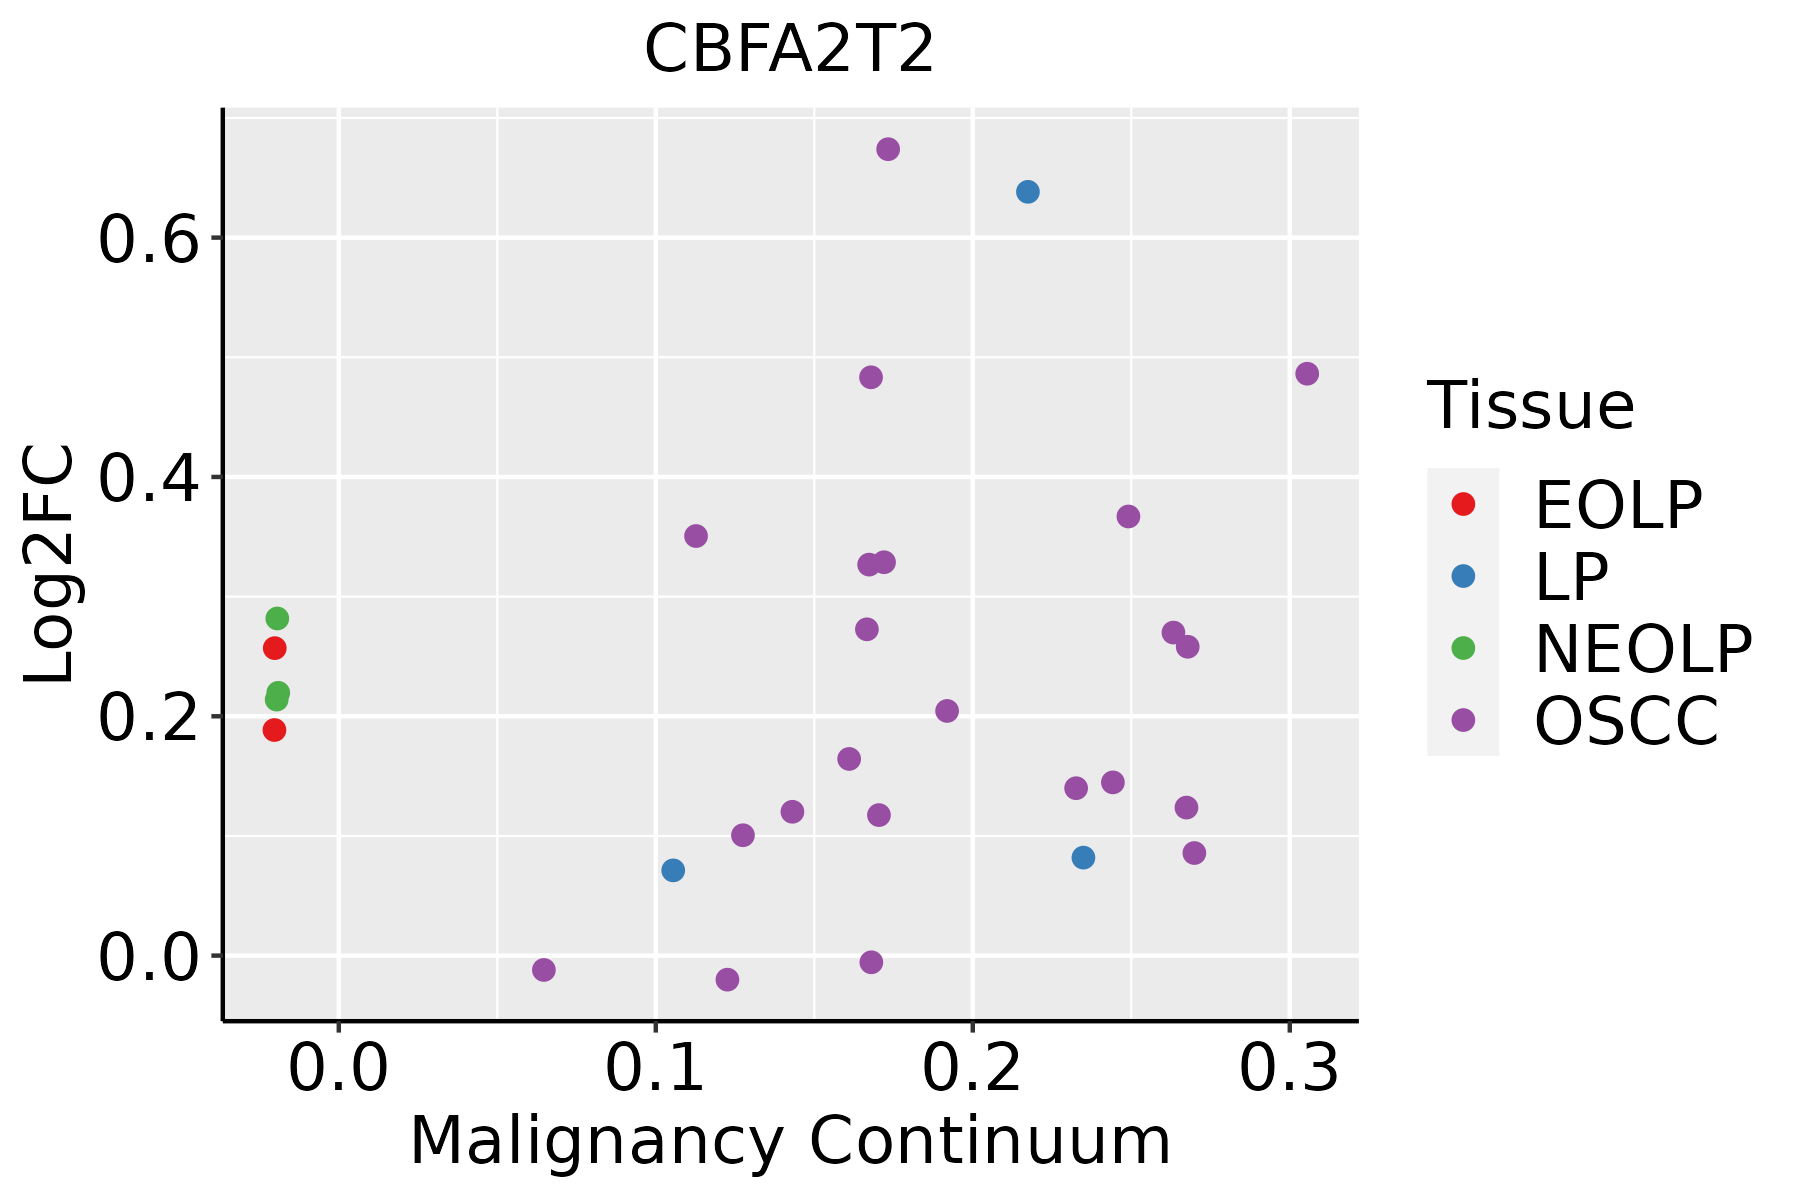 | EOLP: Erosive Oral lichen planus |
| LP: leukoplakia |
| NEOLP: Non-erosive oral lichen planus |
| OSCC: Oral squamous cell carcinoma |
| Thyroid |  | ATC: Anaplastic thyroid cancer |
| HT: Hashimoto's thyroiditis |
| PTC: Papillary thyroid cancer |
| GO ID | Tissue | Disease Stage | Description | Gene Ratio | Bg Ratio | pvalue | p.adjust | Count |
| GO:00109757 | Cervix | CC | regulation of neuron projection development | 88/2311 | 445/18723 | 4.26e-06 | 1.09e-04 | 88 |
| GO:00313467 | Cervix | CC | positive regulation of cell projection organization | 72/2311 | 353/18723 | 1.04e-05 | 2.32e-04 | 72 |
| GO:00072194 | Cervix | CC | Notch signaling pathway | 39/2311 | 172/18723 | 1.08e-04 | 1.38e-03 | 39 |
| GO:00085933 | Cervix | CC | regulation of Notch signaling pathway | 25/2311 | 95/18723 | 1.61e-04 | 1.93e-03 | 25 |
| GO:00313456 | Cervix | CC | negative regulation of cell projection organization | 39/2311 | 186/18723 | 5.86e-04 | 5.57e-03 | 39 |
| GO:00109775 | Cervix | CC | negative regulation of neuron projection development | 28/2311 | 137/18723 | 4.74e-03 | 2.83e-02 | 28 |
| GO:0010975 | Colorectum | AD | regulation of neuron projection development | 129/3918 | 445/18723 | 2.88e-05 | 5.37e-04 | 129 |
| GO:0031346 | Colorectum | AD | positive regulation of cell projection organization | 104/3918 | 353/18723 | 8.26e-05 | 1.30e-03 | 104 |
| GO:0031345 | Colorectum | AD | negative regulation of cell projection organization | 58/3918 | 186/18723 | 6.37e-04 | 6.58e-03 | 58 |
| GO:0010977 | Colorectum | AD | negative regulation of neuron projection development | 43/3918 | 137/18723 | 2.60e-03 | 1.97e-02 | 43 |
| GO:0007219 | Colorectum | AD | Notch signaling pathway | 50/3918 | 172/18723 | 6.92e-03 | 4.26e-02 | 50 |
| GO:00313462 | Colorectum | MSS | positive regulation of cell projection organization | 96/3467 | 353/18723 | 3.44e-05 | 6.70e-04 | 96 |
| GO:00109752 | Colorectum | MSS | regulation of neuron projection development | 115/3467 | 445/18723 | 6.91e-05 | 1.20e-03 | 115 |
| GO:00313452 | Colorectum | MSS | negative regulation of cell projection organization | 54/3467 | 186/18723 | 3.03e-04 | 3.96e-03 | 54 |
| GO:00109771 | Colorectum | MSS | negative regulation of neuron projection development | 39/3467 | 137/18723 | 2.86e-03 | 2.22e-02 | 39 |
| GO:00109753 | Colorectum | FAP | regulation of neuron projection development | 102/2622 | 445/18723 | 2.04e-07 | 1.24e-05 | 102 |
| GO:00313463 | Colorectum | FAP | positive regulation of cell projection organization | 82/2622 | 353/18723 | 1.78e-06 | 7.35e-05 | 82 |
| GO:00313453 | Colorectum | FAP | negative regulation of cell projection organization | 44/2622 | 186/18723 | 2.69e-04 | 3.64e-03 | 44 |
| GO:00109772 | Colorectum | FAP | negative regulation of neuron projection development | 33/2622 | 137/18723 | 1.07e-03 | 1.04e-02 | 33 |
| GO:00072191 | Colorectum | FAP | Notch signaling pathway | 38/2622 | 172/18723 | 2.56e-03 | 2.01e-02 | 38 |
| Hugo Symbol | Variant Class | Variant Classification | dbSNP RS | HGVSc | HGVSp | HGVSp Short | SWISSPROT | BIOTYPE | SIFT | PolyPhen | Tumor Sample Barcode | Tissue | Histology | Sex | Age | Stage | Therapy Types | Drugs | Outcome |
| CBFA2T2 | SNV | Missense_Mutation | | c.406N>A | p.Glu136Lys | p.E136K | O43439 | protein_coding | deleterious(0) | probably_damaging(0.992) | TCGA-A2-A0CX-01 | Breast | breast invasive carcinoma | Female | <65 | I/II | Chemotherapy | adriamycin | SD |
| CBFA2T2 | SNV | Missense_Mutation | novel | c.1434G>A | p.Met478Ile | p.M478I | O43439 | protein_coding | deleterious(0.02) | possibly_damaging(0.885) | TCGA-AC-A23H-01 | Breast | breast invasive carcinoma | Female | >=65 | I/II | Unknown | Unknown | PD |
| CBFA2T2 | SNV | Missense_Mutation | novel | c.1774N>G | p.Thr592Ala | p.T592A | O43439 | protein_coding | deleterious_low_confidence(0.01) | benign(0.031) | TCGA-AN-A046-01 | Breast | breast invasive carcinoma | Female | >=65 | I/II | Unknown | Unknown | SD |
| CBFA2T2 | SNV | Missense_Mutation | novel | c.1384G>A | p.Glu462Lys | p.E462K | O43439 | protein_coding | tolerated(0.11) | possibly_damaging(0.76) | TCGA-BH-A2L8-01 | Breast | breast invasive carcinoma | Female | <65 | I/II | Chemotherapy | cytoxan | CR |
| CBFA2T2 | SNV | Missense_Mutation | | c.1114C>G | p.Leu372Val | p.L372V | O43439 | protein_coding | deleterious(0) | probably_damaging(0.994) | TCGA-GM-A2D9-01 | Breast | breast invasive carcinoma | Female | >=65 | I/II | Hormone Therapy | arimidex | SD |
| CBFA2T2 | SNV | Missense_Mutation | novel | c.1570N>A | p.Ala524Thr | p.A524T | O43439 | protein_coding | deleterious(0) | probably_damaging(0.997) | TCGA-2W-A8YY-01 | Cervix | cervical & endocervical cancer | Female | <65 | I/II | Chemotherapy | cisplatin | CR |
| CBFA2T2 | SNV | Missense_Mutation | novel | c.760N>A | p.Glu254Lys | p.E254K | O43439 | protein_coding | tolerated(0.06) | probably_damaging(0.98) | TCGA-C5-A8XJ-01 | Cervix | cervical & endocervical cancer | Female | >=65 | I/II | Chemotherapy | cisplatin | SD |
| CBFA2T2 | SNV | Missense_Mutation | | c.1255N>A | p.Asp419Asn | p.D419N | O43439 | protein_coding | deleterious(0.04) | benign(0.001) | TCGA-JW-A5VL-01 | Cervix | cervical & endocervical cancer | Female | <65 | I/II | Unknown | Unknown | SD |
| CBFA2T2 | SNV | Missense_Mutation | | c.425N>T | p.Arg142Leu | p.R142L | O43439 | protein_coding | deleterious(0) | probably_damaging(0.992) | TCGA-VS-A94Z-01 | Cervix | cervical & endocervical cancer | Female | <65 | I/II | Chemotherapy | cisplatin | CR |
| CBFA2T2 | SNV | Missense_Mutation | | c.1687N>A | p.Gly563Ser | p.G563S | O43439 | protein_coding | tolerated(0.36) | benign(0.033) | TCGA-A6-6648-01 | Colorectum | colon adenocarcinoma | Male | <65 | I/II | Chemotherapy | oxaliplatin | PD |


