
|
|||||
|
 | |
| |
| |
| |
| |
| |
|
Gene: CAVIN1 |
Gene summary for CAVIN1 |
| Gene information | Species | Human | Gene symbol | CAVIN1 | Gene ID | 284119 |
| Gene name | caveolae associated protein 1 | |
| Gene Alias | CAVIN | |
| Cytomap | 17q21.2 | |
| Gene Type | protein-coding | GO ID | GO:0006139 | UniProtAcc | Q6NZI2 |
Top |
Malignant transformation analysis |
| Identification of the aberrant gene expression in precancerous and cancerous lesions by comparing the gene expression of stem-like cells in diseased tissues with normal stem cells |
| Entrez ID | Symbol | Replicates | Species | Organ | Tissue | Adj P-value | Log2FC | Malignancy |
| 284119 | CAVIN1 | GSM4909281 | Human | Breast | IDC | 1.74e-05 | 2.12e-01 | 0.21 |
| 284119 | CAVIN1 | GSM4909285 | Human | Breast | IDC | 5.74e-08 | 1.96e-01 | 0.21 |
| 284119 | CAVIN1 | GSM4909286 | Human | Breast | IDC | 2.60e-39 | 6.61e-01 | 0.1081 |
| 284119 | CAVIN1 | GSM4909291 | Human | Breast | IDC | 3.48e-03 | -2.65e-01 | 0.1753 |
| 284119 | CAVIN1 | GSM4909293 | Human | Breast | IDC | 2.44e-04 | -2.43e-01 | 0.1581 |
| 284119 | CAVIN1 | GSM4909294 | Human | Breast | IDC | 4.58e-08 | -2.80e-01 | 0.2022 |
| 284119 | CAVIN1 | GSM4909295 | Human | Breast | IDC | 2.07e-02 | 4.37e-01 | 0.0898 |
| 284119 | CAVIN1 | GSM4909296 | Human | Breast | IDC | 2.15e-08 | -2.75e-01 | 0.1524 |
| 284119 | CAVIN1 | GSM4909297 | Human | Breast | IDC | 6.26e-06 | -2.40e-01 | 0.1517 |
| 284119 | CAVIN1 | GSM4909298 | Human | Breast | IDC | 2.14e-06 | -2.73e-01 | 0.1551 |
| 284119 | CAVIN1 | GSM4909301 | Human | Breast | IDC | 3.41e-08 | -2.81e-01 | 0.1577 |
| 284119 | CAVIN1 | GSM4909304 | Human | Breast | IDC | 4.16e-08 | -2.84e-01 | 0.1636 |
| 284119 | CAVIN1 | GSM4909308 | Human | Breast | IDC | 1.98e-07 | -2.77e-01 | 0.158 |
| 284119 | CAVIN1 | GSM4909311 | Human | Breast | IDC | 1.97e-07 | -2.61e-01 | 0.1534 |
| 284119 | CAVIN1 | GSM4909312 | Human | Breast | IDC | 7.71e-11 | -2.87e-01 | 0.1552 |
| 284119 | CAVIN1 | GSM4909315 | Human | Breast | IDC | 3.75e-09 | -2.78e-01 | 0.21 |
| 284119 | CAVIN1 | GSM4909316 | Human | Breast | IDC | 2.15e-02 | -2.87e-01 | 0.21 |
| 284119 | CAVIN1 | GSM4909319 | Human | Breast | IDC | 8.48e-10 | -2.79e-01 | 0.1563 |
| 284119 | CAVIN1 | GSM4909320 | Human | Breast | IDC | 4.54e-03 | -2.87e-01 | 0.1575 |
| 284119 | CAVIN1 | GSM4909321 | Human | Breast | IDC | 1.69e-10 | -2.87e-01 | 0.1559 |
| Page: 1 2 3 4 5 6 7 |
| Tissue | Expression Dynamics | Abbreviation |
| Breast |  | IDC: Invasive ductal carcinoma |
| DCIS: Ductal carcinoma in situ | ||
| Precancer(BRCA1-mut): Precancerous lesion from BRCA1 mutation carriers | ||
| Endometrium | 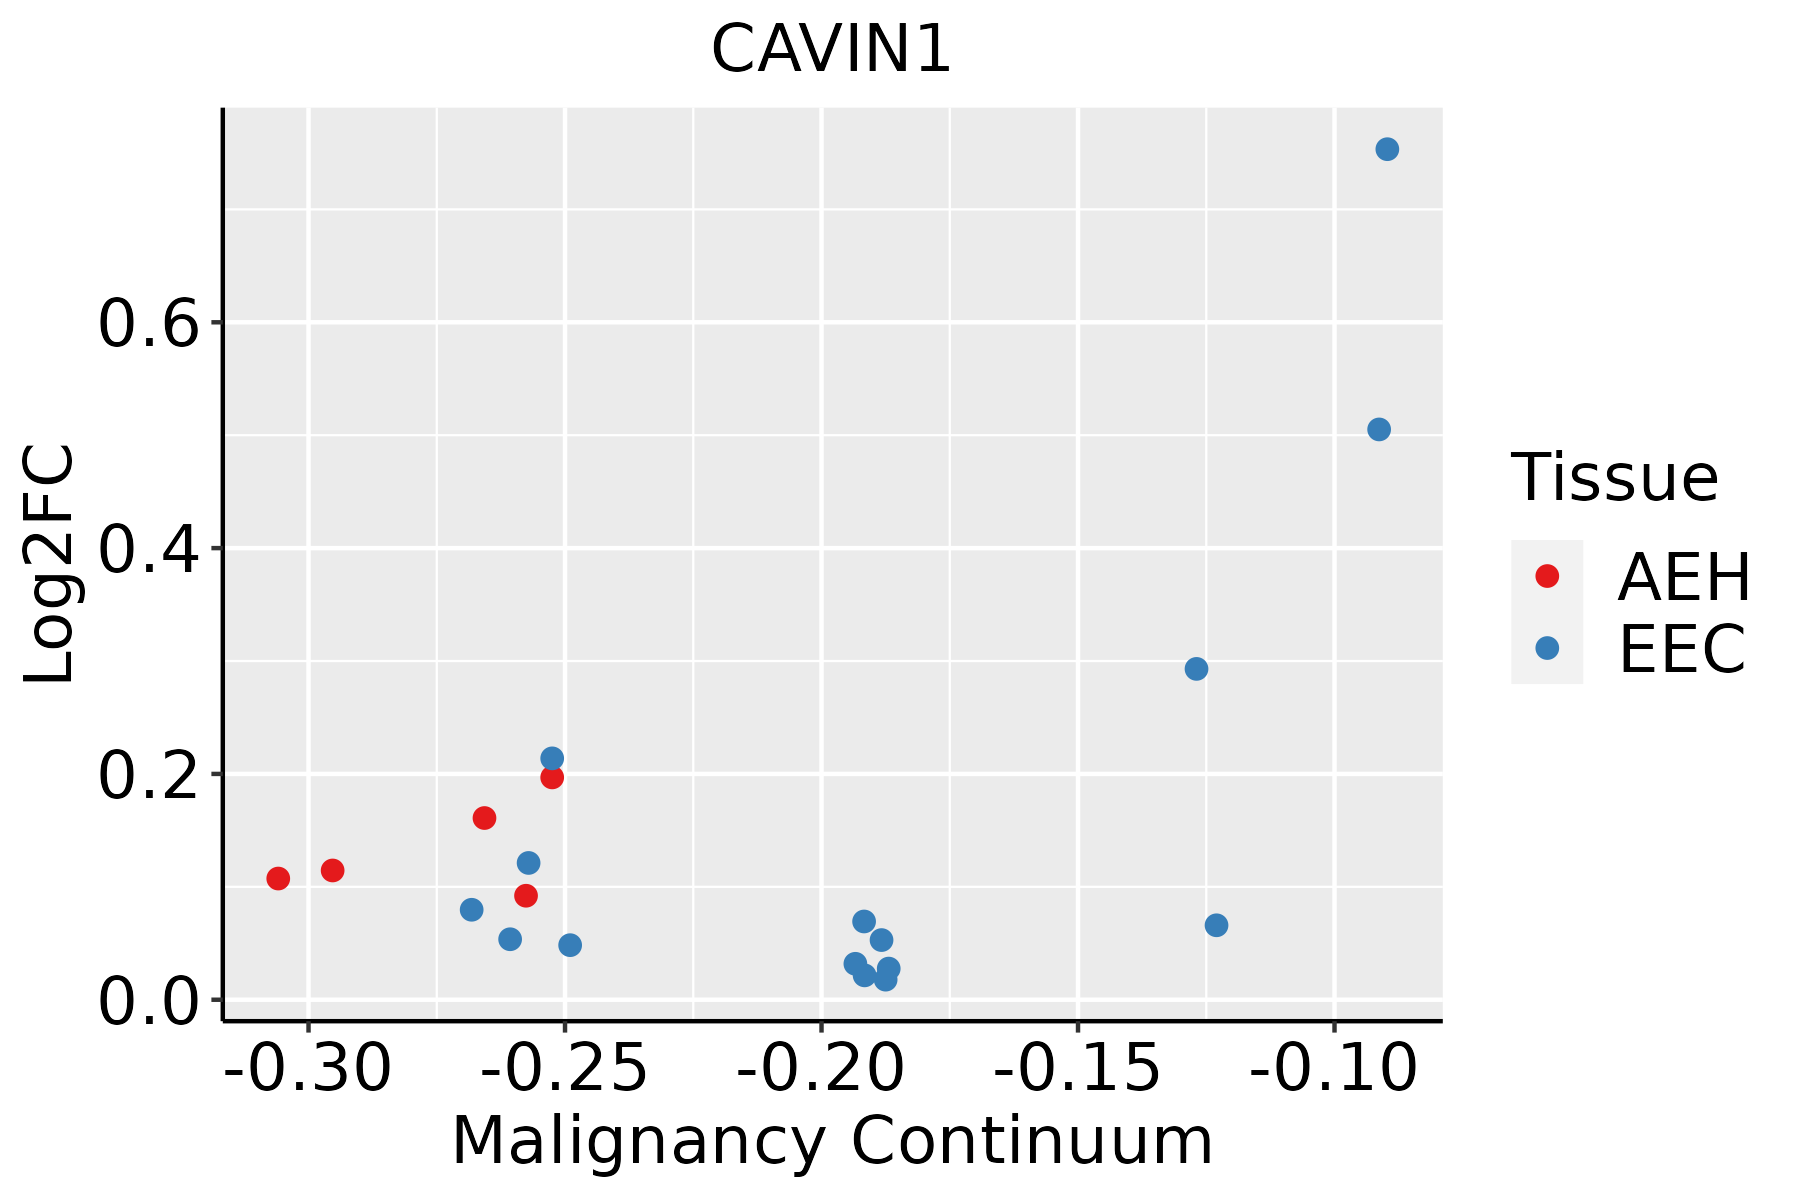 | AEH: Atypical endometrial hyperplasia |
| EEC: Endometrioid Cancer | ||
| Esophagus |  | ESCC: Esophageal squamous cell carcinoma |
| HGIN: High-grade intraepithelial neoplasias | ||
| LGIN: Low-grade intraepithelial neoplasias | ||
| Liver |  | HCC: Hepatocellular carcinoma |
| NAFLD: Non-alcoholic fatty liver disease | ||
| Prostate |  | BPH: Benign Prostatic Hyperplasia |
| Skin |  | AK: Actinic keratosis |
| cSCC: Cutaneous squamous cell carcinoma | ||
| SCCIS:squamous cell carcinoma in situ | ||
| Thyroid | 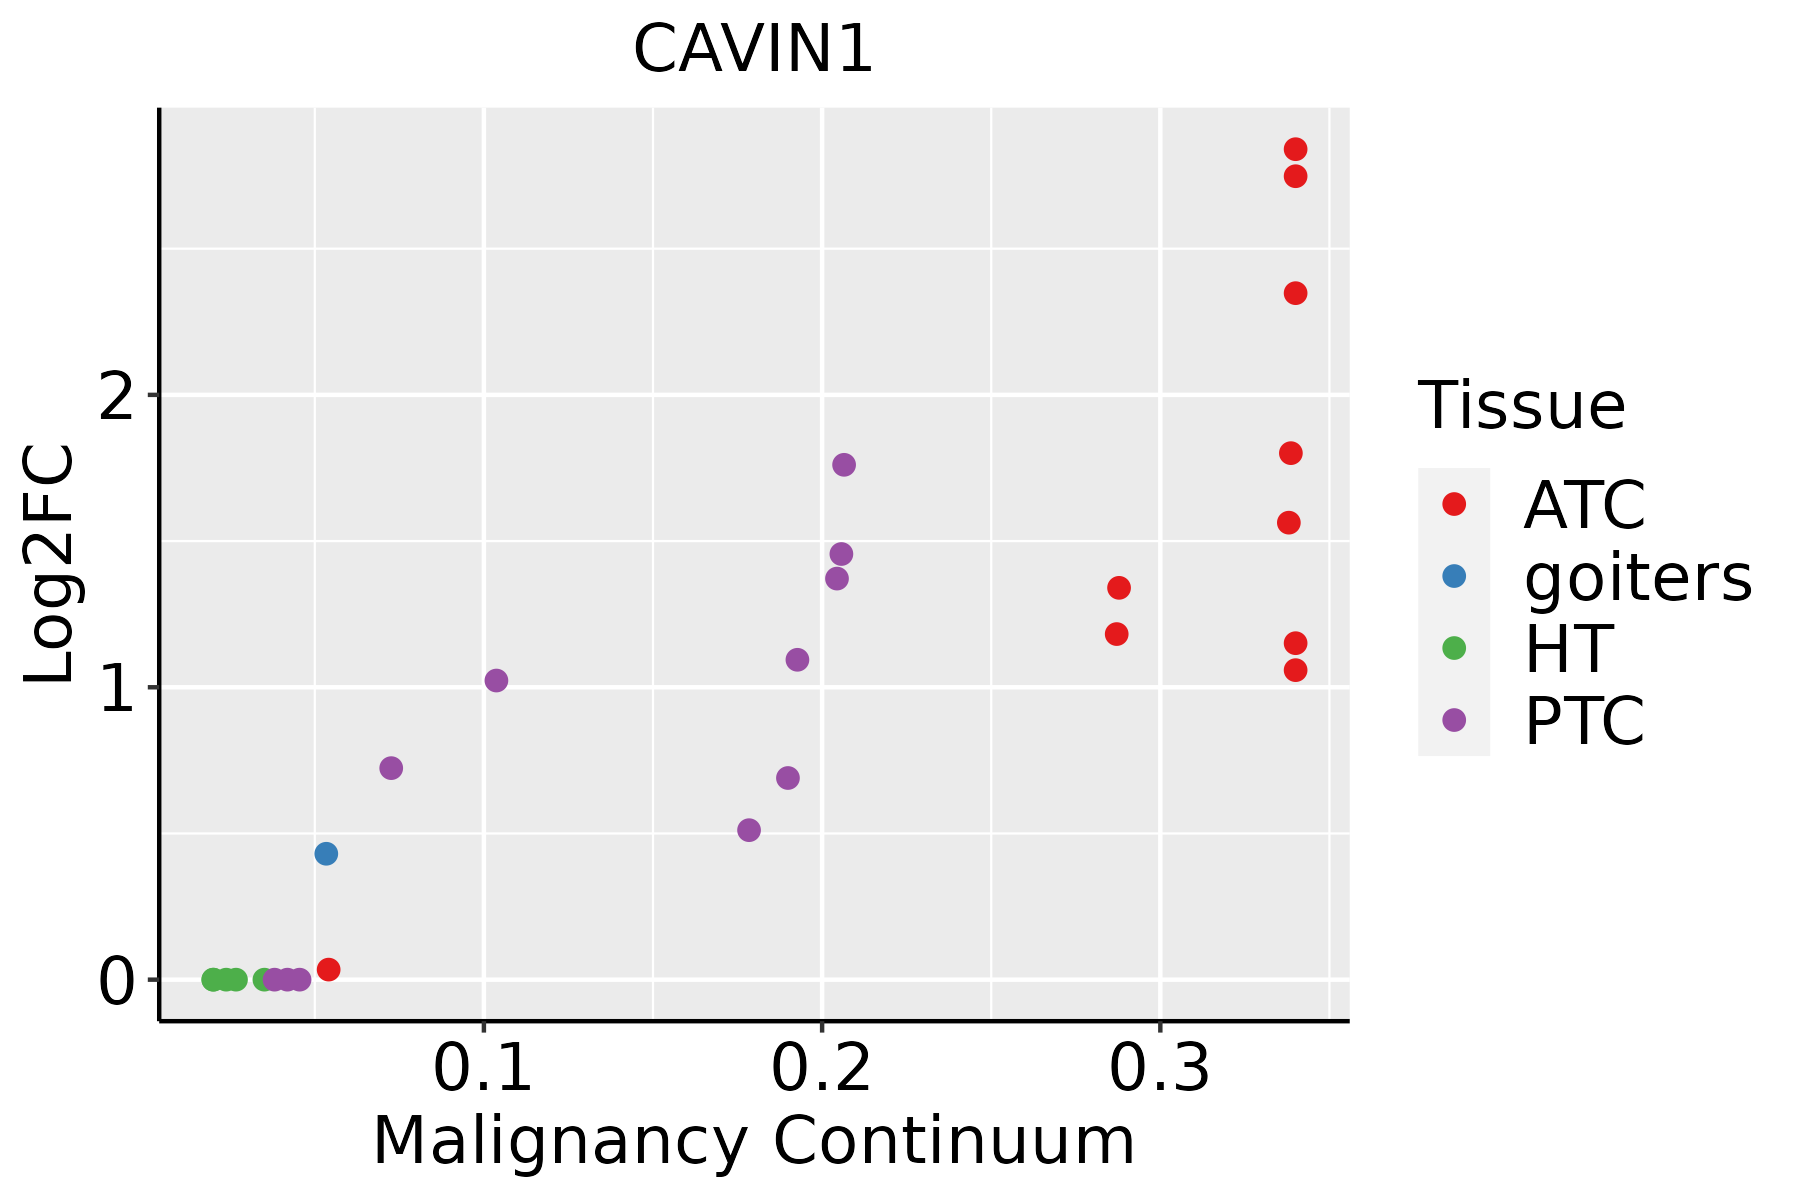 | ATC: Anaplastic thyroid cancer |
| HT: Hashimoto's thyroiditis | ||
| PTC: Papillary thyroid cancer |
| ∗log2FC in expression of this searched gene in stem-like cells from each diseased tissue sample relative to stem-like cells in normal samples in each tissue plotted against the malignancy continuum. Samples are colored based on if they are from different disease stage. |
Top |
Malignant transformation related pathway analysis |
| Find out the enriched GO biological processes and KEGG pathways involved in transition from healthy to precancer to cancer |
| Tissue | Disease Stage | Enriched GO biological Processes |
| Colorectum | AD |  |
| Colorectum | SER |  |
| Colorectum | MSS |  |
| Colorectum | MSI-H |  |
| Colorectum | FAP |  |
| ∗Top 15 enriched GO BP terms are showed in the bar plot of each disease state in each tissue. Each row represents a significant GO biological process which is colored according to the -log10(p.adjust). |
| Page: 1 2 3 4 5 6 7 8 9 |
| GO ID | Tissue | Disease Stage | Description | Gene Ratio | Bg Ratio | pvalue | p.adjust | Count |
| GO:00716926 | Breast | Precancer | protein localization to extracellular region | 34/1080 | 368/18723 | 4.65e-03 | 3.58e-02 | 34 |
| GO:00093067 | Breast | Precancer | protein secretion | 33/1080 | 359/18723 | 5.65e-03 | 4.08e-02 | 33 |
| GO:00355927 | Breast | Precancer | establishment of protein localization to extracellular region | 33/1080 | 360/18723 | 5.89e-03 | 4.21e-02 | 33 |
| GO:007169212 | Breast | IDC | protein localization to extracellular region | 42/1434 | 368/18723 | 6.13e-03 | 4.38e-02 | 42 |
| GO:000930613 | Breast | IDC | protein secretion | 41/1434 | 359/18723 | 6.64e-03 | 4.63e-02 | 41 |
| GO:003559213 | Breast | IDC | establishment of protein localization to extracellular region | 41/1434 | 360/18723 | 6.96e-03 | 4.81e-02 | 41 |
| GO:007169222 | Breast | DCIS | protein localization to extracellular region | 41/1390 | 368/18723 | 6.01e-03 | 4.29e-02 | 41 |
| GO:000930622 | Breast | DCIS | protein secretion | 40/1390 | 359/18723 | 6.59e-03 | 4.61e-02 | 40 |
| GO:003559222 | Breast | DCIS | establishment of protein localization to extracellular region | 40/1390 | 360/18723 | 6.90e-03 | 4.77e-02 | 40 |
| GO:00716927 | Endometrium | AEH | protein localization to extracellular region | 58/2100 | 368/18723 | 4.72e-03 | 3.00e-02 | 58 |
| GO:00093068 | Endometrium | AEH | protein secretion | 56/2100 | 359/18723 | 6.71e-03 | 3.94e-02 | 56 |
| GO:00355928 | Endometrium | AEH | establishment of protein localization to extracellular region | 56/2100 | 360/18723 | 7.10e-03 | 4.09e-02 | 56 |
| GO:007169213 | Endometrium | EEC | protein localization to extracellular region | 59/2168 | 368/18723 | 5.98e-03 | 3.56e-02 | 59 |
| GO:000930614 | Endometrium | EEC | protein secretion | 57/2168 | 359/18723 | 8.30e-03 | 4.57e-02 | 57 |
| GO:003559214 | Endometrium | EEC | establishment of protein localization to extracellular region | 57/2168 | 360/18723 | 8.78e-03 | 4.74e-02 | 57 |
| GO:00063523 | Esophagus | HGIN | DNA-templated transcription, initiation | 30/2587 | 130/18723 | 2.86e-03 | 2.79e-02 | 30 |
| GO:00987812 | Esophagus | ESCC | ncRNA transcription | 45/8552 | 56/18723 | 1.05e-07 | 1.72e-06 | 45 |
| GO:000635211 | Esophagus | ESCC | DNA-templated transcription, initiation | 86/8552 | 130/18723 | 1.88e-06 | 2.19e-05 | 86 |
| GO:00063602 | Esophagus | ESCC | transcription by RNA polymerase I | 42/8552 | 55/18723 | 3.41e-06 | 3.78e-05 | 42 |
| GO:00093032 | Esophagus | ESCC | rRNA transcription | 28/8552 | 34/18723 | 1.21e-05 | 1.12e-04 | 28 |
| Page: 1 2 3 |
| Pathway ID | Tissue | Disease Stage | Description | Gene Ratio | Bg Ratio | pvalue | p.adjust | qvalue | Count |
| Page: 1 |
Top |
Cell-cell communication analysis |
| Identification of potential cell-cell interactions between two cell types and their ligand-receptor pairs for different disease states |
| Ligand | Receptor | LRpair | Pathway | Tissue | Disease Stage |
| Page: 1 |
Top |
Single-cell gene regulatory network inference analysis |
| Find out the significant the regulons (TFs) and the target genes of each regulon across cell types for different disease states |
| TF | Cell Type | Tissue | Disease Stage | Target Gene | RSS | Regulon Activity |
| ∗The dot plots of a searched regulon are shown for all cell subpopulations in each disease state of each tissue based on the regulon specific score inferred using pySCENIC and by calculating the average expression. |
| Page: 1 |
Top |
Somatic mutation of malignant transformation related genes |
| Annotation of somatic variants for genes involved in malignant transformation |
| Hugo Symbol | Variant Class | Variant Classification | dbSNP RS | HGVSc | HGVSp | HGVSp Short | SWISSPROT | BIOTYPE | SIFT | PolyPhen | Tumor Sample Barcode | Tissue | Histology | Sex | Age | Stage | Therapy Types | Drugs | Outcome |
| Page: 1 |
Top |
Related drugs of malignant transformation related genes |
| Identification of chemicals and drugs interact with genes involved in malignant transfromation |
| (DGIdb 4.0) |
| Entrez ID | Symbol | Category | Interaction Types | Drug Claim Name | Drug Name | PMIDs |
| Page: 1 |

Copyright 2023-Present -The University of Texas Health Science Center at Houston |