
|
|||||
|
 | |
| |
| |
| |
| |
| |
|
Gene: CAV2 |
Gene summary for CAV2 |
| Gene information | Species | Human | Gene symbol | CAV2 | Gene ID | 858 |
| Gene name | caveolin 2 | |
| Gene Alias | CAV | |
| Cytomap | 7q31.2 | |
| Gene Type | protein-coding | GO ID | GO:0000165 | UniProtAcc | P51636 |
Top |
Malignant transformation analysis |
| Identification of the aberrant gene expression in precancerous and cancerous lesions by comparing the gene expression of stem-like cells in diseased tissues with normal stem cells |
| Entrez ID | Symbol | Replicates | Species | Organ | Tissue | Adj P-value | Log2FC | Malignancy |
| 858 | CAV2 | CA_HPV_1 | Human | Cervix | CC | 1.80e-09 | -2.85e-01 | 0.0264 |
| 858 | CAV2 | CA_HPV_3 | Human | Cervix | CC | 1.23e-03 | 1.36e-01 | 0.0414 |
| 858 | CAV2 | N_HPV_1 | Human | Cervix | N_HPV | 1.03e-04 | -2.50e-01 | 0.0079 |
| 858 | CAV2 | CCII_1 | Human | Cervix | CC | 2.70e-02 | -2.72e-01 | 0.3249 |
| 858 | CAV2 | Tumor | Human | Cervix | CC | 1.30e-15 | 4.91e-01 | 0.1241 |
| 858 | CAV2 | sample3 | Human | Cervix | CC | 1.74e-28 | 5.98e-01 | 0.1387 |
| 858 | CAV2 | T3 | Human | Cervix | CC | 5.57e-26 | 5.62e-01 | 0.1389 |
| 858 | CAV2 | LZE2T | Human | Esophagus | ESCC | 8.91e-04 | 4.64e-01 | 0.082 |
| 858 | CAV2 | LZE5T | Human | Esophagus | ESCC | 2.94e-03 | -2.62e-01 | 0.0514 |
| 858 | CAV2 | LZE7T | Human | Esophagus | ESCC | 2.73e-06 | -9.37e-02 | 0.0667 |
| 858 | CAV2 | LZE22D1 | Human | Esophagus | HGIN | 1.32e-05 | -3.88e-01 | 0.0595 |
| 858 | CAV2 | P2T-E | Human | Esophagus | ESCC | 5.23e-08 | -1.60e-01 | 0.1177 |
| 858 | CAV2 | P4T-E | Human | Esophagus | ESCC | 7.47e-04 | 2.46e-01 | 0.1323 |
| 858 | CAV2 | P5T-E | Human | Esophagus | ESCC | 6.03e-37 | 1.30e+00 | 0.1327 |
| 858 | CAV2 | P9T-E | Human | Esophagus | ESCC | 6.24e-11 | 7.11e-01 | 0.1131 |
| 858 | CAV2 | P10T-E | Human | Esophagus | ESCC | 9.39e-10 | 3.24e-01 | 0.116 |
| 858 | CAV2 | P11T-E | Human | Esophagus | ESCC | 1.21e-04 | 1.31e+00 | 0.1426 |
| 858 | CAV2 | P12T-E | Human | Esophagus | ESCC | 9.43e-24 | 8.11e-01 | 0.1122 |
| 858 | CAV2 | P15T-E | Human | Esophagus | ESCC | 1.01e-13 | 9.22e-01 | 0.1149 |
| 858 | CAV2 | P16T-E | Human | Esophagus | ESCC | 2.41e-14 | -4.89e-02 | 0.1153 |
| Page: 1 2 3 4 5 6 7 8 |
| Tissue | Expression Dynamics | Abbreviation |
| Cervix | 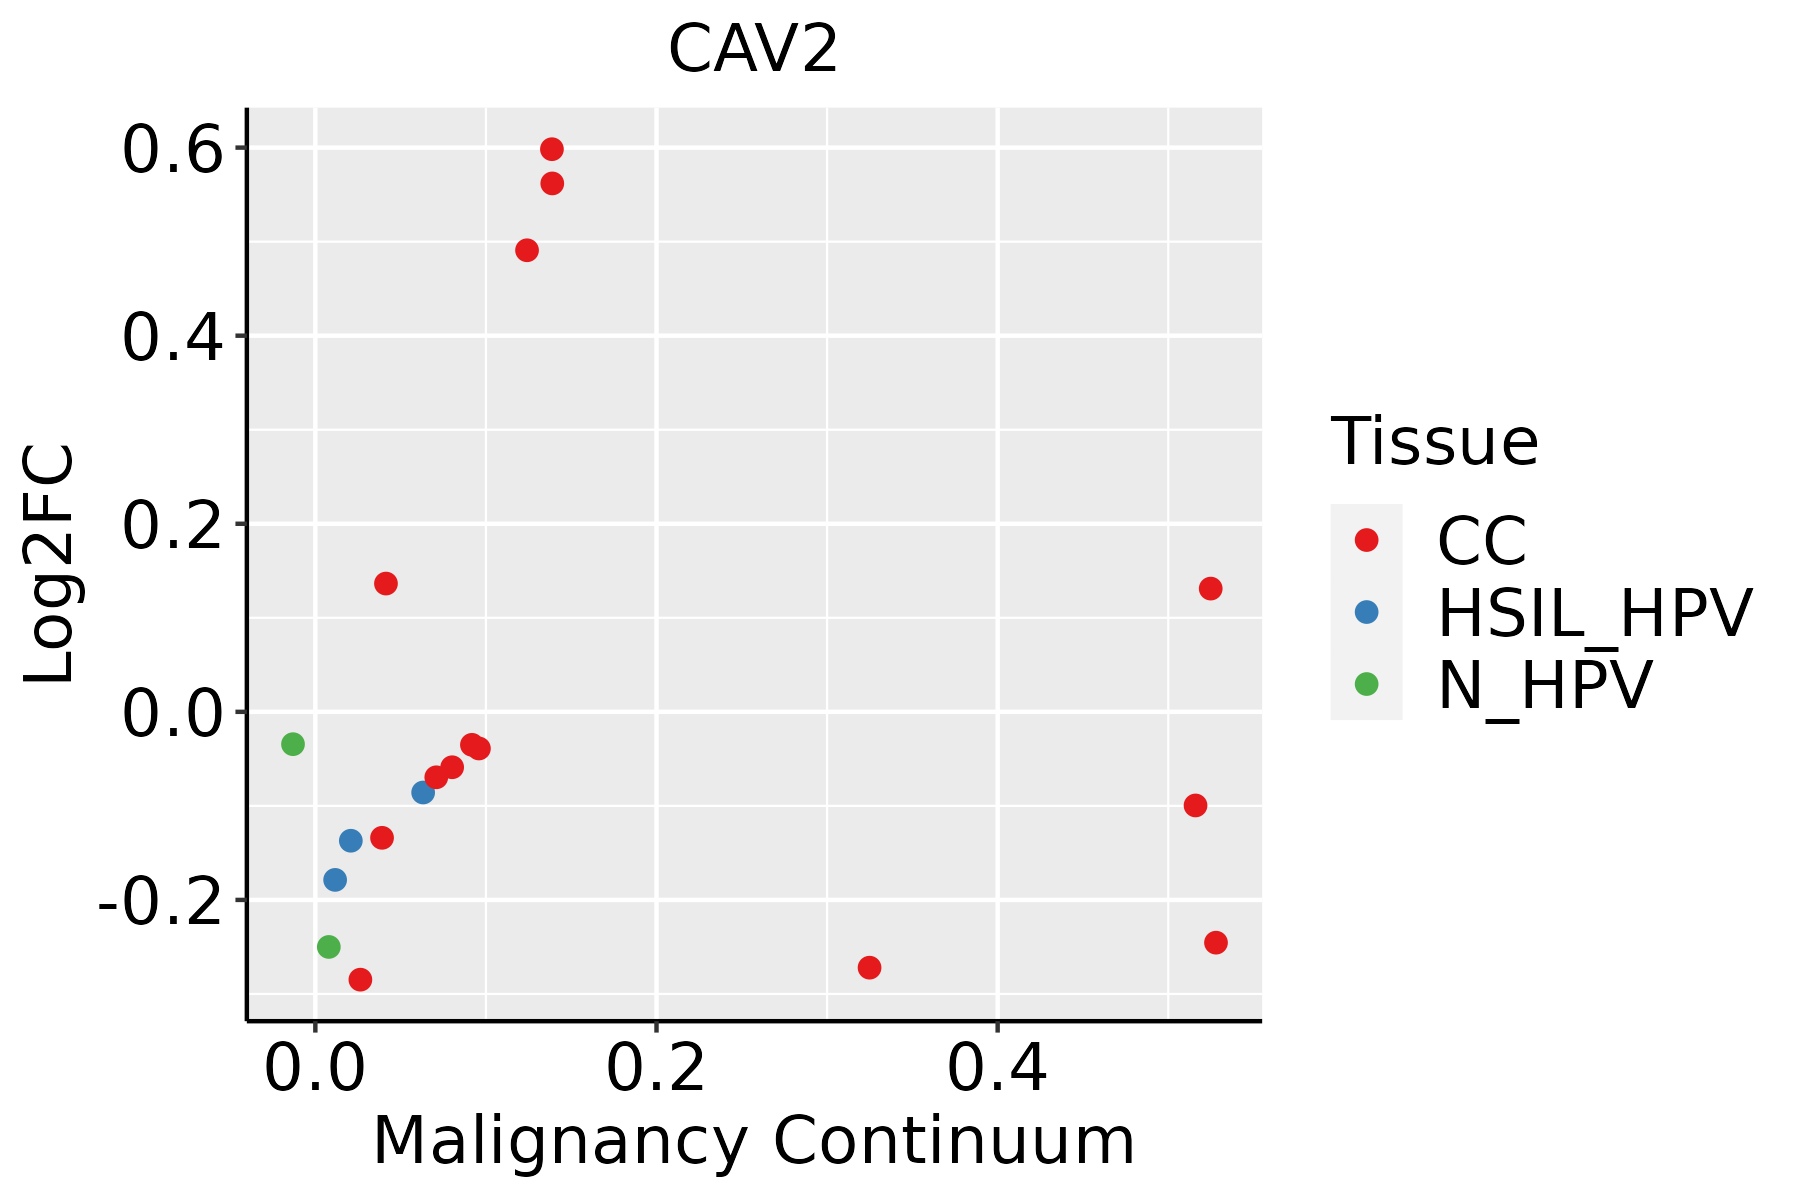 | CC: Cervix cancer |
| HSIL_HPV: HPV-infected high-grade squamous intraepithelial lesions | ||
| N_HPV: HPV-infected normal cervix | ||
| Esophagus | 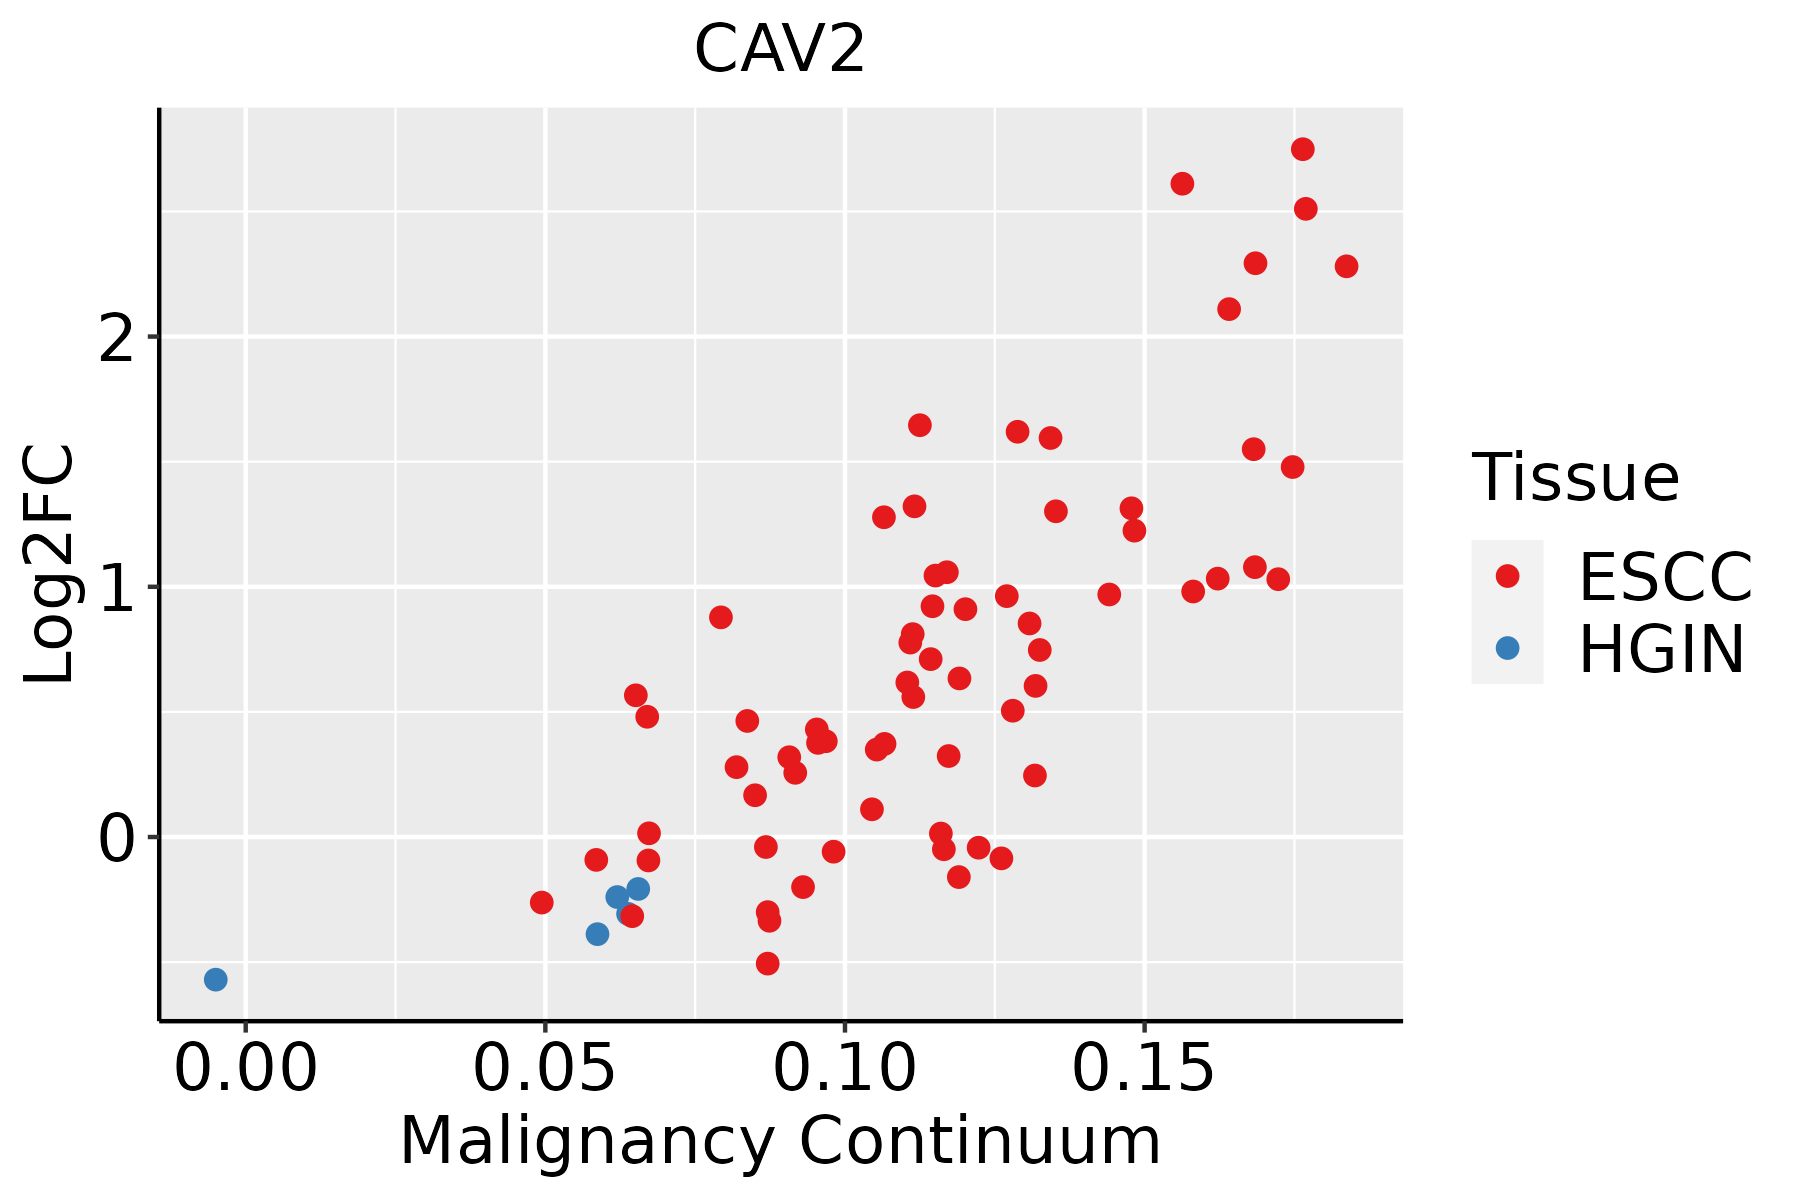 | ESCC: Esophageal squamous cell carcinoma |
| HGIN: High-grade intraepithelial neoplasias | ||
| LGIN: Low-grade intraepithelial neoplasias | ||
| Liver |  | HCC: Hepatocellular carcinoma |
| NAFLD: Non-alcoholic fatty liver disease | ||
| Oral Cavity | 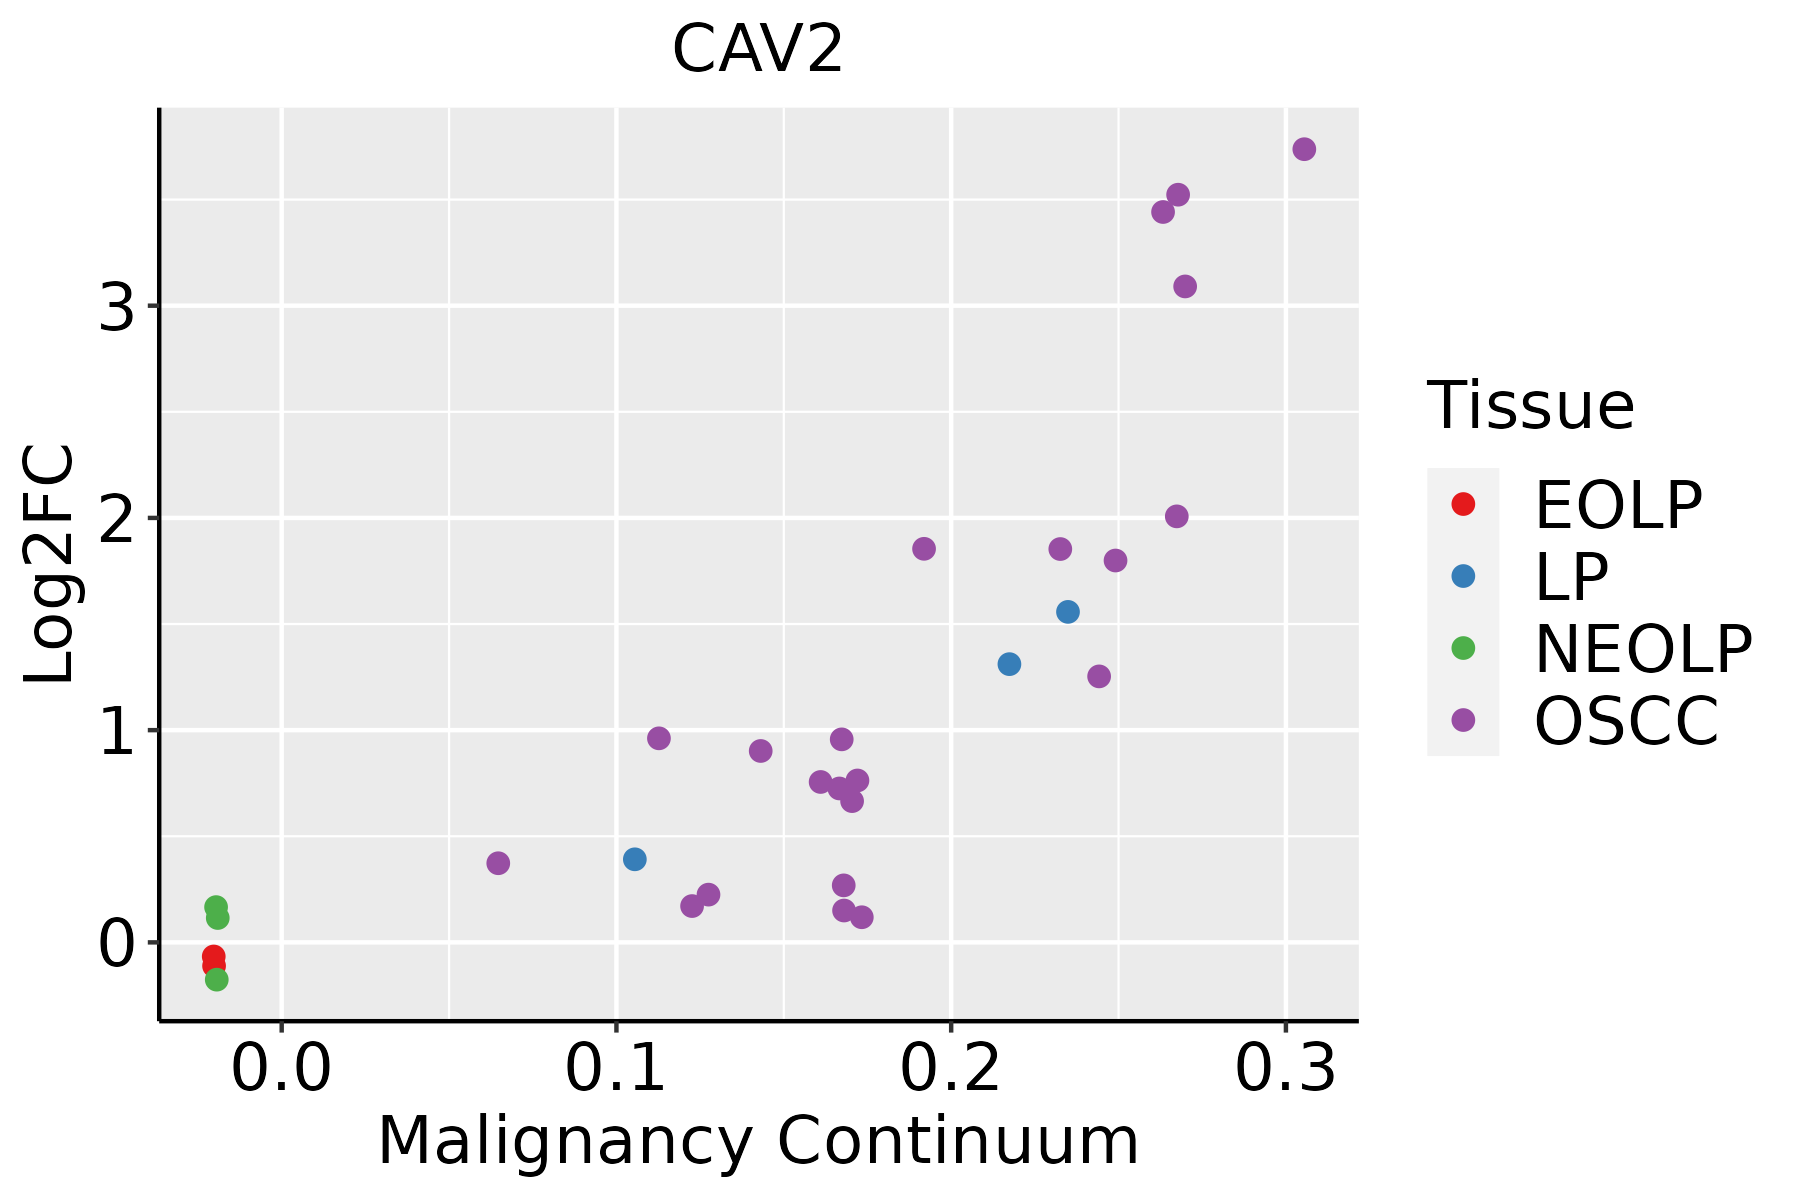 | EOLP: Erosive Oral lichen planus |
| LP: leukoplakia | ||
| NEOLP: Non-erosive oral lichen planus | ||
| OSCC: Oral squamous cell carcinoma | ||
| Prostate | 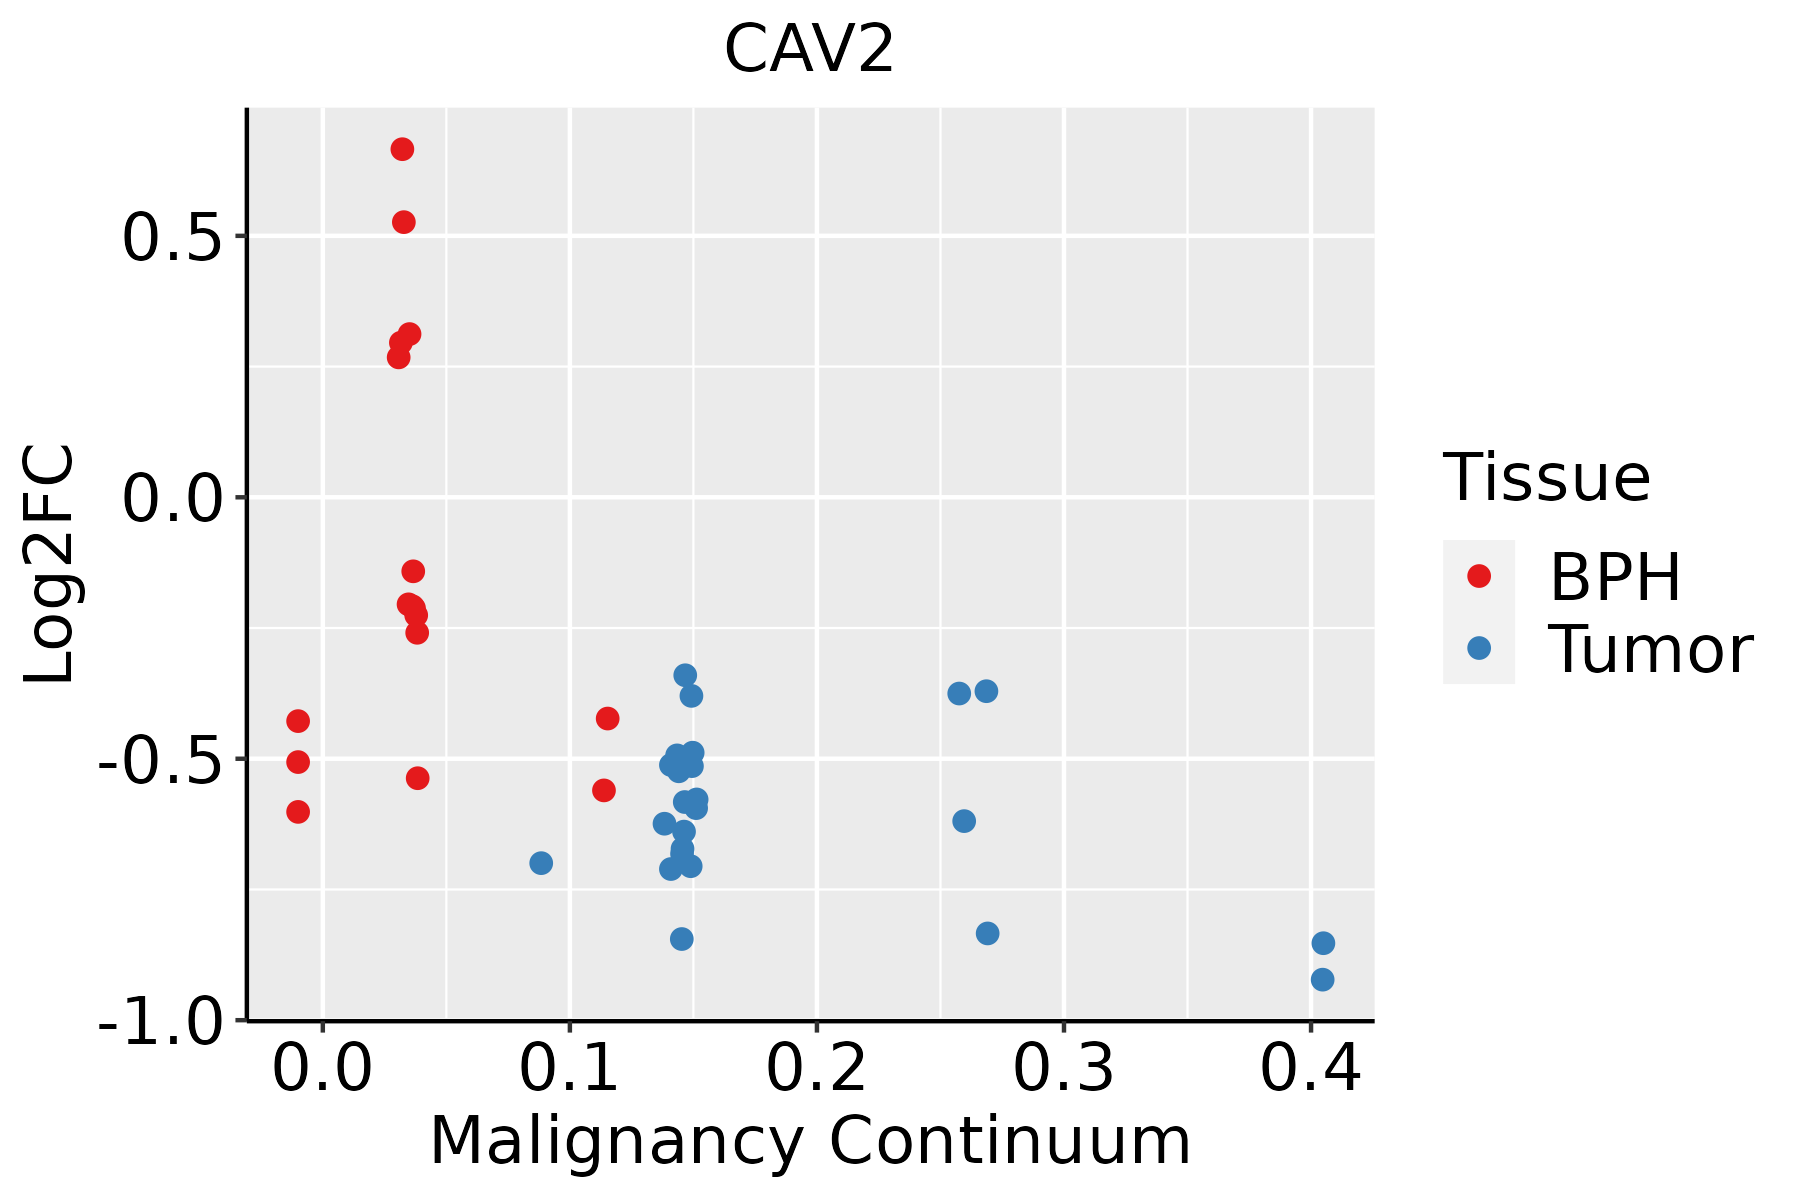 | BPH: Benign Prostatic Hyperplasia |
| Skin | 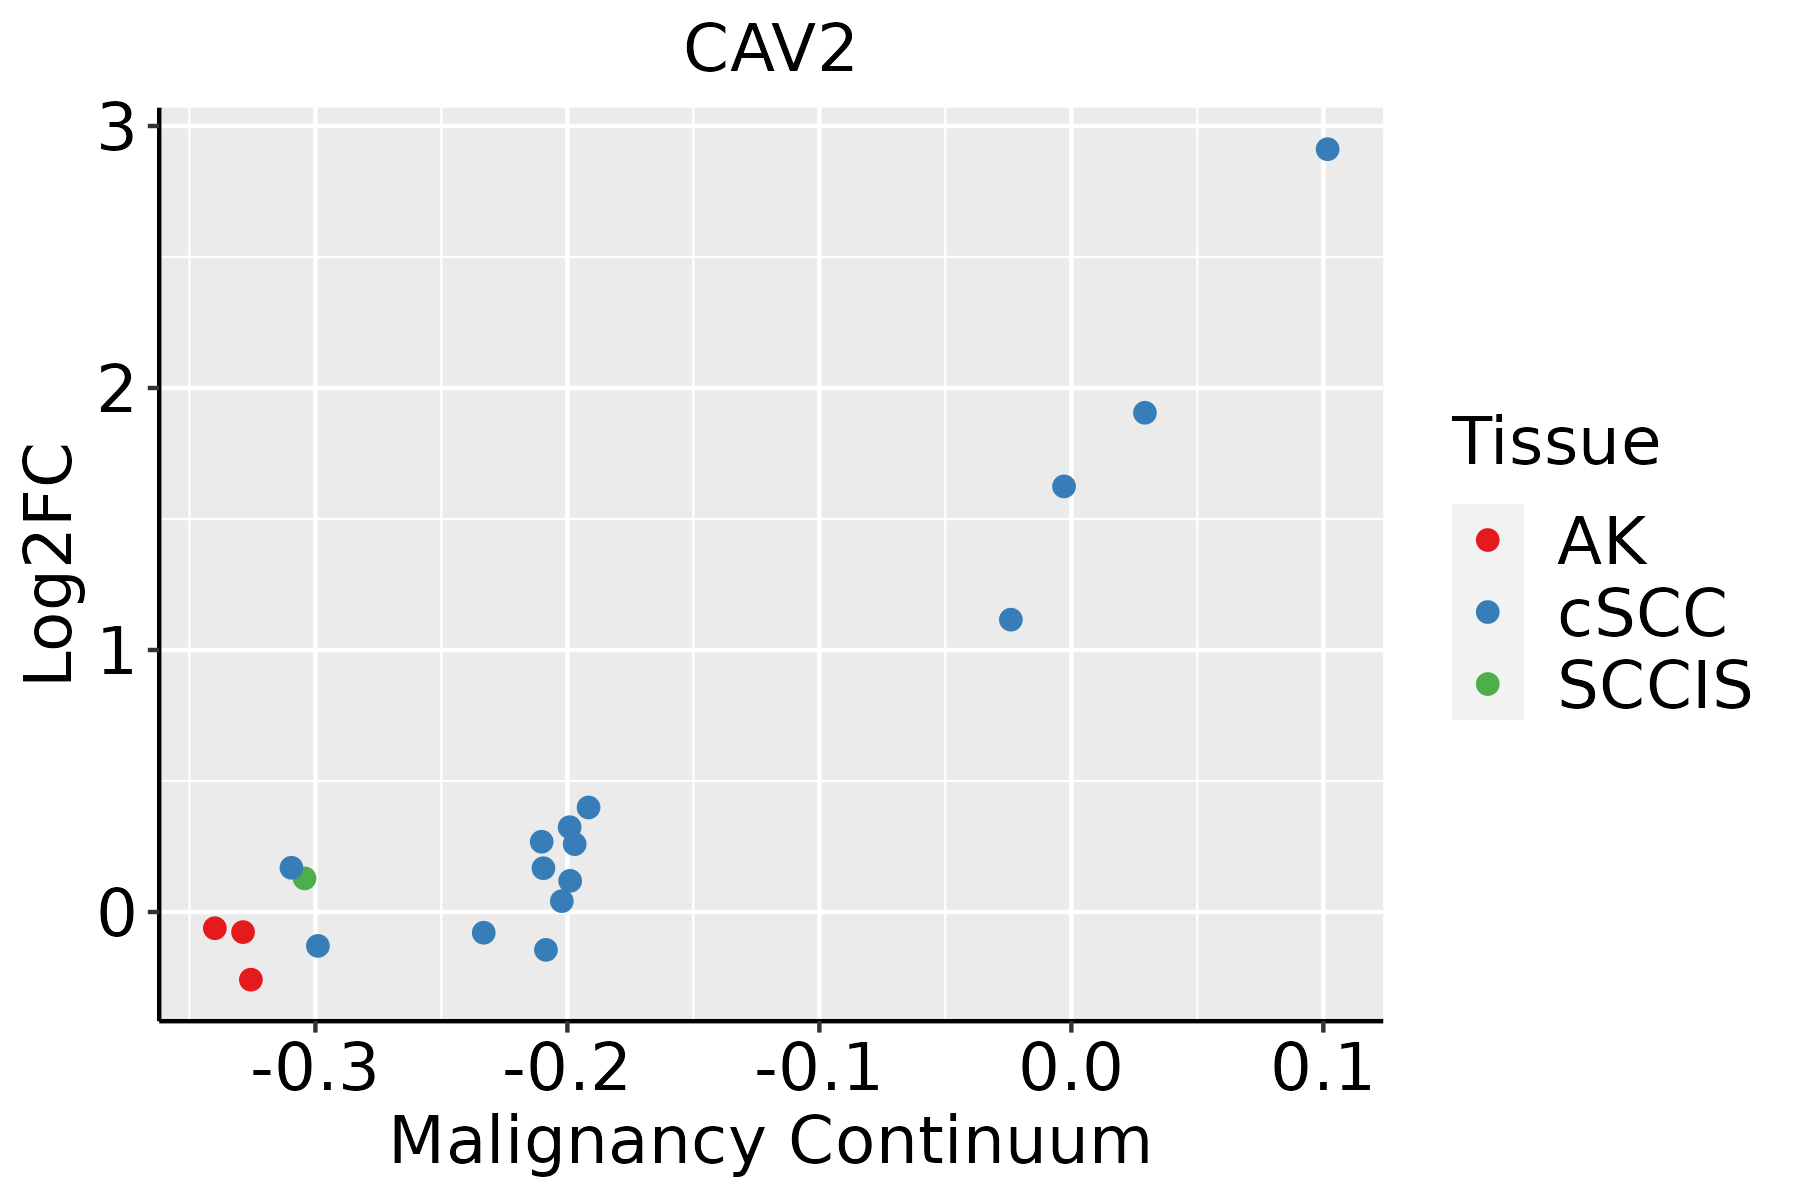 | AK: Actinic keratosis |
| cSCC: Cutaneous squamous cell carcinoma | ||
| SCCIS:squamous cell carcinoma in situ | ||
| Thyroid | 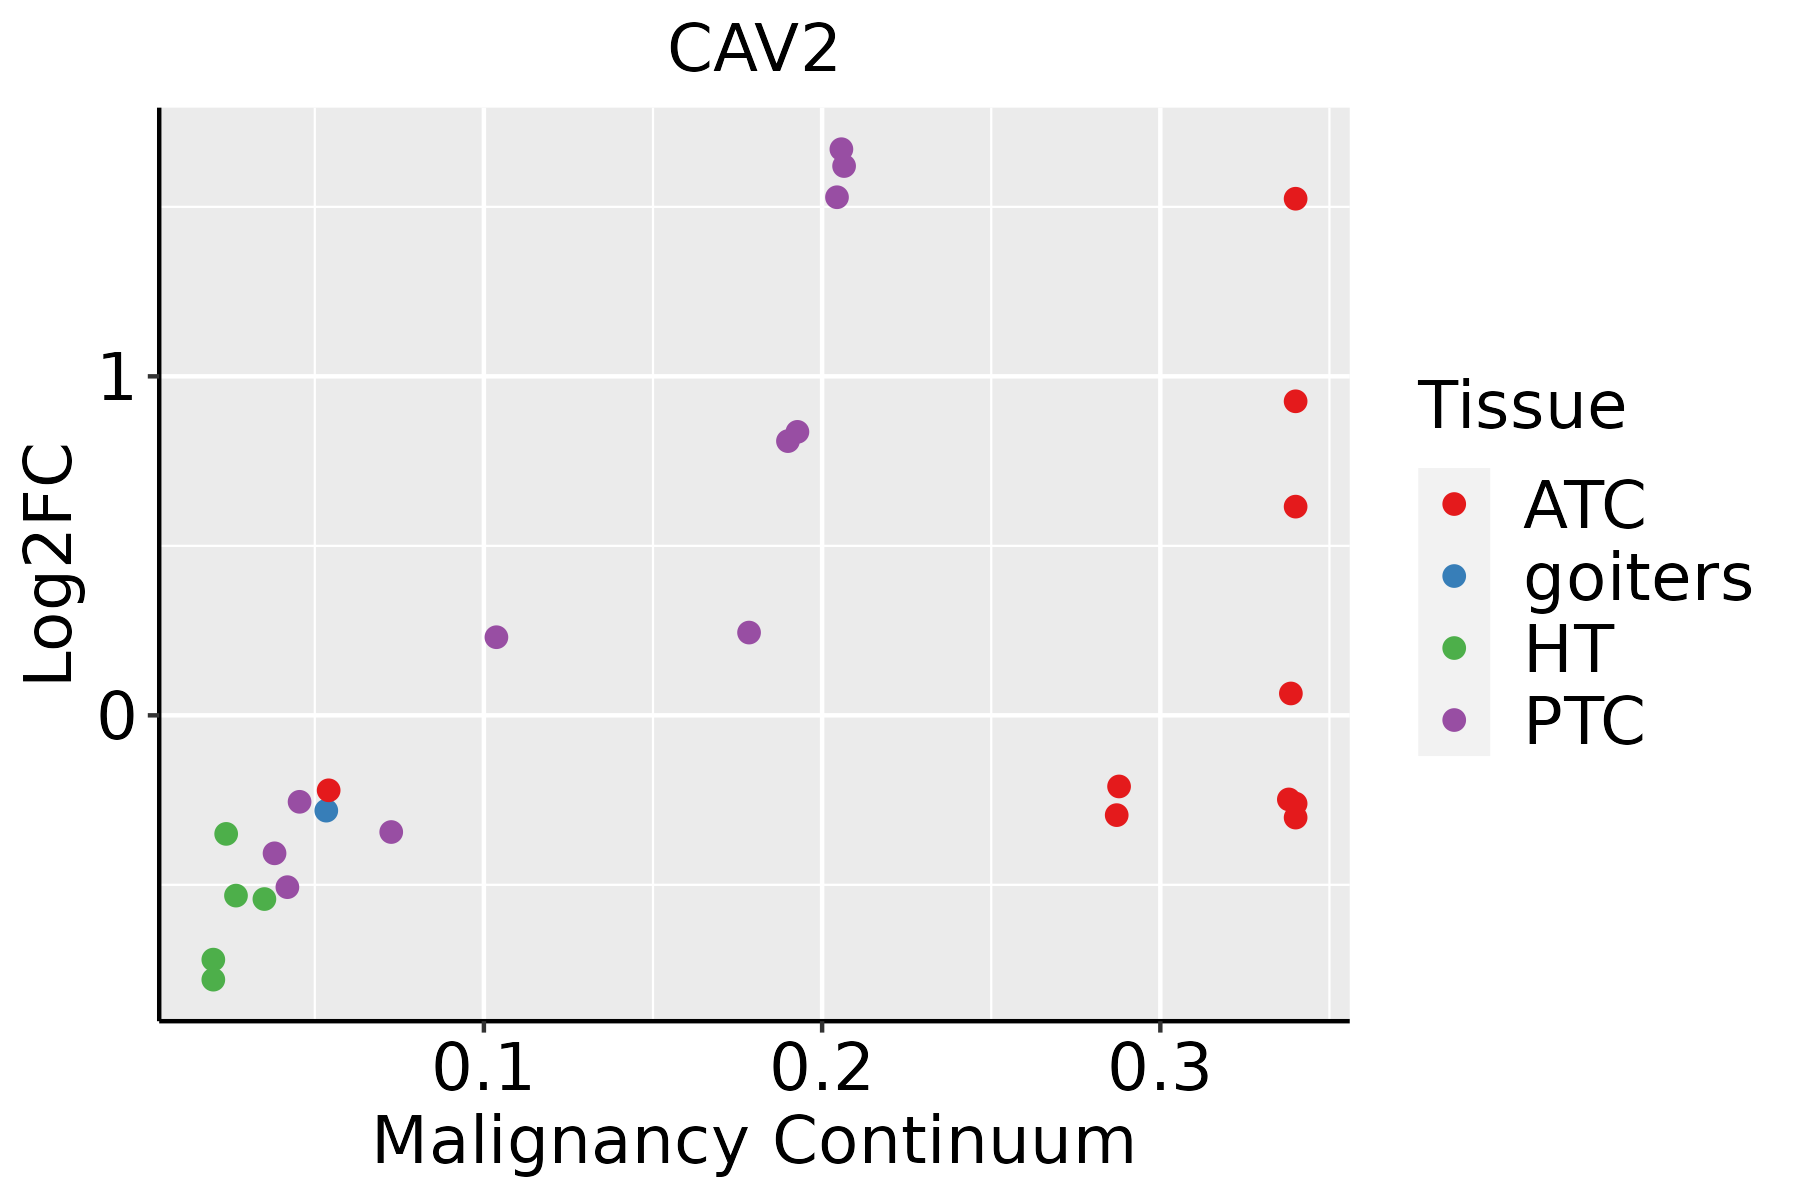 | ATC: Anaplastic thyroid cancer |
| HT: Hashimoto's thyroiditis | ||
| PTC: Papillary thyroid cancer |
| ∗log2FC in expression of this searched gene in stem-like cells from each diseased tissue sample relative to stem-like cells in normal samples in each tissue plotted against the malignancy continuum. Samples are colored based on if they are from different disease stage. |
Top |
Malignant transformation related pathway analysis |
| Find out the enriched GO biological processes and KEGG pathways involved in transition from healthy to precancer to cancer |
| Tissue | Disease Stage | Enriched GO biological Processes |
| Colorectum | AD |  |
| Colorectum | SER |  |
| Colorectum | MSS |  |
| Colorectum | MSI-H |  |
| Colorectum | FAP |  |
| ∗Top 15 enriched GO BP terms are showed in the bar plot of each disease state in each tissue. Each row represents a significant GO biological process which is colored according to the -log10(p.adjust). |
| Page: 1 2 3 4 5 6 7 8 9 |
| GO ID | Tissue | Disease Stage | Description | Gene Ratio | Bg Ratio | pvalue | p.adjust | Count |
| GO:001603210 | Cervix | CC | viral process | 109/2311 | 415/18723 | 5.40e-15 | 6.46e-12 | 109 |
| GO:001905810 | Cervix | CC | viral life cycle | 87/2311 | 317/18723 | 2.20e-13 | 1.20e-10 | 87 |
| GO:005212610 | Cervix | CC | movement in host environment | 52/2311 | 175/18723 | 7.03e-10 | 8.76e-08 | 52 |
| GO:004440910 | Cervix | CC | entry into host | 47/2311 | 151/18723 | 8.45e-10 | 1.03e-07 | 47 |
| GO:005170110 | Cervix | CC | biological process involved in interaction with host | 57/2311 | 203/18723 | 1.18e-09 | 1.41e-07 | 57 |
| GO:00506737 | Cervix | CC | epithelial cell proliferation | 98/2311 | 437/18723 | 2.01e-09 | 2.15e-07 | 98 |
| GO:004671810 | Cervix | CC | viral entry into host cell | 44/2311 | 144/18723 | 5.47e-09 | 5.03e-07 | 44 |
| GO:004440310 | Cervix | CC | biological process involved in symbiotic interaction | 71/2311 | 290/18723 | 7.94e-09 | 6.98e-07 | 71 |
| GO:00430877 | Cervix | CC | regulation of GTPase activity | 79/2311 | 348/18723 | 4.21e-08 | 2.60e-06 | 79 |
| GO:00506787 | Cervix | CC | regulation of epithelial cell proliferation | 83/2311 | 381/18723 | 1.31e-07 | 6.42e-06 | 83 |
| GO:00073466 | Cervix | CC | regulation of mitotic cell cycle | 88/2311 | 457/18723 | 1.26e-05 | 2.60e-04 | 88 |
| GO:19016538 | Cervix | CC | cellular response to peptide | 72/2311 | 359/18723 | 1.89e-05 | 3.48e-04 | 72 |
| GO:00506794 | Cervix | CC | positive regulation of epithelial cell proliferation | 47/2311 | 207/18723 | 2.18e-05 | 3.90e-04 | 47 |
| GO:00068987 | Cervix | CC | receptor-mediated endocytosis | 53/2311 | 244/18723 | 2.52e-05 | 4.29e-04 | 53 |
| GO:00434104 | Cervix | CC | positive regulation of MAPK cascade | 90/2311 | 480/18723 | 2.92e-05 | 4.83e-04 | 90 |
| GO:005079210 | Cervix | CC | regulation of viral process | 38/2311 | 164/18723 | 8.12e-05 | 1.10e-03 | 38 |
| GO:00435476 | Cervix | CC | positive regulation of GTPase activity | 53/2311 | 255/18723 | 8.72e-05 | 1.16e-03 | 53 |
| GO:00605375 | Cervix | CC | muscle tissue development | 76/2311 | 403/18723 | 9.76e-05 | 1.27e-03 | 76 |
| GO:00434349 | Cervix | CC | response to peptide hormone | 77/2311 | 414/18723 | 1.40e-04 | 1.70e-03 | 77 |
| GO:00147064 | Cervix | CC | striated muscle tissue development | 72/2311 | 384/18723 | 1.76e-04 | 2.07e-03 | 72 |
| Page: 1 2 3 4 5 6 7 8 9 10 11 12 13 14 15 16 17 18 19 20 21 22 23 24 25 26 27 28 29 30 31 32 33 34 35 36 37 38 |
| Pathway ID | Tissue | Disease Stage | Description | Gene Ratio | Bg Ratio | pvalue | p.adjust | qvalue | Count |
| hsa0502018 | Cervix | CC | Prion disease | 98/1267 | 273/8465 | 2.64e-18 | 1.42e-16 | 8.42e-17 | 98 |
| hsa0541820 | Cervix | CC | Fluid shear stress and atherosclerosis | 50/1267 | 139/8465 | 5.71e-10 | 1.32e-08 | 7.81e-09 | 50 |
| hsa0520516 | Cervix | CC | Proteoglycans in cancer | 60/1267 | 205/8465 | 9.13e-08 | 1.18e-06 | 7.00e-07 | 60 |
| hsa0451010 | Cervix | CC | Focal adhesion | 59/1267 | 203/8465 | 1.53e-07 | 1.84e-06 | 1.09e-06 | 59 |
| hsa0414418 | Cervix | CC | Endocytosis | 64/1267 | 251/8465 | 6.97e-06 | 6.10e-05 | 3.61e-05 | 64 |
| hsa0510020 | Cervix | CC | Bacterial invasion of epithelial cells | 23/1267 | 77/8465 | 6.25e-04 | 2.93e-03 | 1.73e-03 | 23 |
| hsa0502019 | Cervix | CC | Prion disease | 98/1267 | 273/8465 | 2.64e-18 | 1.42e-16 | 8.42e-17 | 98 |
| hsa05418110 | Cervix | CC | Fluid shear stress and atherosclerosis | 50/1267 | 139/8465 | 5.71e-10 | 1.32e-08 | 7.81e-09 | 50 |
| hsa0520517 | Cervix | CC | Proteoglycans in cancer | 60/1267 | 205/8465 | 9.13e-08 | 1.18e-06 | 7.00e-07 | 60 |
| hsa0451014 | Cervix | CC | Focal adhesion | 59/1267 | 203/8465 | 1.53e-07 | 1.84e-06 | 1.09e-06 | 59 |
| hsa0414419 | Cervix | CC | Endocytosis | 64/1267 | 251/8465 | 6.97e-06 | 6.10e-05 | 3.61e-05 | 64 |
| hsa05100110 | Cervix | CC | Bacterial invasion of epithelial cells | 23/1267 | 77/8465 | 6.25e-04 | 2.93e-03 | 1.73e-03 | 23 |
| hsa0502044 | Cervix | N_HPV | Prion disease | 39/349 | 273/8465 | 6.07e-12 | 4.13e-10 | 3.23e-10 | 39 |
| hsa0541845 | Cervix | N_HPV | Fluid shear stress and atherosclerosis | 20/349 | 139/8465 | 9.29e-07 | 1.41e-05 | 1.10e-05 | 20 |
| hsa0510025 | Cervix | N_HPV | Bacterial invasion of epithelial cells | 10/349 | 77/8465 | 1.17e-03 | 7.93e-03 | 6.20e-03 | 10 |
| hsa0502054 | Cervix | N_HPV | Prion disease | 39/349 | 273/8465 | 6.07e-12 | 4.13e-10 | 3.23e-10 | 39 |
| hsa0541855 | Cervix | N_HPV | Fluid shear stress and atherosclerosis | 20/349 | 139/8465 | 9.29e-07 | 1.41e-05 | 1.10e-05 | 20 |
| hsa0510035 | Cervix | N_HPV | Bacterial invasion of epithelial cells | 10/349 | 77/8465 | 1.17e-03 | 7.93e-03 | 6.20e-03 | 10 |
| hsa0502030 | Esophagus | HGIN | Prion disease | 117/1383 | 273/8465 | 4.15e-26 | 3.38e-24 | 2.69e-24 | 117 |
| hsa0414429 | Esophagus | HGIN | Endocytosis | 76/1383 | 251/8465 | 1.74e-08 | 3.34e-07 | 2.65e-07 | 76 |
| Page: 1 2 3 4 5 6 |
Top |
Cell-cell communication analysis |
| Identification of potential cell-cell interactions between two cell types and their ligand-receptor pairs for different disease states |
| Ligand | Receptor | LRpair | Pathway | Tissue | Disease Stage |
| Page: 1 |
Top |
Single-cell gene regulatory network inference analysis |
| Find out the significant the regulons (TFs) and the target genes of each regulon across cell types for different disease states |
| TF | Cell Type | Tissue | Disease Stage | Target Gene | RSS | Regulon Activity |
| ∗The dot plots of a searched regulon are shown for all cell subpopulations in each disease state of each tissue based on the regulon specific score inferred using pySCENIC and by calculating the average expression. |
| Page: 1 |
Top |
Somatic mutation of malignant transformation related genes |
| Annotation of somatic variants for genes involved in malignant transformation |
| Hugo Symbol | Variant Class | Variant Classification | dbSNP RS | HGVSc | HGVSp | HGVSp Short | SWISSPROT | BIOTYPE | SIFT | PolyPhen | Tumor Sample Barcode | Tissue | Histology | Sex | Age | Stage | Therapy Types | Drugs | Outcome |
| CAV2 | SNV | Missense_Mutation | c.163N>T | p.Asp55Tyr | p.D55Y | P51636 | protein_coding | deleterious(0) | probably_damaging(0.999) | TCGA-C5-A1BQ-01 | Cervix | cervical & endocervical cancer | Female | >=65 | III/IV | Chemotherapy | cisplatin | CR | |
| CAV2 | SNV | Missense_Mutation | c.307C>T | p.Leu103Phe | p.L103F | P51636 | protein_coding | tolerated(0.09) | benign(0.026) | TCGA-AA-3984-01 | Colorectum | colon adenocarcinoma | Female | <65 | I/II | Unknown | Unknown | SD | |
| CAV2 | SNV | Missense_Mutation | novel | c.148N>G | p.Lys50Glu | p.K50E | P51636 | protein_coding | deleterious(0.03) | possibly_damaging(0.61) | TCGA-AA-A010-01 | Colorectum | colon adenocarcinoma | Female | <65 | I/II | Chemotherapy | folinic | CR |
| CAV2 | SNV | Missense_Mutation | c.348G>T | p.Met116Ile | p.M116I | P51636 | protein_coding | tolerated(0.12) | benign(0.007) | TCGA-CM-4752-01 | Colorectum | colon adenocarcinoma | Male | <65 | I/II | Unknown | Unknown | SD | |
| CAV2 | SNV | Missense_Mutation | c.131N>A | p.Arg44Gln | p.R44Q | P51636 | protein_coding | tolerated(0.6) | benign(0.003) | TCGA-DM-A1HB-01 | Colorectum | colon adenocarcinoma | Male | >=65 | III/IV | Unknown | Unknown | SD | |
| CAV2 | SNV | Missense_Mutation | novel | c.188C>T | p.Thr63Met | p.T63M | P51636 | protein_coding | deleterious(0.02) | benign(0.104) | TCGA-A5-A2K5-01 | Endometrium | uterine corpus endometrioid carcinoma | Female | >=65 | I/II | Unknown | Unknown | SD |
| CAV2 | SNV | Missense_Mutation | novel | c.452N>A | p.Cys151Tyr | p.C151Y | P51636 | protein_coding | deleterious(0) | possibly_damaging(0.781) | TCGA-AJ-A2QO-01 | Endometrium | uterine corpus endometrioid carcinoma | Female | >=65 | I/II | Unknown | Unknown | SD |
| CAV2 | SNV | Missense_Mutation | c.307N>A | p.Leu103Ile | p.L103I | P51636 | protein_coding | deleterious(0.04) | benign(0.042) | TCGA-AJ-A3EL-01 | Endometrium | uterine corpus endometrioid carcinoma | Female | <65 | I/II | Unknown | Unknown | SD | |
| CAV2 | SNV | Missense_Mutation | novel | c.197N>C | p.Phe66Ser | p.F66S | P51636 | protein_coding | deleterious(0.03) | possibly_damaging(0.756) | TCGA-AX-A2HJ-01 | Endometrium | uterine corpus endometrioid carcinoma | Female | <65 | I/II | Unknown | Unknown | SD |
| CAV2 | SNV | Missense_Mutation | novel | c.188C>T | p.Thr63Met | p.T63M | P51636 | protein_coding | deleterious(0.02) | benign(0.104) | TCGA-AX-A3FT-01 | Endometrium | uterine corpus endometrioid carcinoma | Female | <65 | I/II | Unknown | Unknown | SD |
| Page: 1 2 |
Top |
Related drugs of malignant transformation related genes |
| Identification of chemicals and drugs interact with genes involved in malignant transfromation |
| (DGIdb 4.0) |
| Entrez ID | Symbol | Category | Interaction Types | Drug Claim Name | Drug Name | PMIDs |
| Page: 1 |

Copyright 2023-Present -The University of Texas Health Science Center at Houston |