
|
|||||
|
 | |
| |
| |
| |
| |
| |
|
Gene: CATSPERB |
Gene summary for CATSPERB |
| Gene information | Species | Human | Gene symbol | CATSPERB | Gene ID | 79820 |
| Gene name | cation channel sperm associated auxiliary subunit beta | |
| Gene Alias | C14orf161 | |
| Cytomap | 14q32.12 | |
| Gene Type | protein-coding | GO ID | GO:0000003 | UniProtAcc | B3KWW9 |
Top |
Malignant transformation analysis |
| Identification of the aberrant gene expression in precancerous and cancerous lesions by comparing the gene expression of stem-like cells in diseased tissues with normal stem cells |
| Entrez ID | Symbol | Replicates | Species | Organ | Tissue | Adj P-value | Log2FC | Malignancy |
| 79820 | CATSPERB | RNA-P17T-P17T-2 | Human | Lung | IAC | 4.96e-05 | 6.66e-01 | 0.3371 |
| 79820 | CATSPERB | RNA-P17T-P17T-4 | Human | Lung | IAC | 1.83e-05 | 6.06e-01 | 0.343 |
| 79820 | CATSPERB | RNA-P17T-P17T-6 | Human | Lung | IAC | 1.04e-03 | 6.25e-01 | 0.3385 |
| 79820 | CATSPERB | RNA-P17T-P17T-8 | Human | Lung | IAC | 1.71e-04 | 6.46e-01 | 0.3329 |
| 79820 | CATSPERB | RNA-P25T1-P25T1-4 | Human | Lung | AIS | 2.14e-02 | 3.64e-01 | -0.2119 |
| 79820 | CATSPERB | RNA-P7T1-P7T1-1 | Human | Lung | AIS | 4.09e-03 | 5.38e-01 | -0.0961 |
| 79820 | CATSPERB | RNA-P7T1-P7T1-2 | Human | Lung | AIS | 1.30e-02 | 4.68e-01 | -0.0876 |
| 79820 | CATSPERB | RNA-P7T1-P7T1-3 | Human | Lung | AIS | 2.29e-05 | 6.87e-01 | -0.0822 |
| 79820 | CATSPERB | RNA-P7T1-P7T1-4 | Human | Lung | AIS | 1.32e-05 | 5.98e-01 | -0.0809 |
| 79820 | CATSPERB | HTA12-16-5 | Human | Pancreas | PDAC | 2.59e-04 | 5.90e-01 | 0.047 |
| 79820 | CATSPERB | HTA12-18-3 | Human | Pancreas | PDAC | 4.30e-02 | 5.11e-01 | 0.0716 |
| Page: 1 |
| Tissue | Expression Dynamics | Abbreviation |
| Lung | 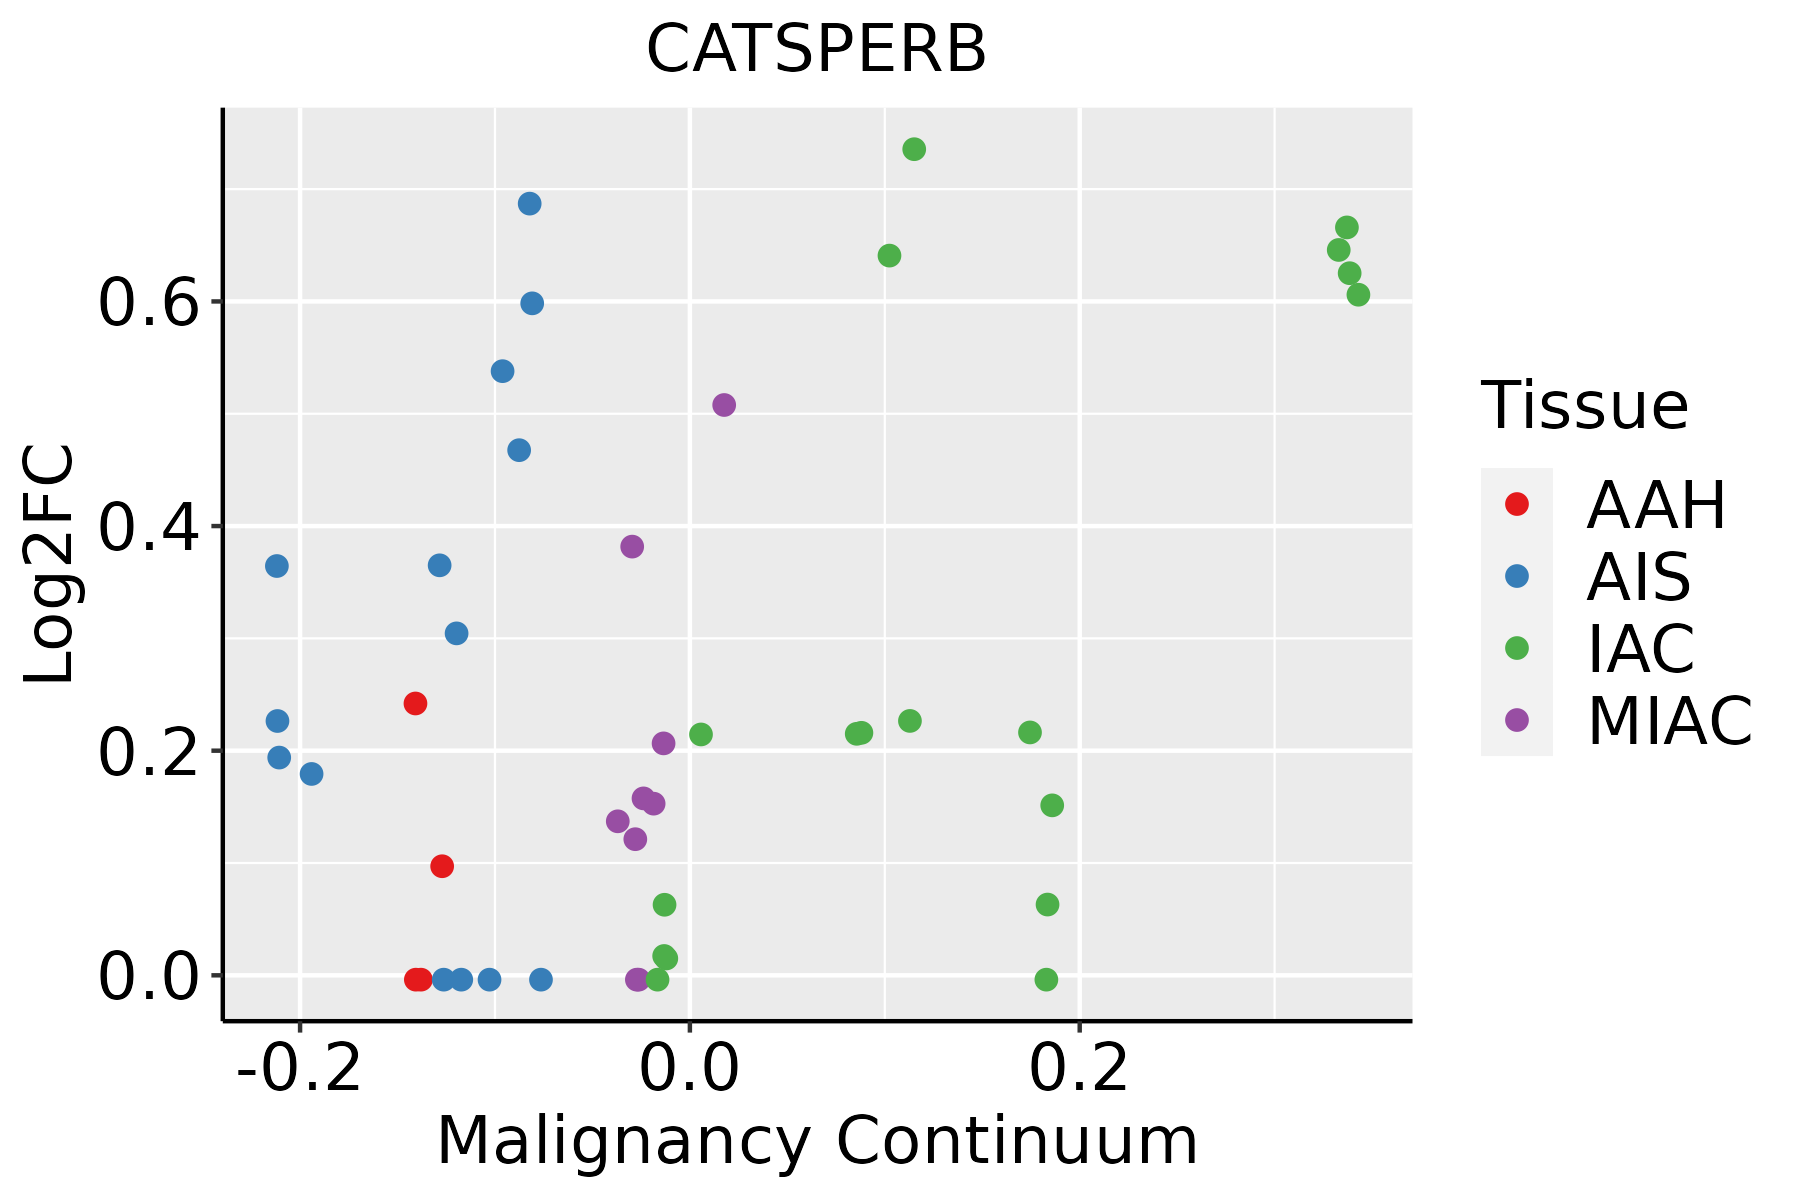 | AAH: Atypical adenomatous hyperplasia |
| AIS: Adenocarcinoma in situ | ||
| IAC: Invasive lung adenocarcinoma | ||
| MIA: Minimally invasive adenocarcinoma |
| ∗log2FC in expression of this searched gene in stem-like cells from each diseased tissue sample relative to stem-like cells in normal samples in each tissue plotted against the malignancy continuum. Samples are colored based on if they are from different disease stage. |
Top |
Malignant transformation related pathway analysis |
| Find out the enriched GO biological processes and KEGG pathways involved in transition from healthy to precancer to cancer |
| Tissue | Disease Stage | Enriched GO biological Processes |
| Colorectum | AD |  |
| Colorectum | SER |  |
| Colorectum | MSS |  |
| Colorectum | MSI-H |  |
| Colorectum | FAP |  |
| ∗Top 15 enriched GO BP terms are showed in the bar plot of each disease state in each tissue. Each row represents a significant GO biological process which is colored according to the -log10(p.adjust). |
| Page: 1 2 3 4 5 6 7 8 9 |
| GO ID | Tissue | Disease Stage | Description | Gene Ratio | Bg Ratio | pvalue | p.adjust | Count |
| Page: 1 |
| Pathway ID | Tissue | Disease Stage | Description | Gene Ratio | Bg Ratio | pvalue | p.adjust | qvalue | Count |
| Page: 1 |
Top |
Cell-cell communication analysis |
| Identification of potential cell-cell interactions between two cell types and their ligand-receptor pairs for different disease states |
| Ligand | Receptor | LRpair | Pathway | Tissue | Disease Stage |
| Page: 1 |
Top |
Single-cell gene regulatory network inference analysis |
| Find out the significant the regulons (TFs) and the target genes of each regulon across cell types for different disease states |
| TF | Cell Type | Tissue | Disease Stage | Target Gene | RSS | Regulon Activity |
| ∗The dot plots of a searched regulon are shown for all cell subpopulations in each disease state of each tissue based on the regulon specific score inferred using pySCENIC and by calculating the average expression. |
| Page: 1 |
Top |
Somatic mutation of malignant transformation related genes |
| Annotation of somatic variants for genes involved in malignant transformation |
| Hugo Symbol | Variant Class | Variant Classification | dbSNP RS | HGVSc | HGVSp | HGVSp Short | SWISSPROT | BIOTYPE | SIFT | PolyPhen | Tumor Sample Barcode | Tissue | Histology | Sex | Age | Stage | Therapy Types | Drugs | Outcome |
| CATSPERB | SNV | Missense_Mutation | rs370881004 | c.1688C>T | p.Thr563Met | p.T563M | Q9H7T0 | protein_coding | tolerated(0.14) | possibly_damaging(0.799) | TCGA-AC-A3QQ-01 | Breast | breast invasive carcinoma | Female | <65 | I/II | Unknown | Unknown | SD |
| CATSPERB | SNV | Missense_Mutation | novel | c.2219N>C | p.Asn740Thr | p.N740T | Q9H7T0 | protein_coding | tolerated(0.24) | benign(0.058) | TCGA-AN-A046-01 | Breast | breast invasive carcinoma | Female | >=65 | I/II | Unknown | Unknown | SD |
| CATSPERB | SNV | Missense_Mutation | c.3346N>C | p.Glu1116Gln | p.E1116Q | Q9H7T0 | protein_coding | deleterious_low_confidence(0) | benign(0.01) | TCGA-AN-A0AM-01 | Breast | breast invasive carcinoma | Female | <65 | I/II | Unknown | Unknown | SD | |
| CATSPERB | SNV | Missense_Mutation | rs372194395 | c.1529N>A | p.Arg510His | p.R510H | Q9H7T0 | protein_coding | tolerated(0.87) | benign(0) | TCGA-BH-A0EE-01 | Breast | breast invasive carcinoma | Female | >=65 | I/II | Chemotherapy | docetaxel | SD |
| CATSPERB | SNV | Missense_Mutation | c.1622N>T | p.Pro541Leu | p.P541L | Q9H7T0 | protein_coding | tolerated(0.99) | benign(0.207) | TCGA-BH-A0HF-01 | Breast | breast invasive carcinoma | Female | >=65 | I/II | Hormone Therapy | arimidex | SD | |
| CATSPERB | SNV | Missense_Mutation | c.2347N>A | p.Asp783Asn | p.D783N | Q9H7T0 | protein_coding | tolerated(0.25) | benign(0.021) | TCGA-D8-A1J9-01 | Breast | breast invasive carcinoma | Female | <65 | I/II | Unknown | Unknown | SD | |
| CATSPERB | insertion | Nonsense_Mutation | novel | c.836_837insACACTGTCTATGAGAAAGGAACATTTATTTCTCAGGA | p.Arg280HisfsTer4 | p.R280Hfs*4 | Q9H7T0 | protein_coding | TCGA-A2-A0EX-01 | Breast | breast invasive carcinoma | Female | <65 | I/II | Hormone Therapy | tamoxiphen | SD | ||
| CATSPERB | insertion | Frame_Shift_Ins | novel | c.1691_1692insAGAATCTAAATTTTTGGGC | p.Tyr565GlufsTer40 | p.Y565Efs*40 | Q9H7T0 | protein_coding | TCGA-A8-A08H-01 | Breast | breast invasive carcinoma | Female | >=65 | I/II | Unknown | Unknown | SD | ||
| CATSPERB | SNV | Missense_Mutation | c.2163N>C | p.Trp721Cys | p.W721C | Q9H7T0 | protein_coding | deleterious(0.02) | probably_damaging(0.912) | TCGA-C5-A7X8-01 | Cervix | cervical & endocervical cancer | Female | <65 | I/II | Chemotherapy | cisplatin | SD | |
| CATSPERB | SNV | Missense_Mutation | novel | c.1409N>C | p.Gly470Ala | p.G470A | Q9H7T0 | protein_coding | deleterious(0.02) | probably_damaging(0.971) | TCGA-DG-A2KK-01 | Cervix | cervical & endocervical cancer | Female | <65 | III/IV | Chemotherapy | cisplatin | SD |
| Page: 1 2 3 4 5 6 7 8 9 10 11 12 |
Top |
Related drugs of malignant transformation related genes |
| Identification of chemicals and drugs interact with genes involved in malignant transfromation |
| (DGIdb 4.0) |
| Entrez ID | Symbol | Category | Interaction Types | Drug Claim Name | Drug Name | PMIDs |
| Page: 1 |

Copyright 2023-Present -The University of Texas Health Science Center at Houston |